 Qizhe Zhang
 Guozheng Peng1
- 1Artificial Intelligence Application Research Department, China Electric Power Research Institute, Beijing, China
- 2North China Electric Power University, Beijing, China
Acoustic signal analysis is an important component of transformer online monitoring. Currently, traditional methods have problems such as low spectral resolution, imbalanced sample distribution, and unsatisfactory classification performance. This article first introduces the matrix pencil algorithm for time-frequency spectrum analysis of acoustic signals, and then uses the SMOTE algorithm to expand the imbalanced samples. Then, an ACmix hybrid deep neural network model is constructed to classify 11 types of transformer operation and environmental acoustic signals. Finally, detailed experiments were conducted on the method proposed in this paper, and the experimental results showed that the matrix pencil algorithm has high time-frequency resolution and good noise resistance performance. The SMOTE sample expansion method can significantly improve the recognition accuracy by more than 2%. Overall accuracy of the proposed method in acoustic signal classification tasks reaches 91.81%.
1 Introduction
As a high-value key equipment in the power system, power transformers need to undergo maintenance work throughout their entire life cycle to ensure the healthy operation (Wardani et al., 2011; Liang et al., 2017). During the operation of transformers, mechanical waves are generated due to the vibration of the iron core and winding, which in turn generate sound waves through the fluid medium (Hsu et al., 2015; Wang et al., 2021). Furthermore, when the insulation of transformers deteriorate, partial discharge may occur (Okabe and Wada, 2011), which can also trigger acoustic signals. Acoustic signals near transformers contain a large amount of equipment status information (Cole, 1997). The collection of acoustic signals has advantages such as non-contact, low cost, and convenience, and thus has broad application prospects in the field of online monitoring of transformers (Sithole et al., 2019; Kucera et al., 2022).
In terms of feature extraction of acoustic signals, it mainly includes time-domain feature extraction, frequency-domain feature extraction, and time-frequency domain feature extraction (Zhang et al., 1998; Lee et al., 2021; Caldeira and Coelho, 2023). The time-frequency spectrum contains both time-domain and frequency-domain information, which has better performance in fault identification (Geng et al., 2019). In the field of pattern recognition of acoustic signals, traditional machine learning methods such as support vector machine (SVM) (Wu et al., 2018), back propagation neural network (BP NN) (Wang et al., 2011) have gradually developed deep learning methods such as convolutional neural network (Lu et al., 2019; Kollias and Zafeiriou, 2021).
With the rapid development of artificial intelligence technology, edge computing technology (Huang et al., 2023), intelligent perception (Zhao et al., 2024) and other technologies, online monitoring of equipment status has been widely used. But the effectiveness of related applications still needs to be improved. The pattern recognition algorithm based on deep neural networks faces the problem of low accuracy in engineering applications. Reference (Huang et al., 2020) introduces Gaussian Bernoulli restricted Boltzmann machines to improve algorithm performance. In different application fields, data preprocessing methods and pattern recognition algorithms require specific improvements to adapt to corresponding tasks.
Currently, there are still three issues in the analysis of transformer acoustic signals:
A) The spatiotemporal resolution of the time-frequency spectrum is insufficient, and there is a problem of signal interference.
B) Treating environmental sounds such as bird singing and rain sound as background noise, ignoring the risk factors present in the transformer environment;
C) The distribution of acoustic signal samples is uneven, and the recognition accuracy is unsatisfactory.
This article focuses on the above issues and introduces the matrix pencil algorithm to improve the time-frequency resolution of acoustic signals and enhance the noise resistance performance. Expand imbalanced samples using the SMOTE algorithm (Bao and Yang, 2023). An ACmix model was constructed to classify transformer operation and environmental sound. Finally, the effectiveness of the method proposed in this article was verified.
2 Research methodology
2.1 Transformer acoustic signal time-frequency spectrum
Spectrum is an important feature in the analysis and processing of acoustic signals. It can reflect the frequency energy distribution of signals at different times, establish a good connection between the time and frequency domains of acoustic signals, and achieve the maximization of acoustic feature information. The generation of time-frequency spectrum mainly includes the process of framing, windowing, and frequency analysis. Traditional frequency analysis methods of acoustic signals are mainly based on Fourier transform, which has problems such as low accuracy and poor anti-interference ability. In contrast, the matrix pencil method (Wang et al., 2017) belongs to the subspace rotation invariant method, which utilizes the orthogonal characteristics of the signal subspace to construct spectral peaks, thereby improving the frequency resolution and anti-interference performance of the algorithm. And since there is no need for iterative operations, the efficiency is high. This article uses matrix pencil method to construct the time-frequency spectrum of sound signals.
2.1.1 Acoustic signal model
The transformer acoustic signal model can be represented as Eq. 1.
Among them, αk, ωk, and θk represent the amplitude, frequency, and initial phase of the k-th frequency component, respectively. βk is the attenuation coefficient of the k-th frequency component.
Among them, Rk = αke±jθ/2; pk = −βk ± jωk。
Considering the presence of noise u (n), the actual observed signal is described in Eq. 3.
2.1.2 Matrix pencil method
For the acoustic signal x (n), construct two (N-L) × L Hankel matrices X1 and X2 are represented as Eqs 4, 5.
Where, L is the matrix pencil parameter, and appropriate selection can reduce the impact of noise. N/3 to 2N/3 is the better choice for L. Represent X1 and X2 as Eqs 6, 7
The variables in Eqs 6, 7 are calculated based on Eqs 8–11.
Then the following Eq. 12 is obtained, i.e.,
The generalized eigenvalue of matrix pencil X1-λX0 includes the number, frequency, and attenuation coefficient of frequency components. Thus the calculation of signal frequency components can be transformed into solving Eq. 13 for generalized features:
In the equation, X+ is the pseudo inverse of X0.
After obtaining the number, frequency, and attenuation coefficient of frequency components of acoustic signals, the signal amplitude can be obtained by solving the following least squares problem shown in Eq. 14.
2.2 Imbalanced sample expansion method
The acoustic signal samples of transformers in different states exhibit significant imbalance, especially in the absence of abnormal samples. To address the issue of sample imbalance, SMOTE is used for sample expansion.
The SMOTE algorithm is an algorithm for expanding minority class samples in imbalanced samples, which is an improvement on the random oversampling algorithm. The random oversampling algorithm expands the dataset by simply copying minority samples, which is prone to overfitting and other issues. The SMOTE algorithm combines the ideas of nearest neighbor analysis and linear interpolation.
Firstly, traverse the minority class samples, select each minority class sample A as the reference value for a single expansion, and calculate its Euclidean distance from other sample point B in the minority class samples according to Eq. 15
Obtain k nearest neighbors of sample point A based on the size of Euclidean distance, randomly select a certain nearest neighbor B, and perform linear interpolation with reference sample A according to Eq. 16 to generate a new sample C. Repeat this n times (n is the given sample expansion ratio)
In Eq. 16, θ Is a random number between (0, 1). After SMOTE process, for each sample A, n new samples will be generated. After traversing all the minority samples, the original number of samples will be expanded to n times the original number, achieving sample expansion through oversampling. The specific flowchart of SMOTE algorithm is shown in Figure 1.
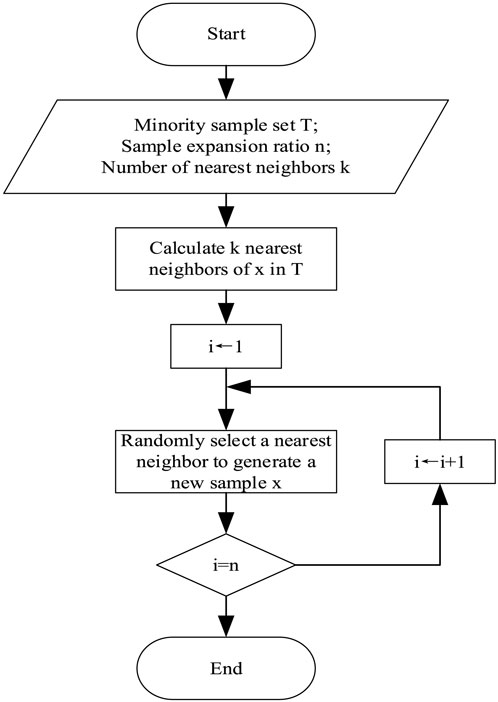
FIGURE 1. Flow chart of SMOTE algorithm.
2.3 Hybrid deep neural network
Convolutional neural network is composed of convolutional layer, pooling layer, and fully connected layer. Compared with traditional artificial neural networks, convolutional neural network has fewer connections between neurons in different layers. Convolutional layers learn features from network inputs, and different convolutional kernels have different feature extraction effect.
Attention mechanism is a special plug and play structure often embedded in convolutional neural networks, used to automatically learn and calculate the contribution of input data to output data. The self attention mechanism is a variant of the attention mechanism, which reduces dependence on external information and is better at capturing internal correlations of data or features. Attention mechanisms are also widely used in visual tasks. Compared to traditional convolutional models, attention allows the model to focus on important regions over a larger range.
This article combines the advantages of residual neural network and self attention mechanism, and uses ACmix algorithm to construct a transformer operation acoustic signal analysis model.
The schematic diagram of ACmix is shown in Figure 2:
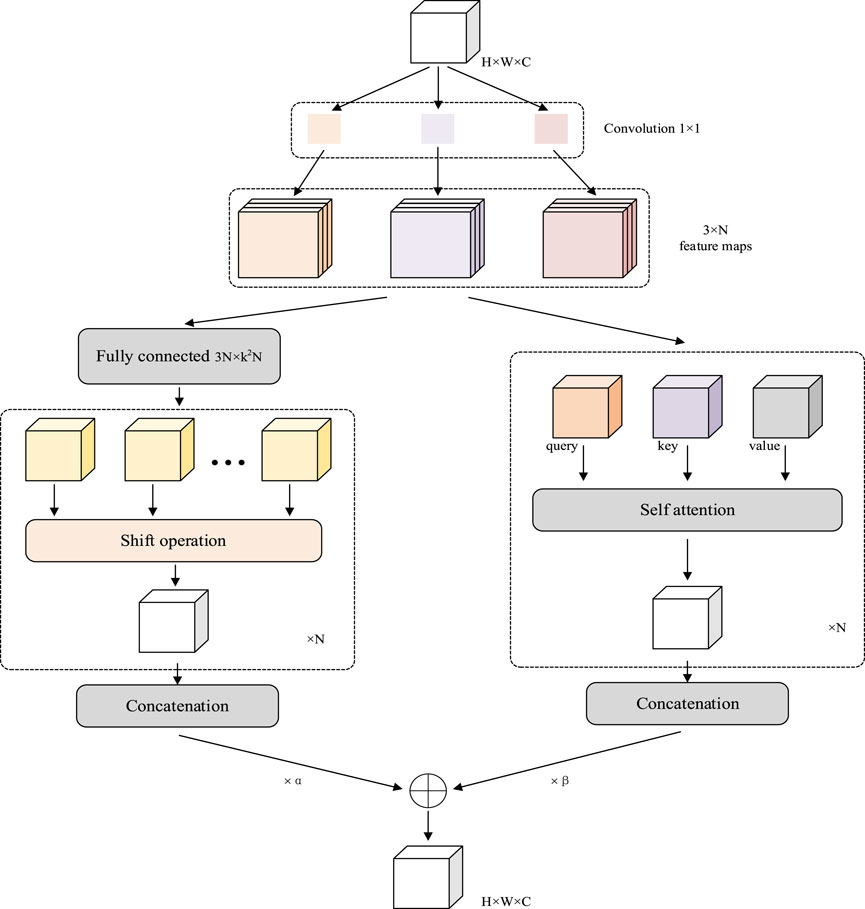
FIGURE 2. Schematic diagram of ACmix.
First, three 1 × 1 convolutions are used to project the input features, and then reshape them into N pieces, thereby obtaining a set of 3 × N intermediate features.
Secondly, parallel self attention computation and convolution computation are carried out. For the self attention part, gather the intermediate features into N groups, each containing 3 features, each from 1 × 1 convolution. The corresponding three feature maps are used as query, key, and value, respectively, using a multi head self attention module. The calculation formula is shown in Eqs 17, 18
where
In the convolutional part, a convolutional kernel with size k is used to generate k2 feature maps using a light fully connected layer.
By shifting and aggregating the generated features, convolution processing is performed on the input features, and information is collected from the local receptive field. Finally, the output is obtained by Eq. 19
Based on the structure of ResNet50, replace the convolutional layer with ACmix module.
3 Manuscript experimental results and analysis
3.1 Performance verification of matrix pencil method
To verify the time-frequency spectrum analysis performance of matrix pencil method. Construct the test signal as shown in Table 1, and perform time-frequency spectrum analysis using matrix pencil method and Fourier transform, respectively.
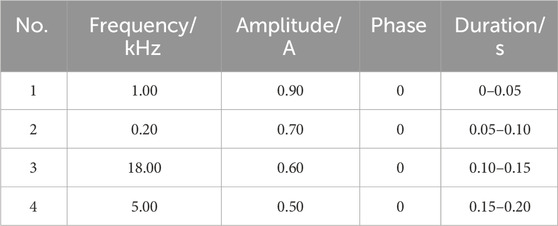
TABLE 1. Test signal parameters.
The signal sampling rate is set to 48 kHz, and the waveform of the test signal is shown in Figure 3.
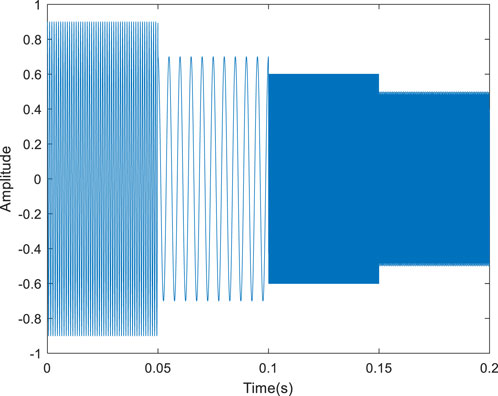
FIGURE 3. Test signal.
Set the time window to 0.01 s, and the moving step of the time window is 0.01 s. The time-frequency spectrum of the test signal was calculated using matrix pencil method and Fourier transform, respectively, as shown in Figure 4.
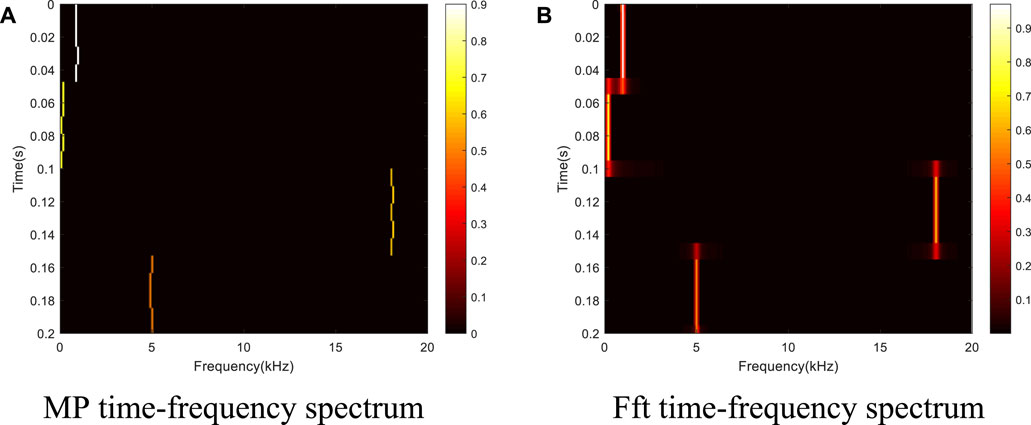
FIGURE 4. Test signal spectrum: (A) MP time-frequency spectrum, (B) Fft time-frequency spectrum.
It can be seen that the frequency resolution of the Fourier method is relatively low. When the signal frequency changes, there are significant unclear areas in the time-frequency spectrum. The matrix pencil method can more accurately extract the frequency characteristics of signals, especially to accurately identify changes in signal frequency. To further verify the noise immunity of the matrix pencil method, Gaussian colored noise is added to the original signal, and the signal-to-noise ratio is set to 10. The test signal containing noise is shown in Figure 5.
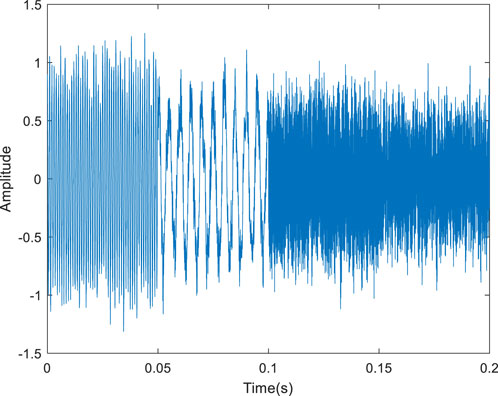
FIGURE 5. Test signal containing noise (SNR = 10).
The time window and step size remain unchanged, and the matrix pencil method and Fourier transform are used to calculate the time-frequency spectrum of the test signal, as shown in Figure 6.

FIGURE 6. Time-frequency spectrum of test signal containing noise: (A) MP time-frequency spectrum, (B) Fft time-frequency spectrum.
When noise exists, significant noise appears in the time-frequency spectrum obtained by the Fourier method. In contrast, the time-frequency spectrum background obtained by matrix pencil method is pure. Therefore, the matrix pencil method has higher resolution and stronger anti-interference ability compared to the Fourier method in the time-frequency spectrum analysis of acoustic signals.
3.2 Dataset and evaluation indicators
3.2.1 Sample information
2236 audio signals of various types were collected at substations of different voltage levels. The sampling rate is 48 kHz. Each audio segment has a collection time of 5 s. The dataset used in this article includes 11 types of acoustic signals, including normal operation of transformers with 5 voltage levels, bird singing, rain, OLTC switching, short circuit impulse, partial discharge, DC bias, etc. Encode it and use the SMOTE method for sample expansion. With the goal of balancing the number of expanded samples, expand the original sample size to an integer multiple. After sample expansion, 4,524 samples were obtained. The sample information is shown in Table 2.
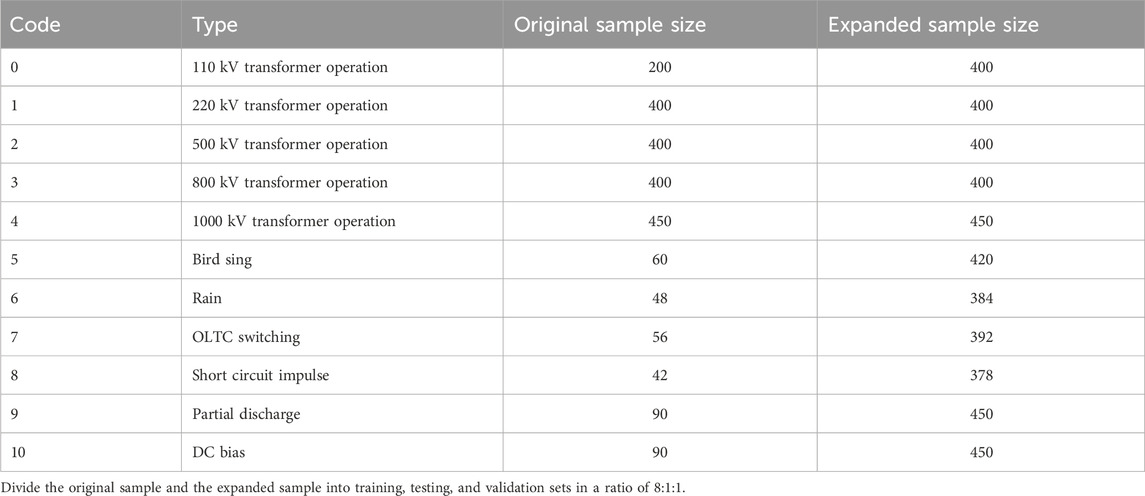
TABLE 2. Sample information.
3.2.2 Acoustic signal preprocessing
Due to the different durations of characteristic signals in various states, it is necessary to intercept audio signals. After analysis, 2 s was selected as the duration for signal analysis. Intercept typical data with a duration of 2 s from the audio and convert the acoustic signal into a time-frequency spectrum using the method described in Chapter 2.1. The sampling rate of the sample data is 48 kHz. The width of the sliding window is 0.01 s, and the step length of the time window movement is 0.01 s. The frequency range of the time-frequency spectrum is 0–20 kHz, and the frequency resolution is set to 0.1 kHz. Convert the amplitude to a decibel value according to Eq. 20.
Where s represents amplitude. The typical acoustic signal time-frequency spectrum of transformer operation is shown in Figure 7.
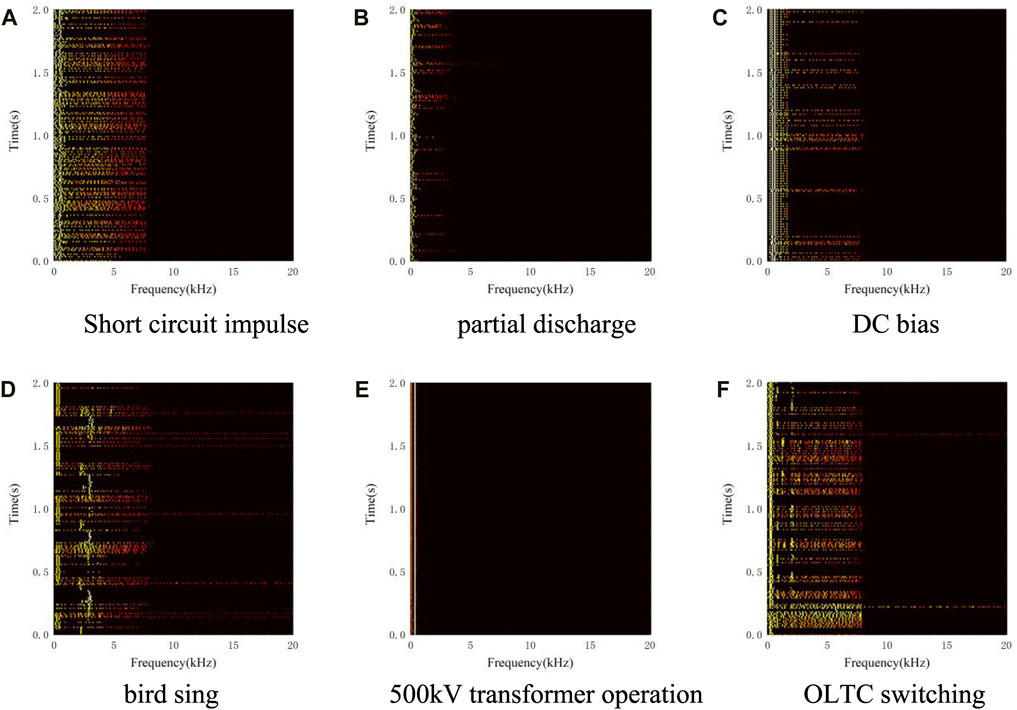
FIGURE 7. Typical acoustic signal time-frequency spectrum of transformer: (A) Short circuit impulse, (B) partial discharge, (C) DC bias, (D) bird sing, (E) 500 kV transformer operation, (F) OLTC switching.
Subsequently, the time-frequency spectrum of the acoustic signal will be used as input data for classification processing using the deep neural network model.
3.2.3 Evaluation indicators
Evaluate the recognition rate of the model using accuracy, recall, F1 score, and overall accuracy. The accuracy calculation formula is shown in Eq. 21.
Among them, xpt is the number of samples predicted to be x and actually x. Xp is the number of samples predicted to be x. The recall rate is calculated according to the formula Eq. 22.
Xt is the actual number of samples that are x. The F1 score is calculated by Eq. 23.
The overall accuracy is defined as the proportion of the total number of correctly predicted samples to the total number of samples.
3.3 Comparison of classification effects
To verify the effectiveness of the SMOTE sample expansion method, the ACmix model was used to train and test the original and expanded samples, respectively. Epoch number was set to 300, and learning rate was set to 0.01. When using the original samples, the accuracy and loss changes during the training process of ACmix model are shown in Figure 8.
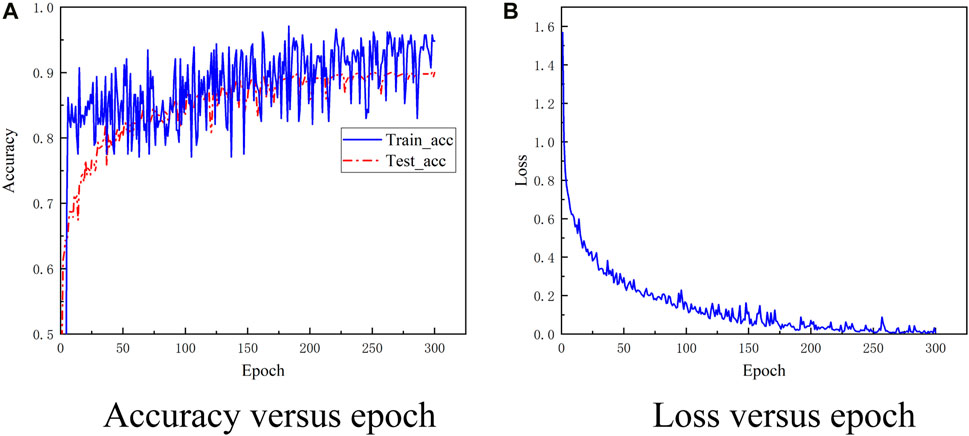
FIGURE 8. Accuracy and loss changing with epoch: (A) Accuracy versus epoch, (B) Loss versus epoch.
The loss converges at 200th epoch. Therefore, in the subsequent training, the epoch number was set to 200. The confusion matrix of the validation set under two sample sets is shown in Figure 9.
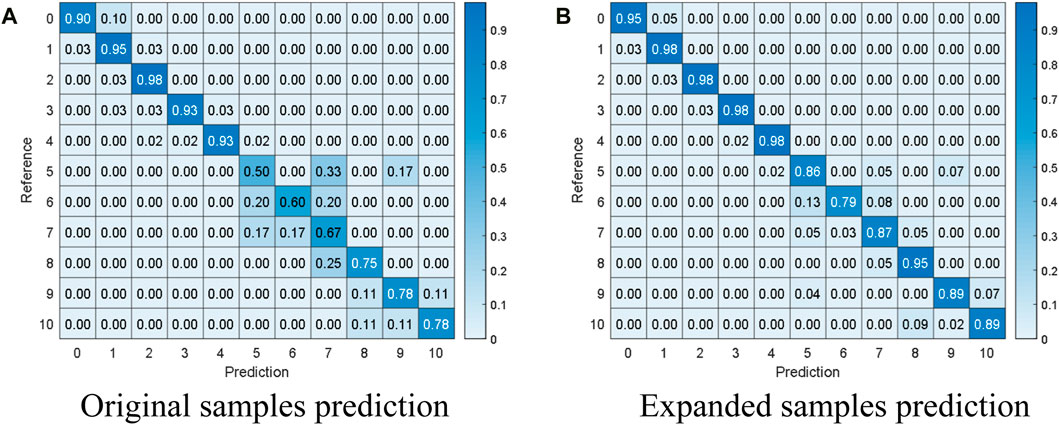
FIGURE 9. Confusion matrix: (A) Original samples prediction, (B) Expanded samples prediction.
After expanding the sample, the recognition accuracy of the sample was significantly improved. Especially, the accuracy of minority class such as 6, 7, 8, and 9 have been significantly improved. Therefore, the SMOTE algorithm can effectively improve the classification performance of transformer samples.
Compare the ResNet50 model with ACmix and compare the performance of the model with the addition of the SMOTE algorithm. The classification results for the four scenarios are shown in Table 3.
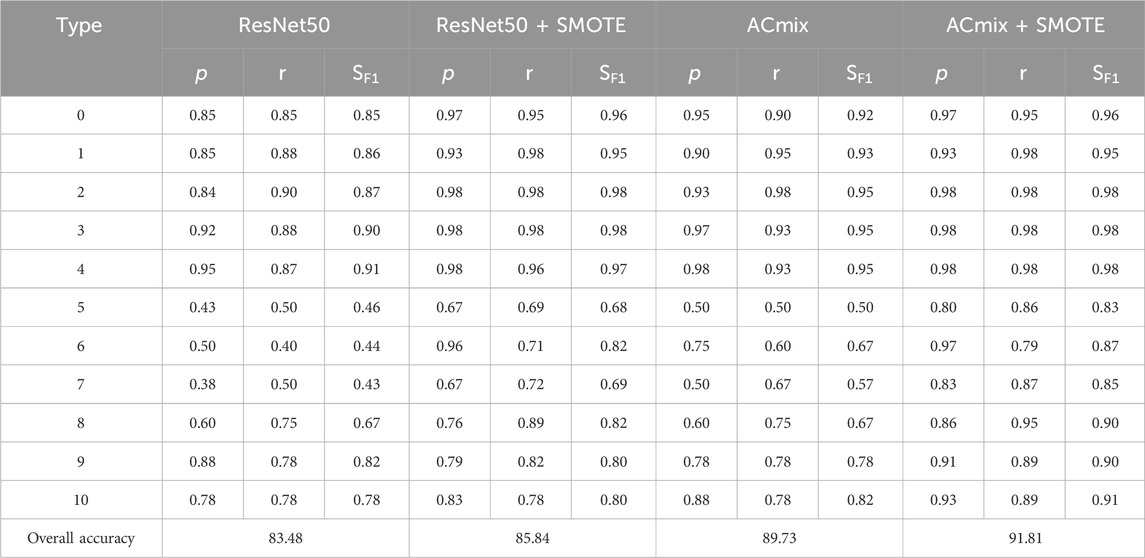
TABLE 3. Classification results in different scenarios.
For the ResNet50 model, the original accuracy was 83.48%, and after SMOTE sample expansion, the accuracy improved by 2.36%. The F1 scores of each category have significantly improved, especially for samples in categories 6, 7, and 8, with an increase of over 20%. For the ACmix model, the original accuracy was 89.73%, and after SMOTE sample expansion, the accuracy was improved by 2.08%. In categories 6, 7, 8, and 9, the F1 score has increased by 20%. Due to the uneven distribution of the original samples, there is not much difference in overall accuracy before and after using the SMOTE algorithm to expand the samples. However, after using the SMOTE algorithm, the accuracy of the minority categories is significantly improved. The ACmix model has higher recognition accuracy for transformer operation acoustic signals compared to the ResNet50 model.
4 Conclusion
This article proposes a method for analyzing transformer acoustic signals. Firstly, the matrix pencil algorithm is introduced for time-frequency spectrum analysis of acoustic signals. The experimental results show that the matrix pencil algorithm has a significant advantage in time-frequency resolution and has good noise resistance performance. Secondly, to address the issue of imbalanced sample distribution, the SMOTE algorithm is used to expand the minority sample categories. Finally, an ACmix model was constructed to classify the operation and environmental sound of 11 types of transformers. The results show that SMOTE sample expansion can significantly improve the recognition accuracy of minority sample categories, and the ACmix model has good recognition performance. Research content of this article will provide technical support for intelligent analysis of transformer sound signals.
Data availability statement
The raw data supporting the conclusion of this article will be made available by the authors, without undue reservation.
Author contributions
QZ: Methodology, Writing–original draft. GP: Data curation, Writing–review and editing. YT: Supervision, Writing–review and editing. ZZ: Validation, Writing–review and editing. XB: Supervision, Writing–review and editing.
Funding
The author(s) declare financial support was received for the research, authorship, and/or publication of this article. The work is funded by the science and technology project of SGCC (State Grid Corporation of China): Intelligent Management and Control of Power Material Inspection, Storage, Distribution Based on Multi-Perception and Edge-computing (5700-202255448A-2-0-ZN).
Conflict of interest
The authors declare that the research was conducted in the absence of any commercial or financial relationships that could be construed as a potential conflict of interest.
Publisher’s note
All claims expressed in this article are solely those of the authors and do not necessarily represent those of their affiliated organizations, or those of the publisher, the editors and the reviewers. Any product that may be evaluated in this article, or claim that may be made by its manufacturer, is not guaranteed or endorsed by the publisher.
References
Bao, Y., and Yang, S. (2023). Two novel SMOTE methods for solving imbalanced classification problems. IEEE Access 11, 5816–5823. doi:10.1109/ACCESS.2023.3236794
Caldeira, A., and Coelho, R. (2023). EEMD-IF based method for underwater noisy acoustic signals enhancement in time-domain. IEEE Signal Process. Lett. 30, 294–298. doi:10.1109/LSP.2023.3258219
Cole, P. T. (1997). “Location of partial discharges and diagnostics of power transformers using acoustic methods,” in IEE Colloquium on Condition Monitoring of Large Machines and Power Transformers (Digest No: 1997/086), London, UK, 19-19 June 1997, 8/1–8/3. doi:10.1049/ic:19970501
Geng, Q. S., Wang, F. H., and Zhou, D. X. (2019). “Mechanical Fault diagnosis of power transformer by GFCC time-frequency map of acoustic signal and convolutional neural network,” in 2019 IEEE Sustainable Power and Energy Conference (iSPEC), Beijing, China, 21-23 Nov. 2019, 2106–2110. doi:10.1109/iSPEC48194.2019.8975318
Hsu, C. H., Lee, S. L., Lin, C. C., Liu, C. S., Chang, S. Y., Hsieh, M. F., et al. (2015). Reduction of vibration and sound-level for a single-phase power transformer with large capacity," in IEEE Trans. Magnetics 51, 8403204. doi:10.1109/TMAG.2015.2453635
Huang, H., Ding, S., Zhao, L., Chen, L., and Gao, H. (2020). Real-time fault detection for IIoT facilities using GBRBM-based DNN. IEEE Internet Things J. 7 (7), 5713–5722. doi:10.1109/JIOT.2019.2948396
Huang, H., Xue, S., Zhao, L., Wang, W., and Wu, H. (2023). Privacy-preserving Smart energy management by consumer-electronic chips and federated learning. IEEE Trans. Consumer Electron., 1. doi:10.1109/TCE.2023.3343821
Kollias, D., and Zafeiriou, S. (2021). Exploiting multi-CNN features in CNN-rnn based dimensional emotion recognition on the OMG in-the-Wild dataset. IEEE Trans. Affect. Comput. 12 (3), 595–606. doi:10.1109/TAFFC.2020.3014171
Kucera, M., Gutten, M., Karman, M., and Korenciak, D. (2022). Analysis of the condition of dry transformers by acoustic emission measurement. Krakow, Poland: 2022 ELEKTRO, 1–4. doi:10.1109/ELEKTRO53996.2022.9803687
Lee, T., Shi, L., Nielsen, J. K., and Christensen, M. G. (2021). Fast generation of sound zones using variable span trade-off filters in the DFT-domain. IEEE/ACM Trans. Audio, Speech, Lang. Process. 29, 363–378. doi:10.1109/TASLP.2020.3042701
Liang, G., Li, S., Liu, R., Cao, J., Hao, Y., and Chen, W. (2017). “A probabilistic maintenance scheme evaluation method for transformer based on failure rate,” in 2017 4th International Conference on Information Science and Control Engineering (ICISCE), Changsha, China, July 21 2017 to July 23 2017, 90–93. doi:10.1109/ICISCE.2017.29
Lu, L., Yi, Y., Huang, F., Wang, K., and Wang, Q. (2019). Integrating local CNN and global CNN for script identification in natural scene images. IEEE Access 7, 52669–52679. doi:10.1109/ACCESS.2019.2911964
Okabe, G. U., and Wada, H. (2011). Partial discharge signal propagation characteristics inside the winding of oil-immersed power transformer - using the three-winding transformer model in air. IEEE Trans. Dielectr. Electr. Insulation 18 (6), 2024–2031. doi:10.1109/TDEI.2011.6118640
Sithole, E., Akumu, A. O., and Irungu, G. K. (2019). “Effects of insulation barrier board on power transformer PD detection using acoustics,” in 2019 Southern African Universities Power Engineering Conference/Robotics and Mechatronics/Pattern Recognition Association of South Africa (SAUPEC/RobMech/PRASA), Bloemfontein, South Africa, 28-30 January 2019, 431–436. doi:10.1109/RoboMech.2019.8704792
Wang, J., Ji, F., and Chen, F. (2017). “Matrix pencil based toeplitz covariance matrix reconstruction approach for correlated weak source detection,” in 2017 IEEE International Conference on Signal Processing, Communications and Computing (ICSPCC), Xiamen, China, 22-25 October 2017, 1–5. doi:10.1109/ICSPCC.2017.8242568
Wang, X., Wang, X., and Liu, Y. (2011). “Application of multiple models BP NN weighting optimal controller in medium plate cooling process,” in Proceedings of the 30th Chinese Control Conference, Yantai, China, July 22-24, 2011, 1944–1949.
Wang, Y., Jin, H., Cai, X., Gong, P., and Jiang, X. (2021). Study on the sound radiation efficiency of a typical distribution transformer. IEEE Access 9, 125151–125157. doi:10.1109/access.2021.3107455
Wardani, N. U. A., Purnomoadi, A. P., Septiani, H. I., Arifianto, I., and Cahyono, B. (2011). “Condition assessment of 500/150 kV power transformer based on condition based maintenance,” in Proceedings of the 2011 International Conference on Electrical Engineering and Informatics, Bandung, Indonesia, 17-19 July 2011, 1–4. doi:10.1109/ICEEI.2011.6021600
Wu, X., Zuo, W., Lin, L., Jia, W., and Zhang, D. (2018). F-SVM: combination of feature transformation and SVM learning via convex relaxation. IEEE Trans. Neural Netw. Learn. Syst. 29 (11), 5185–5199. doi:10.1109/TNNLS.2018.2791507
Zhang, X., Durand, L., Senhadji, L., Lee, H. C., and Coatrieux, J. L. (1998). Time-frequency scaling transformation of the phonocardiogram based of the matching pursuit method. IEEE Trans. Biomed. Eng. 45 (8), 972–979. doi:10.1109/10.704866
Keywords: matrix pencil, transformer acoustic signal, deep neural network, sample expansion, attention mechanism
Citation: Zhang Q, Peng G, Tan Y, Zhang Z and Bai X (2024) A transformer acoustic signal analysis method based on matrix pencil and hybrid deep neural network. Front. Energy Res. 12:1343748. doi: 10.3389/fenrg.2024.1343748
Received: 24 November 2023; Accepted: 06 February 2024;
Published: 21 February 2024.
Edited by:
Fuqi Ma, Xi’an University of Technology, ChinaReviewed by:
Jasronita Jasni, Putra Malaysia University, MalaysiaHuakun Huang, Guangzhou University, China
Copyright © 2024 Zhang, Peng, Tan, Zhang and Bai. This is an open-access article distributed under the terms of the Creative Commons Attribution License (CC BY). The use, distribution or reproduction in other forums is permitted, provided the original author(s) and the copyright owner(s) are credited and that the original publication in this journal is cited, in accordance with accepted academic practice. No use, distribution or reproduction is permitted which does not comply with these terms.
*Correspondence: Xiaojing Bai, YmFpeGlhb2ppbmdAbmNlcHUuZWR1LmNu