 Juhua Hong
 Linyao Zhang
94% of researchers rate our articles as excellent or good
Learn more about the work of our research integrity team to safeguard the quality of each article we publish.
Find out more
METHODS article
Front. Energy Res., 22 February 2024
Sec. Smart Grids
Volume 12 - 2024 | https://doi.org/10.3389/fenrg.2024.1343309
This article is part of the Research TopicPlanning, Operation and Control of Modern Power System with Large-scale Renewable Energy Generations, volume IIView all 15 articles
Against the backdrop of carbon peaking and carbon neutrality initiatives, industrial parks have the potential to mitigate external electricity procurement and reduce carbon emissions by incorporating photovoltaic and energy storage systems. However, the inherent unpredictability in photovoltaic power generation poses notable challenges to the optimal planning of industrial parks. In light of this, the present study proposes a robust planning model for the distribution of photovoltaic and energy storage systems within industrial estates, taking into account uncertainties in photovoltaic output and low-carbon demand response. The primary objective of the model is to minimize the yearly comprehensive cost of the industrial park. It is grounded in the carbon emission flow theory, utilizing dynamic carbon emission factors calculated throughout the year as the pricing basis for real-time electricity rates informed by demand response. Subsequently, historical photovoltaic output data are employed to formulate typical output scenarios and their probability distributions through scenario clustering. These norms and constraints serve to bind the associated uncertainty probabilities. Consequently, a two-stage distribution robust model for the photovoltaic and energy storage system is established, employing a data-driven methodology. The efficacy of the proposed model is substantiated through a case simulation of an industrial park utilizing the CPLEX commercial solver. This approach not only underscores the importance of addressing uncertainties in photovoltaic power generation for industrial park planning but also showcases a practical application of the developed model.
The total carbon emissions from the electricity industry account for more than 40% of the total carbon emissions in society, making it a pioneer in achieving China’s dual-carbon goals. As electricity-intensive areas, industrial estates need to urgently consider how to reduce their carbon emissions (Han et al., 2021).
On one hand, the establishment of a solar-storage power generation system within an industrial park, coupled with the integration of green electricity, presents an opportunity to mitigate carbon emissions attributable to the consumption of externally procured electrical power. However, the uncertainty of photovoltaic output will have a significant impact on the capacity system of the solar-storage power generation system within the park (Zhi et al., 2017). On the other hand, based on the traditional price–demand response, superimposing electricity prices during peak and off-peak periods and using the TV-viewing angle to determine real-time electricity prices, it is believed that less electricity consumption in the park means eco-friendly environmental protection. However, in reality, because the combination of generating units at each moment is different, the carbon emissions caused by each unit of electricity produced at each moment are different. The carbon emission profile of the power-generating unit is decoupled from the load curve. Consequently, there is a need to institute an eco-friendly demand response framework rooted in a user-centric carbon perspective. This approach is essential for effectively addressing the dual-carbon targets. Therefore, it is of great significance to integrate the system and configuration of solar storage in industrial estates, taking into account the unpredictability associated with photovoltaic systems and the demand response characterized by low carbon emissions.
Currently, the research on photovoltaic uncertainty mainly focuses on three methods: stochastic optimization (Zhu et al., 2021; Li et al, 2022a), robust optimization (Gao et al., 2017; Qiu et al., 2020; Fan et al., 2018), and distributed robust optimization (Chen et al., 2021; He et al., 2019; Ruan et al., 2019; He et al., 2020). Li et al. (2020) used stochastic optimization to optimize the energy storage configuration requirements for various random scenarios, and based on the probability distribution of each typical scenario, the optimal configuration of grid-side energy storage was achieved. Stochastic optimization algorithms mainly use probability to describe the characteristics of uncertain parameters and generate a large amount of discrete data. However, in practical situations, it is not easy to obtain accurate probability distributions. Xue et al. (2022) used robust optimization to constrain the disturbance of photovoltaic output uncertainty using a box uncertainty set and optimize the capacity configuration of solar storage in the park. Robust optimization algorithms are complicated to determine the description of uncertain constraint sets and mainly rely on boundary parameters to express, often leading to either too conservative or aggressive decisions. Yue et al. (2018) used a two-stage distributed robust algorithm to construct an optimization scheduling model driven by data. The worst-case optimal solution was considered, and a column-and-constraint generation (CCG) algorithm was used to solve the problem, improving the acceptance of clean energy by the energy system. The distributed robust optimization algorithm combines the advantages of stochastic and robust optimization algorithms. It does not require accurate probability distribution and can be driven by historical data to find the worst solutions that meet the confidence interval’s probability distribution. It can effectively solve problems such as power system and scheduling, ensuring the solution’s accuracy and robustness.
Currently, with the proposal of the dual-carbon goal, many scholars are researching how to effectively quantify the carbon emissions of each enterprise in the electricity sector and clarify the carbon emission responsibilities of each link. Zhang et al. (2013) proposed an industrial park carbon emission accounting method that uses the electricity region’s carbon emission factor to calculate enterprises’ carbon emissions based on their location. This method is convenient for statistics and is simple to calculate. However, the regional carbon emission factor is slow to update, and in the face of more and more new energy generators’ access, the accuracy and effectiveness of this regional carbon emission factor are lacking. Zhou et al. (2012) proposed a primary calculation method for the carbon emission flow of the power system based on the connection between carbon emission flow and power flow calculation. Wang et al. (2022) proposed a real-time carbon flow calculation method based on network power decomposition, which overcomes the traditional method’s inability to ensure fair carbon flow distribution and effectively solves the problem of quantifying the decarbonization contribution of new energy. Based on the carbon emission flow theory, the carbon flow can be clarified, and it has a certain timeliness. Combining the theory of carbon emission flow with calculating carbon emission factors can more accurately quantify the carbon emissions of various links in the power system (Li et al., 2022a).
In summary, the aim of this paper is to devise a resilient system and arrangement for solar energy storage in industrial complexes, taking into account uncertainties in photo-voltaic systems and responses to eco-friendly demands. First, to tackle the matter of ambiguous carbon emission responsibilities among electricity users during different time intervals, a time-varying dynamic carbon emission coefficient is established, which is built upon the carbon emission flow theory. This dynamic carbon emission factor is then incorporated into the demand response pricing mechanism to achieve a response that aligns with eco-friendly objectives. Second, an optimization objective is formulated for comprehensive cost minimization, encompassing yearly investment, maintenance, electricity purchase, gas procurement, electricity sales revenue, and carbon emission costs. The model for the industrial park’s solar energy storage system integrates restrictions like budget constraints, grid transmission power constraints, power balance constraints, energy storage limitations, electricity price restrictions, and demand response constraints.
Historical data are used to obtain typical output scenarios and their probability distributions through scenario clustering to deal with the variability in photovoltaic output. The uncertainty probability is constrained by both the 1-norm and the infinity norm, and a two-stage distribution robust system model is constructed, which is tackled using the CCG algorithm to obtain the optimal system solution. Finally, the model’s effectiveness is verified through an industrial park case study.
Traditional demand response mainly starts from the electricity perspective, using the difference between generation and consumption as the pricing rule, mainly solving the reliability problem caused by the system supply–demand balance. However, in the context of dual-carbon targets, it is necessary to start from the carbon perspective, clarify the direction of carbon emissions based on carbon emission flow theory, and obtain the dynamic carbon emission coefficient at different times. By superimposing the dynamic carbon emission coefficient on the electricity price, users can be aware of the corresponding carbon emission level of electricity consumption at each time to reduce carbon emissions on the demand side.
Currently, the calculation of carbon emissions caused by the use of electricity is generally obtained using the average within the regional carbon emission coefficient method. The total carbon emissions the user generates throughout the year can be obtained from Equation 1.
where Ek represents the total carbon emissions of user k for the entire year, Y represents a particular year, Qk,t represents the electricity consumption of user k at time t, and
where
The carbon dioxide emissions from power generation within the geographical coverage of the regional power grid i can be obtained by Equation 3.
where MFall,I represents the total amount of fossil fuels used for power generation within the coverage area of the regional power grid i and δf,i represents the carbon emission coefficient of fossil fuels.
The regional average carbon emission coefficient has the advantage of simple calculation. However, the errors generated by this method are increasingly expanding under the current context of large-scale integration of new energy.
With the construction of a new type of power system, the proportion of clean energy from different units at different times within each region also varies. For users, carbon emissions generated at different times have significant spatiotemporal differences, and the regional average carbon emission factor cannot sufficiently represent these differences.
Currently, the calculation of carbon emissions in the electricity industry is mainly focused on the power generation side. However, in reality, due to the “generation follows load” characteristic of the power system, electricity consumption on the demand side is the leading cause of carbon emissions. Therefore, carbon emissions generated by the power generation side should be jointly borne by both the supply side and the demand side.
The carbon emission flow theory of the power system can label carbon emissions based on power generation unit information, line flow information, and network loss information, which can effectively clarify the sources and destinations of carbon emissions. In addition, since the theory is based on the time and space characteristics of the flow information for carbon emission traceability and accountability, it can effectively clarify the carbon emissions impact caused by user electricity consumption behavior at different times.
Nonetheless, as the carbon potential derived from the theory is contingent on a singular node, there exists a distinct disparity in carbon potential across different nodes. To adhere to the principle of regional equity, it becomes imperative to compute the average carbon potentials within a specific region. Subsequently, dynamic carbon emission factors are calculated over time and region in accordance with Equation 4.
where eCO2,i,t represents the regional dynamic carbon emission coefficient of region i at time t.
Utilizing the dynamic carbon emission coefficient specific to the region, the carbon emissions from an individual user at each point in time throughout the year can be determined through the application of the following formula Eq. 5):
where
This article establishes an objective function with the minimum yearly comprehensive cost of the park, which consists of two parts in total. A part of it is converted into the yearly maintenance and investment costs of the optical storage and power generation equipment. The other part is the yearly cost of purchasing gas, electricity, carbon emissions, and electricity sales revenue, as shown in Equations 6–8.
where F1 and F2 are the yearly investment and maintenance costs, respectively. Fyic and Fyr are the yearly operating cost and yearly investment cost. Fbuyg, Fbuye, Fcin, and Fsellein are the yearly gas procurement, yearly electricity procurement, yearly approved income generated from the reduction of carbon emissions, and yearly electricity sales income, respectively.
where Cess and Cpv are the investment costs per unit capacity of energy storage and per unit capacity of photovoltaic investment, respectively. Epv and Eess are the photovoltaic capacity and energy storage capacity, respectively. Rpv, Ress, Ypv, and Yess are the equivalent yearly investment-related parameters. Ns is a set of all possible scenarios. Ps is the probability that scenario s may occur.
Equations 9 and 10 are the calculation formulas for the investment and operating costs, respectively, which are calculated using the yearly equivalent investment cost calculation method.
Equations 11–13 are the yearly electricity procurement, yearly gas procurement, and yearly electricity sales revenue calculated using the scenario probability, respectively. Equation 14 is the carbon emission cost calculated using the scenario probability, which is the product of the difference between purchasing and selling electricity, the price associated with a unit of carbon emissions, and the carbon potential.
The constraints within the model outlined in this article encompass both conventional and eco-friendly considerations. Conventional constraints involve restrictions on investment costs, grid transmission power, power balance, energy storage charging and discharging power, state constraints for energy storage charging, and park load electricity selling prices. The eco-friendly constraints integrate dynamic carbon emission coefficients, utilize carbon emission costs as pricing benchmarks, and incorporate corresponding constraints on electricity prices.
General constraints:
where
Equation 15 represents the investment cost constraint. Equation 16 represents the transmission power constraint of the power grid frame. Equation 17 represents the real-time electrical power balance constraint. Equation 18 represents the energy storage state constraint. Equation 19 represents the real-time capacity constraint for energy storage. Equation 20 represents the constraints related to gas turbines. Equation 21 represents the constraints related to electricity prices.
Low-carbon constraints:
where
This article constructs a data-driven, two-stage, distributionally robust system model to address the uncertainty of photovoltaic power output. The first stage is the investment and maintenance stage, with variables represented by x, including the system capacity sizes of photovoltaics and energy storage. The second stage is the operation stage, intending to minimize the operating cost, given the first-stage plan. The second-stage variables are represented by ys, including the output of each unit and the charging and discharging status of energy storage in different periods during the simulated operation. The above two-stage distributionally robust system model is expressed in the following matrix form:
where Ωp represents the set satisfied by Ps and ζs represents the unit capacity of photovoltaic output values after scene clustering. In Equation 25, Ax represents the yearly investment and maintenance costs of the photovoltaic-energy storage system F1, and Bys + Cζs represents the yearly operating cost F2 under the sth scenario. Equation 26 represents the investment and operating cost constraints in the first stage, and equations 27 and 28 represent the inequality constraints and equality constraints in the second stage, respectively. Equation 29 represents the inequality constraints between the two-stage variables and the output of photovoltaics and energy storage under discrete scenarios, and Equation 30 represents the equality constraints between the second-stage variables and the demand response.
To ensure that ps satisfies the true probability distribution, the 1-norm and ∞-norm constraints are added, and the discrete ps value under the scenario is subject to the following constraint set:
The variables θ1 and θ∞ in the expression, respectively, correspond to the allowed deviation values of the scene probability under the 1-norm and the infinity-norm constraints.
According to ZHAO and GUAN (2016), under distributionally robust system, the scene probability satisfies the confidence constraints.
If we want to make the right-hand side of Equations 32 and 33 equal to α1 and α∞, respectively, which represent the confidence levels of the probability uncertainty under the 1-norm and infinity-norm constraints, we can follow the following steps:
where the symbol M represents the number of historical data. A transformation is then performed on the absolute value in equations 34 and 35.
Norm constraint:
where m is an auxiliary variable.
Infinity-norm constraint:
The computational model is resolved utilizing the YALMIP toolbox in MATLAB, along with the commercial solver CPLEX. The CCG algorithm is employed for iterative and staged problem-solving. The industrial park in a southwestern city of China, which includes gas turbine units, is selected as the case study. The relevant parameters of the units are shown in Table 1. The cost of natural gas procured by the park is 0.349 CNY per kilowatt-hour (kWh). Figure 1 illustrates the load curve of the industrial park. In addition, a normal distribution is used to produce errors in the photovoltaic baseline output scenario, with the baseline value as the mean and 0.25 times the baseline value as the variance. Then, 5,000 (K) error scenario data are generated and clustered into five typical scenarios, as shown in Figure 2. The purchasing prices of electricity for the park are shown in Table 2. The grid-connected electricity price for photovoltaics is 0.35 (in CNY/kW·h), and the parameters of the photovoltaic equipment are shown in Table 3. The parameters of the energy storage equipment are shown in Table 4. The dynamic carbon emission factor is calculated according to the method in Li et al. (2022b), and the result is shown in Figure 3. The price elasticity coefficient is selected from DOOSTIZADEH and GHASEMI (2012).

TABLE 1. Gas turbine parameters.
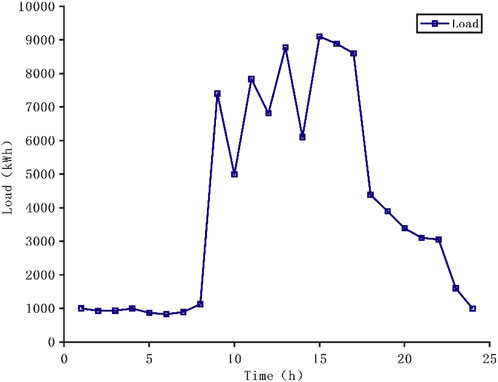
FIGURE 1. Standard daily industrial park electricity demand.
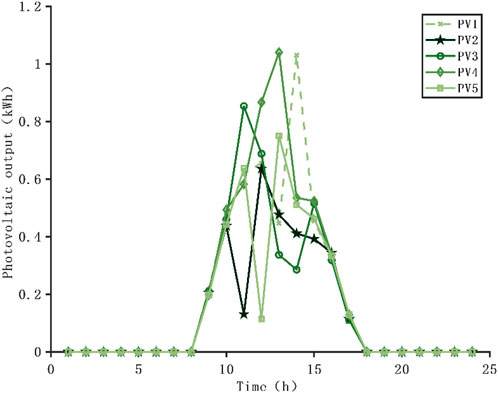
FIGURE 2. Representative photovoltaic scenario post-clustering.
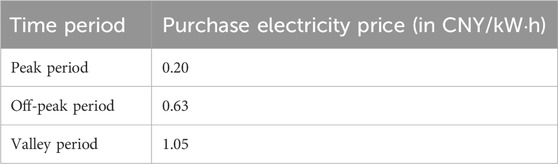
TABLE 2. Electricity purchase price of the park.
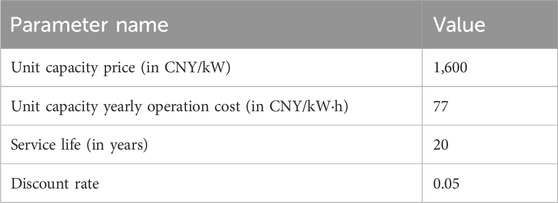
TABLE 3. Photovoltaic equipment parameters.
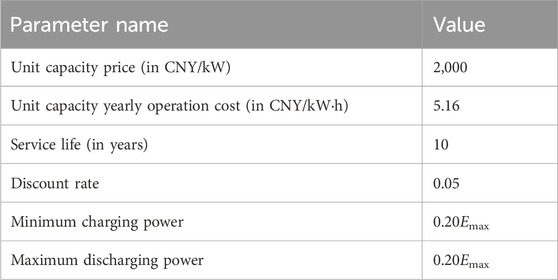
TABLE 4. Parameters related to energy storage.
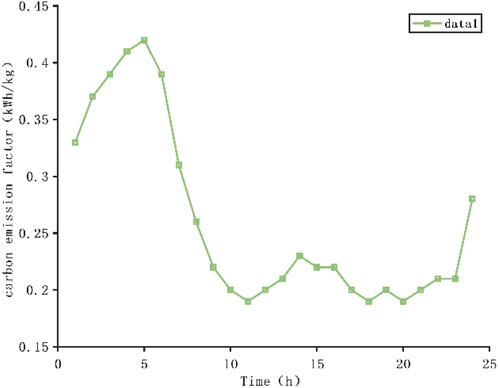
FIGURE 3. Graph depicting the dynamic carbon emission factor over time.
To verify the rationality of the proposed model, this paper conducted a comparative analysis of the following four scenarios:
Scenario 1. A solar-storage power generation system is planned for the park using the random system to consider the photovoltaic uncertainty without considering the eco-friendly demand response.
Scenario 2. A solar-storage power generation system is planned for the park using the distributionally robust system to consider the photovoltaic uncertainty without considering the eco-friendly demand response.
Scenario 3. A solar-storage power generation system is installed in the park using the random system to consider the photovoltaic uncertainty and considering the eco-friendly demand response.
Scenario 4. A solar-storage power generation system is installed in the park using the distributionally robust system to consider the photovoltaic uncertainty and eco-friendly demand response.
The four scenarios were tackled using CPLEX, and the distributionally robust algorithm used the CCG algorithm described in Section 4 for solving. The constraints related to the robustness degree were both set to 0.99. The probability of each scenario in the random system was set to 0.2.
Table 5 outlines the investment scheme, yearly overall operating expenses, yearly investment outlay, yearly maintenance expenditure, yearly electricity procurement costs, yearly gas acquisition costs, yearly revenue from electricity sales, and yearly carbon emission expenses for each scenario.
Figure 4 shows that in scenarios 1 and 2, without considering the demand response, the distributionally robust algorithm purchased less electricity than the random system in each time period. This is because the distributionally robust algorithm has more robustness and plans more photovoltaic capacity to avoid the impact of the photovoltaic output uncertainty on park operation.
Figure 5 shows that in scenarios 3 and 4, when considering the eco-friendly demand response, the distributionally robust algorithm purchased more electricity than the random system during the high peak period of dynamic carbon emission factors. However, the purchased electricity in other periods was still less than that of the random system. Although the purchased electricity was more significant under high carbon emission factors, the total purchased electricity was still less than the result of the random system. This considers the impact of purchased electricity under high carbon emission factors on park operating costs.In general, it can be observed that the distributionally robust algorithm incurs higher yearly operating costs than the stochastic programming algorithm compared to scenarios 1 and 2 and scenarios 3 and 4. Although its economic efficiency may not be optimal, the lower ratio of energy storage to photovoltaic capacity, compared to stochastic programming, proves more effective in mitigating the influence of photovoltaic uncertainties on park operations. This, in turn, reduces the expenditure on grid electricity purchases and enhances the park’s yearly carbon emission reduction with increased robustness.
Based on Figure 6 and Figure 7, considering the eco-friendly demand response, the purchased electricity in scenarios 3 and 4 is higher than that in scenarios 1 and 2 during periods of high-carbon emission factors. However, during periods of low-carbon emission factors, the purchased electricity in scenarios 3 and 4 is lower than that in scenarios 1 and 2. Although the total purchased electricity in scenarios 3 and 4 has increased, the total carbon emissions are lower than those in scenarios 1 and 2. This is because the demand response based on dynamic carbon emission factors reduces the purchased electricity during periods of high carbon emissions.
In general, upon comparing scenarios 1 and 3 and scenarios 2 and 4, it is evident that the utilization of demand response based on the dynamic carbon emission factor pricing rules results in a reduction in the industrial park’s yearly carbon emissions compared to traditional time-of-use electricity pricing. This reduction is observed despite an increase in the park’s expenditure on purchased electricity. The disparity in peak values between dynamic carbon emission factors and electricity demand, as illustrated in Figure 3, contributes to the overall decrease in total yearly carbon emissions with the heightened electricity cost. This signifies commendable eco-friendly performance.
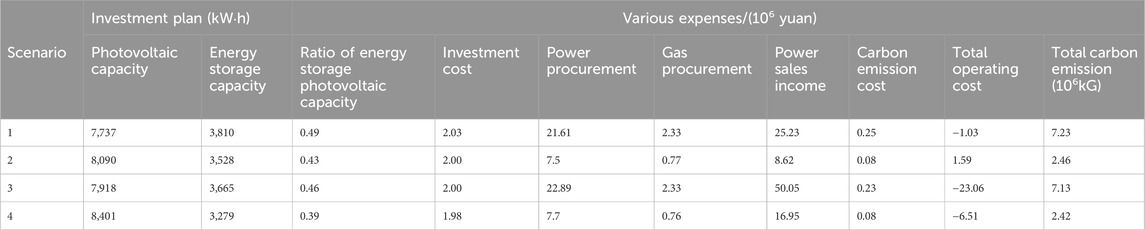
TABLE 5. Simulation results of each scenario.
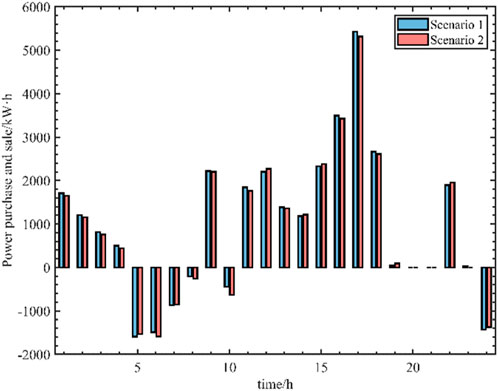
FIGURE 4. Electricity purchase and sale in the park in scenarios 1 and 2.
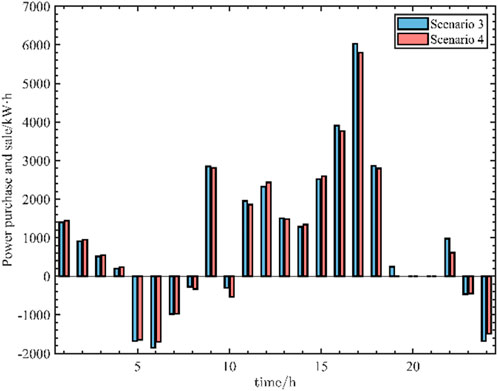
FIGURE 5. Purchase and sale of electricity in the park in scenarios 3 and 4.
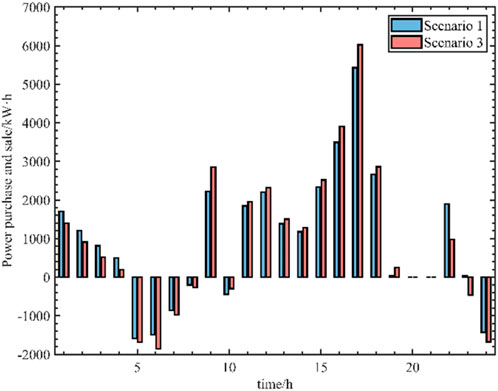
FIGURE 6. Purchase and sale of electricity in the park in scenarios 1 and 3.
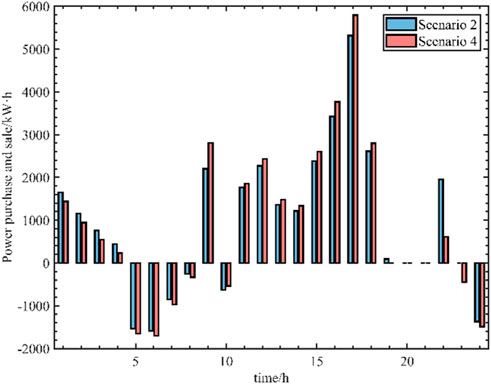
FIGURE 7. Electricity purchase and sale in the park in scenarios 1 and 3.
This paper aims to propose a resilient configuration for solar storage systems in industrial estates, taking into consideration uncertainties in photovoltaic generation and incorporating an eco-friendly demand response. It employs a distributed robust algorithm to alleviate the impact of photovoltaic uncertainties on the system through a data-driven approach. Furthermore, it introduces an eco-friendly demand response model based on the carbon emission flow theory, considering dynamic carbon emission factors. The approach is validated through illustrative examples, leading to the following conclusions:
1) The system results under the distributed robust algorithm, compared with the results of the random programming algorithm, show that it can reduce the impact of the photovoltaic uncertainty on the operation of the park, reduce the cost of purchasing electricity from the grid, and thus reduce the yearly carbon emissions of the park. It has better robustness while ensuring a particular economy.
2) Following the implementation of the eco-friendly demand response model grounded in the dynamic carbon emission factor, a comparison with the traditional time-of-use program reveals that the demand response advocated in this paper demonstrates a more pronounced carbon-centric bias. It achieves a reduction in electricity procurement during periods characterized by high carbon emission factors, consequently effectively diminishing the overall yearly carbon emissions of the industrial park.
The raw data supporting the conclusion of this article will be made available by the authors, without undue reservation.
JH: methodology, resources, writing–original draft, and writing–review and editing. LZ: validation and writing–review and editing. ZH: supervision and writing–review and editing. WL: formal analysis and writing–review and editing. YZ: data curation and writing–review and editing.
The author(s) declare that no financial support was received for the research, authorship, and/or publication of this article.
Authors JH, LZ, ZH, WL, and YZ were employed by State Grid Fujian Electric Power Co Ltd.
All claims expressed in this article are solely those of the authors and do not necessarily represent those of their affiliated organizations, or those of the publisher, the editors, and the reviewers. Any product that may be evaluated in this article, or claim that may be made by its manufacturer, is not guaranteed or endorsed by the publisher.
Chen, Z., Zhang, X., Wang, X., Peng, L., Wen, W., Liang, W., et al. (2021). Distributed robust optimal configuration method for distributed photovoltaic power stations connected to distribution network. Power Syst. Prot. Control 49 (13), 30–42. doi:10.19783/j.cnki.pspc.201082
Doostizadeh, M., and Ghasemi, H. (2012). A day-ahead electricity pricing model based on smart metering and demand-side management. Energy 46 (1), 221–230. doi:10.1016/j.energy.2012.08.029
Fan, L., Wang, K., Li, G., Wu, W., and Ge, W. (2018). Robust unit combination considering the time dependence of wind power. Automation Electr. Power Syst. 42 (18), 91–97+176. doi:10.7500/AEPS20170917007
Gao, H., Liu, J., Zhenbo, W., and Su, Y. (2017). A hierarchical robust programming model for active distribution network and its solution method. Chin. J. Electr. Eng. 37 (05), 1389–1401. doi:10.13334/j.0258-8013.pcsee.152656
Han, X., Li, T., Zhang, D., and Zhou, X. (2021). New problems and key technologies of new power system planning under the dual carbon goal. High. Volt. Technol. 47 (09), 3036–3046. doi:10.13336/j.1003-6520.hve.20210809
He, S., Gao, H., Liu, J., Liu, Y., Wang, J., and Xiang, Y. (2019). Distributed robust DG optimal configuration considering demand response flexible adjustment. Chin. J. Electr. Eng. 39 (08), 2253–2264+8. doi:10.13334/j.0258-8013.pcsee.181968
He, S., Ruan, H., Gao, H., and Liu, J. (2020). A review of theoretical analysis and application of distributed robust optimization methods in power systems. Automation Electr. Power Syst. 44 (14), 179–191. doi:10.7500/AEPS20191022002
Li, W., Zang, C., Ding, L., and Zeng, P. (2022a). Scheduling of combined electric and heating systems based on multi-objective two-stage stochastic programming method. Inf. Control 51 (02), 176–187. doi:10.13976/j.cnki.xk.2022.1057
Li, Y., Zhang, N., Du, E., Liu, Y., Xiao, C., and He, D. (2022b). Research and benefit analysis of low-carbon demand response mechanism in power system based on carbon emission flow. Chin. J. Electr. Eng. 42 (08), 2830–2842. doi:10.13334/j.0258-8013.pcsee.220308
Li, Z., Yang, H., and Shi, T. (2020). Research on grid-side energy storage configuration method based on stochastic programming theory. Power Electron. Technol. 54 (03), 40–43.
Qiu, X., Zhu, Z., Huang, C., Huang, B., Wu, H., and Zhong, S. (2020). Robust optimization of integrated energy system considering wind power output uncertainty. Smart Power 48 (05), 1–6+59.
Ruan, H., Gao, H., Liu, J., and Huang, Z. (2019). A robust reactive power optimization model for active distribution network distribution considering DG reactive power support and switch reconfiguration. Chin. J. Electr. Eng. 39 (03), 685–695+948. doi:10.13334/j.0258-8013.pcsee.180241
Wang, C., Yi, C., Wen, F., Yuan, T., Chi, C., and Jiang, X. (2022). Improvement and perfection of carbon emission flow theory in power system. Power Grid Technol. 46 (05), 1683–1693. doi:10.13335/j.1000-3673.pst.2021.2071
Xue, G., Shan, B., Wang, Ti, Wang, X., Xing, W., and Sun, W. (2022). Robust optimal configuration of light-storage storage in industrial parks considering photovoltaic uncertainty. J. Syst. Simul. 1-10. doi:10.16182/j.issn1004731x.joss.21-0601
Yue, S., Liu, J., Gao, H., Gao, Q., Xu, W., and Gou, J. (2018). Two-stage distributed robust coordinated scheduling of electrical energy systems considering wind power uncertainty. Automation Electr. Power Syst. 42 (13), 43–50+75. doi:10.7500/AEPS20171218008
Zhang, Y., Wang, X., Yu, F., and Cui, Z. (2013). Carbon emission accounting methods and empirical research in industrial parks. Ecol. Econ. (09), 155–157.
Zhao, C., and Guan, Y. (2016). Data-driven stochastic unit commitment for integrating wind generation. IEEE Trans. Power Syst. 31 (4), 2587–2596. doi:10.1109/tpwrs.2015.2477311
Zhi, Y., Guo, S., He, X., and Xin, Ai (2017). Two-tier optimal scheduling model for smart industrial parks. Automation Electr. Power Syst. 41 (01), 31–38+101. doi:10.7500/AEPS20160103004
Zhou, T., Kang, C., Xu, Q., and Chen, Q. (2012). A preliminary study on the calculation method of carbon emission flow in power system. Automation Electr. Power Syst. 36 (11), 44–49. doi:10.3969/j.issn.1000-1026.2012.11.008
Keywords: photovoltaic uncertainty, low-carbon demand response, two-stage distribution robust, industrial park planning, CPLEX photovoltaic uncertainty, CPLEX
Citation: Hong J, Zhang L, Hu Z, Lin W and Zou Y (2024) A robust system model for the photovoltaic in industrial parks considering photovoltaic uncertainties and low-carbon demand response. Front. Energy Res. 12:1343309. doi: 10.3389/fenrg.2024.1343309
Received: 23 November 2023; Accepted: 05 February 2024;
Published: 22 February 2024.
Edited by:
Yaser Qudaih, Higher Colleges of Technology, United Arab EmiratesReviewed by:
Maneesh Kumar, Indian Institute of Technology Roorkee, IndiaCopyright © 2024 Hong, Zhang, Hu, Lin and Zou. This is an open-access article distributed under the terms of the Creative Commons Attribution License (CC BY). The use, distribution or reproduction in other forums is permitted, provided the original author(s) and the copyright owner(s) are credited and that the original publication in this journal is cited, in accordance with accepted academic practice. No use, distribution or reproduction is permitted which does not comply with these terms.
*Correspondence: Juhua Hong, NzQyNDc1NjAzQHFxLmNvbQ==
Disclaimer: All claims expressed in this article are solely those of the authors and do not necessarily represent those of their affiliated organizations, or those of the publisher, the editors and the reviewers. Any product that may be evaluated in this article or claim that may be made by its manufacturer is not guaranteed or endorsed by the publisher.
Research integrity at Frontiers
Learn more about the work of our research integrity team to safeguard the quality of each article we publish.