 Hongying Zhu
 Chuankai Jing
 Fenna Zhang
 Yaoguang Qi1
 Tiantian Yi
- 1College of Mechanical and Electronic Engineering, China University of Petroleum (East China), Qingdao, China
- 2China United Coalbed Methane Co., Ltd., Taiyuan, China
Targeting the problem of a small amount of fluid accumulation in deep coal seam gas (CSG) wells during flowing production stage, the evaporation drainage method is proposed to discharge the liquid accumulation. Based on the Dalton evaporation model and wind speed function, a calculation model of evaporation drainage was established for deep CSG wells, which was verified by laboratory experiments. Taking a CSG well in the western Ordos Basin as an example to analyze the evaporation drainage capacity, the influence of temperature, daily gas production, bottomhole flowing pressure (BHFP), formation gas water saturation on the evaporation drainage capacity was investigated. The results show that the maximum evaporation water production is 2,533.8 kg/d at a bottomhole temperature of 80°C and a gas production rate of 30 × 103 m3/d. It is found that the temperature and pressure have a marked influence on the evaporation drainage. By improving the gas production and bottomhole temperature, and reducing the BHFP can effectively promote the evaporation drainage capacity. The initial moisture content of CSG in the reservoir are inversely proportional to the evaporation drainage capacity. By adjusting the BHFP and daily gas production, the evaporation drainage capacity can match the liquid production rate of the formation. Evaporation drainage can effectively extend the flowing production time of deep CSG wells and reduce the costs of production.
1 Introduction
As unconventional natural gas, coal seam gas (CSG) has a great market prospect for development. CSG also plays an important role in developing clean energy (Scott et al., 2007; Qin et al., 2019; Zou et al., 2019; Wu et al., 2022). In recent years, China’s CSG has been developing rapidly, such as Qinshui Basin, Ordos Basin, eastern Yunnan and western Guizhou, etc. Some blocks have been commercialized (Meng et al., 2018; Geng et al., 2022; Wang et al., 2022; Zhu et al., 2023).
Unlike conventional natural gas, gas and water enter the wellbore almost at the same time at the beginning of production in CSG wells (Jiang et al., 2016; Chen et al., 2023). For CSG wells with high gas production and low water production, once the water cannot be discharged timely from the wellbore, water will accumulate at the bottom of the gas well. The liquid loading will seriously reduce the gas production rate and total gas production (Wang and Qin, 2019). To address this problem, some methods have been applied, such as intermittent production, foam drainage, gas lift, and artificial lift (Jin et al., 2004; Le et al., 2012; Wang et al., 2022). However, owing to the discontinuity of water production, the mechanical equipment for drainage cannot operate efficiently, which leads to the failure. Moreover, a large amount of production data should be analyzed before drainage operation (intermittent production, foam drainage, and gas lift), which increases the on-site adjustment frequency and cost (Qi et al., 2018). It is urgent to develop a new flowing production method that can better meet the requirement for gas and water production in CSG wells, especially for two-layer coproduction. The water carrying capacity of the CSG well is improved, and the flowing production time of CSG wells is effectively prolonged. Through exploration, it is found that the CSG reservoir is mainly distributed in the formation with a depth 1,000–2,000 m (Zhang B. et al., 2016; Gao et al., 2019). These CSG wells have many characteristics including high crustal stress, high temperature, high pressure, and low permeability (Qin et al., 2012; Zhu, 2020). Under the condition of high temperature, the evaporation rate of accumulated liquid at the bottomhole will be greatly increased (Gao et al., 2022; Zhao et al., 2023). Thus, discharging fluids loading by evaporation at the bottomhole is possible for CSG wells.
Research on evaporation began in 1802. The evaporation model was established through experiments. The evaporation speed of water in this model is directly proportional to the pressure difference of water vapor and the wind speed on the water surface, while inversely proportional to the air pressure on the water surface (Dalton, 1802). In 1882, A wind speed function expression was established based on the Dalton model (Stelling, 1882). Two water surface evaporation models were established respectively by energy balance method (Schmidt, 1915; Bowen, 1926). The Bowen ratio energy balance model solved the problem of sensible heat flux value, so it has a stronger application value. A evaporation model for reservoirs was established in 1943 (Horton, 1943). The Penman model was established by considering the effects of energy balance and gas flow, and the model has been widely verified and applied (Penman, 1948). The Penman model was simplified with the Priestley-Taylor coefficient (Priestley and Taylor, 1972; Cui and Liu, 2023). The R-H model was established based on the superposition relationship between free convection and forced convection, which is widely used (Ryan et al., 1974). The influences of air temperature, water surface wind speed, water temperature, and the temperature difference on the evaporation rate were analyzed through a wind tunnel test, and established a model of water surface evaporation speed (Chen et al., 1989). Based on the conservation of mass, combined with the hydrological station and laboratory data in typical areas of China since 1976, a model for lake water surface evaporation was established (Pu, 1994). In 2000, a evaporation calculation model was established by considering the three factors of water vapor, pressure difference, wind speed, and relative humidity (Li, 2000). In 2005, a piecewise function expression of wind speed function was established based on the Dalton model, which further reduced the error of surface evaporation prediction (Min, 2005). At present, the research on the evaporation model mainly focuses on the evaporation of conditions with normal temperature and pressure or reduced pressure (Wang et al., 2019; Liu et al., 2023). The pressure of CSG in the wellbore is high. The gas in the wellbore consists of methane and other hydrocarbons (Hou et al., 2023). Therefore, it is necessary to carry out theoretical research on the evaporation of the liquid drainage of CSG wells.
The contributions of this paper are as follows. 1) An evaporation drainage method that can be used for CSG wells was presented. Based on the Dalton evaporation model, the model gives an evaporation calculation method considering the characteristics of the gas production process (especially CSG wells). Through evaporation drainage, the time of flowing production for CSG wells can be effectively prolonged. 2) The influences of different factors (temperature, daily gas production, BHFP and moisture of gas.) on the evaporation drainage of liquid loading in CSG wells are analyzed, and measures to enhance the evaporation drainage of CSG wells are presented, such as raising the temperature of liquid loading at the bottomhole, circulating the injection of dry gas, and properly decreasing the BHFP.
The rest of the paper consists of the following parts: Section 2, The wellbore structure of CSG well and analysis of evaporation liquid carrying production feasibility. Second an evaporation drainage model combined with high-pressure conditions is presented. In section 3, the device, procedures and results for validation experiments are presented. The results and analysis are in Section 4. Finally, the conclusions are drawn in Section 5.
2 Theoretical analysis
2.1 Drainage of CSG well
There are two production modes in CSG production: single-layer production and multi-layer production (generally two layers). The flowing production structure of CSG wells for single-layer production and artificial lift drainage is shown in Figure 1. For the two-layer coproduction wells, the well structure and device are shown in Figure 2.
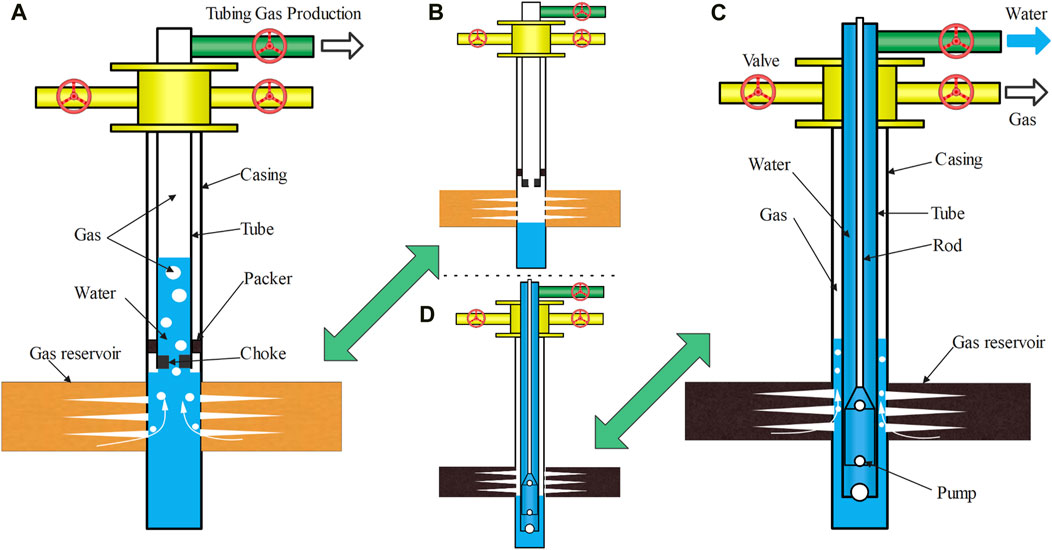
FIGURE 1. Downhole structures of single-layer production CSG wells (A) Gas wells flowing in tubing with liquid loading; (B) Gas wells flowing in tubing without liquid loading; (C) Gas wells drainage using a pump with liquid level in the upper part of the reservoir; (D) Gas wells drainage using a pump with liquid level in the lower part of the reservoir.
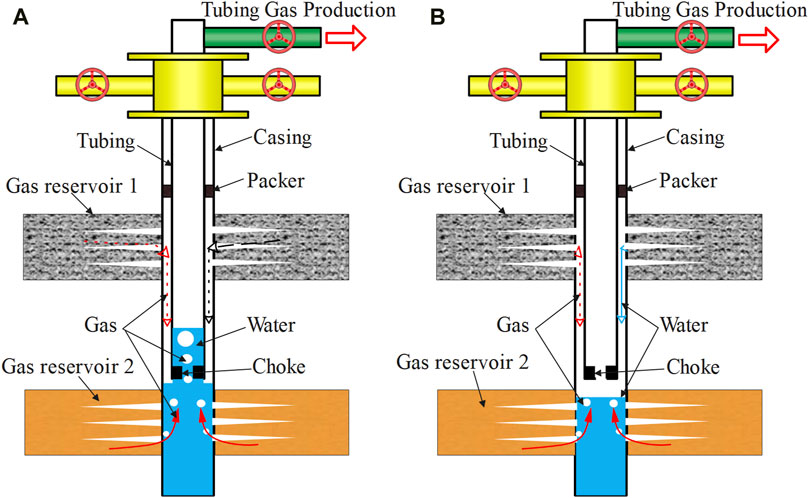
FIGURE 2. Structure of CSG coproduction wells. (A) Gas wells flowing in tubing with liquid loading; (B) Gas wells flowing in tubing without liquid loading.
As shown in Figure 1, the depth of the liquid level in the annulus between the tubing and the casing varies due to different gas and water production flow rates. For CSG wells with a liquid level lower than the production layer (Figures 1C, D), after entering the wellbore, gas flows from the reservoir upward to the ground. The liquid surface in the wellbore will continuously produce water vapor, which will be discharged out of the wellbore by flowing gas. Therefore, the CSG well with low liquid level production still has a certain water drainage capacity. As shown in Figures 1A, C, after entering into the wellbore, the gas passes through the liquid part. This results in the gas having a large contact area and enough time to contact with water (including water vapor) in the flow path. Thus, water vapor is equally discharged with gas flow. During the gas flow, its pressure continuously decreases. The gas continues to absorb the water vapor generated by the accumulated liquid in the annulus, so it has a certain water drainage capacity. Compared with single-layer, the CSG coproduction well of two-layer coproduction has a higher gas production, and the coproduction well has the capacity of flowing production in the early stage. Therefore, coproduction wells are produced by tubing, as shown in Figure 2.
For CSG wells with two layers of coproduction, the gas output of the coproduction well meets the production conditions of gas-carrying liquid (i.e., the water is discharged from the wellbore by gas flow), as shown in Figure 2B. However, with continuous production, the formation energy will gradually attenuate and the water production will increase gradually. At some time, when the fluid cannot be completely removed by the gas flow, the fluid would load up at the bottom of the wellbore. This results in the accumulation of fluid at the bottom of the wellbore, as shown in Figure 2A. The gas produced by the two layers enters the tubing from the annulus and passes through the liquid accumulation to the ground. The water vapor discharged by the evaporation of well fluid will be produced together with the gas, as Figure 1A. Therefore, the CSG well has an evaporation drainage capacity.
2.2 Moisture content model
In the moisture content calculation, the following assumptions are made. 1) The temperature of gas and liquid is the same throughout the process. 2) When the gas flows through the fluid accumulation in the wellbore, the gas flow rate is equal at any section. 3) Tubing and casing are concentric. 4) In the well-depth direction, the sectional dimensions of tubing and casing remain unchanged. 5) The gas from the reservoir is only methane.
In the production of CSG well, the well fluid produced by the reservoir is a mixture composed of water, inorganic salt, etc. Due to the different content of inorganic salt in the well fluid and the small impact of inorganic salt on the evaporation of water in the well fluid (Al-Shammiri, 2002). When conducting the moisture content calculation of gas, the well fluid is taken as pure water.
The moisture content of CSG can be obtained from Eq. 1 (Xue, 2006):
The Pv at different temperatures conforms to the Clausius Crabron Equation (Zhang J. et al., 2016) as follows:
Owing to the simultaneous presence of gas and water in the CSG reservoir, it is assumed that the relative humidity of the gas in the reservoir is 100%. Based on the data of the temperature gradient in the well logging formation, the PV at the temperature of the reservoir can be obtained by Eq. 2. The moisture content of the CSG d1 in the reservoir can be obtained by Eq. 3.
The relationship between moisture content in methane and temperature or pressure is shown in Figure 3, under conditions of temperature ranging from 20°C to 80°C and pressure ranging from 0.1 to 20.0 MPa.
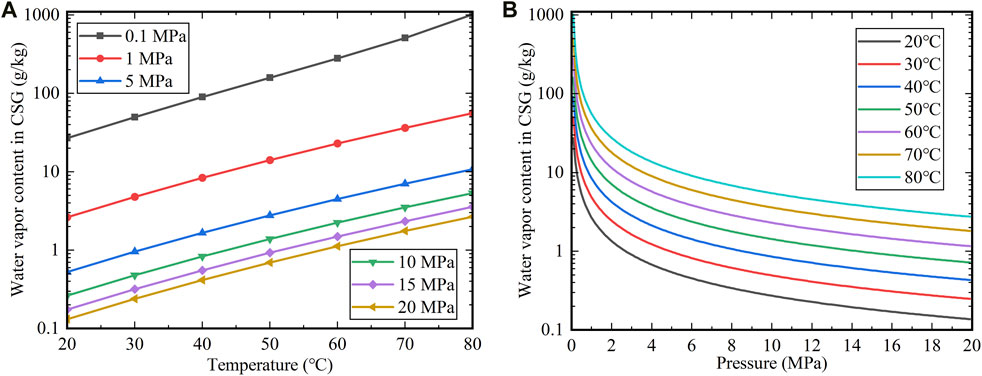
FIGURE 3. Saturated moisture content of CSG under different temperatures (A) and pressures (B).
As shown in Figure 3, the water vapor content of CSG is influenced by temperature and pressure. At the same temperature, the moisture content in CSG decreases with increasing pressure. When the pressure increases from 0.1 to 1.0 MPa, the moisture content in CSG drops rapidly, as shown in Figure 3A. At 20°C and 0.1 MPa, the moisture content in CSG is 26.94 g/kg, while at 1.0 MPa, the moisture content in CSG is 2.637 g/kg, with a drop of 90.22%. The moisture content in CSG was 1.317 g/kg at 2.0 MPa and decreased by 50.05% compared to 1.0 MPa. Under the same pressure condition, with the increase of temperature, the moisture content in CSG increases linearly in the logarithmic coordinate system.
2.3 Water vapor saturation of CSG
As the saturated CSG produced from the reservoir enters the wellbore annulus, the gas pressure decreases, and the gas changes into an unsaturated state due to the increase of saturated moisture content. At this point, the gas will continue to absorb the water vapor generated by the liquid accumulated in the annulus. However, the relationship between the gas flow rate and the rate of water evaporation from the well fluid shall be considered to determine whether the CSG can reach the saturated humidity under the bottomhole condition.
In the above evaporation calculation model, except the Dalton model, other models involve the influence of water and gas temperature difference, net surface radiation as shown in Table 1 and other factors on evaporation. In the wellbore, the water and gas temperature are basically the same, and there is no input of external heat such as sunshine. Dalton model was chosen to calculate the evaporation of the bottomhole accumulation, in which the wind speed function expression is chosen from the Min Q. model (Min, 2005).
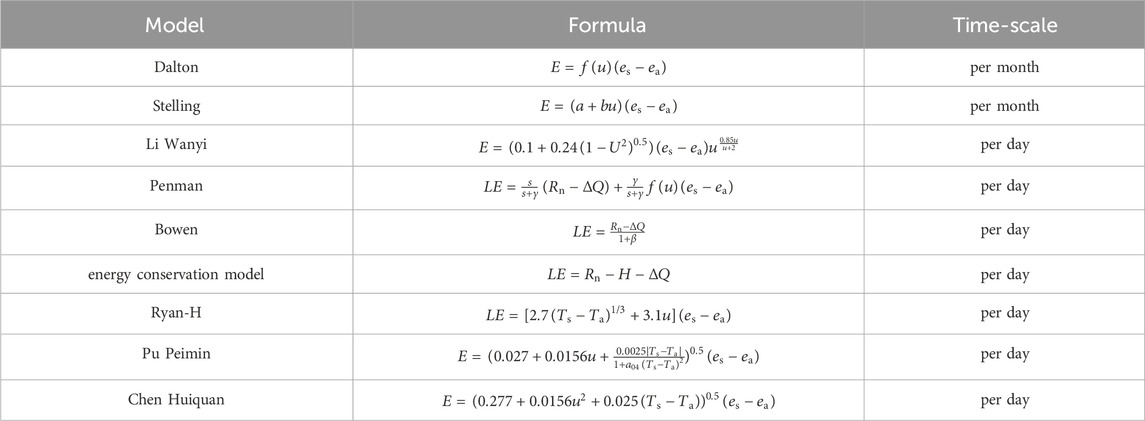
TABLE 1. Different models for water surface evapotranspiration calculation.
The temperature difference between the bottomhole and the reservoir is ignored. The downhole temperature is calculated according to the well depth and the ground temperature gradient. Therefore, the saturated vapor pressure of the gas at the bottomhole remains unchanged, and the saturated moisture content of the gas is only affected by the change in the pressure. The BHFP can be obtained by Eq. 4 (Jin et al., 2004):
The variables S and f can be obtained by Eq. 5
Associating Eqs 3, 4 to obtain the moisture content of bottomhole gas as expressed in Eq. 6:
By comparing d1 and d2, the water vapor unsaturation of the downhole CSG can be obtained. The unsaturated CSG will continue to absorb the water vapor generated by the evaporation of the well fluid in the annulus of the oil casing. However, the final saturation state depends on the relationship between the annular water evaporation rate and the gas flow rate. The downhole water evaporation rate can be calculated by the Dalton model (Dalton, 1802; Min, 2005), such as Eq. 7.
The evaporation coefficient α can be obtained by Eq. 8
To evaluate the change in moisture content of CSG, the following assumptions are made: a volume of CSG of ΔV passes through the surface of water, and the passage time is Δt. The moisture content of the CSG before it flows through the liquid surface is d1; the moisture content of the CSG after it passes through the water surface is d2, as shown in Figure 4.

FIGURE 4. Schematic diagram of the evaporation process of CSG through a water surface.
Based on the mass conservation of water vapor during evaporation, it can be expressed in Eq. 9:
The critical evaporation rate required for downhole CSG to reach saturation can be expressed as Eq. 10:
The critical gas velocity
By comparing Wd and Wdc values, it can be determined whether the downhole CSG reaches saturation state and its final moisture content. Due to the pressure distribution characteristics of the CSG well, the water vapor in the gas will not condense as the gas rises. Hence, the final gas vapor carrying capacity is the CSG moisture content at the bottom of the well. At the same time, the calculation formula of the final water drainage of low liquid level gas can be contained expressed as Eq. 12:
2.4 Experiment setups
This experiment is conducted with the experimental device of the multi-reservoir coproduction device based on wellhead pressure control. The device was independently designed and assembled by Jiangsu Tuochuang Scientific Research Equipment Co., Ltd. The device is mainly composed of wellbore simulation module, gas supply module, pressure control module, flow monitoring and display module, as shown in Figures 5A, B. The wellbore module is used to simulate the wellbore conditions for CSG well production. The gas supply module consists of a nitrogen cylinder and a booster pump and is used to provide high-pressure gas for the experiments. The pressure control module consists of multiple pressure-reducing valves and is used to control the supply pressure and wellhead back pressure. The flow monitoring module is mainly composed of two gas flowmeters, which is used to display the real-time flow of different branch. The reservoir pressure and wellhead back pressure are adjusted by the pressure valve group to reach the preset experiment conditions. The pressures are monitored by the sensor and transmitted to the display module.
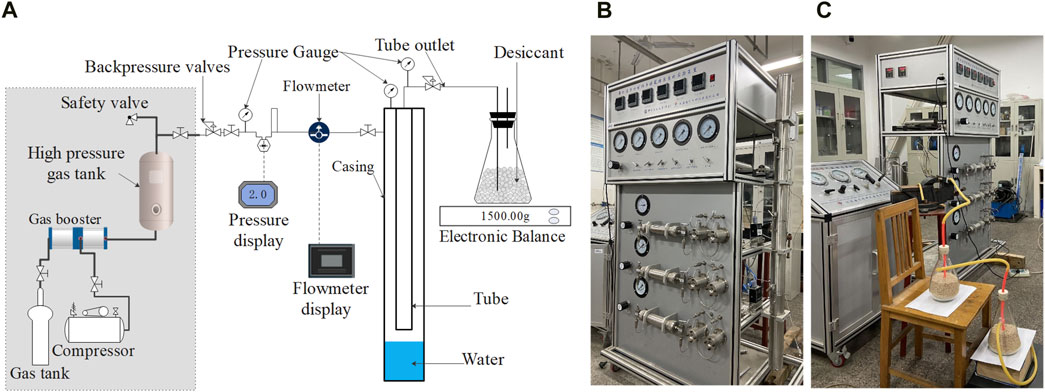
FIGURE 5. Setup for evaporation experiment. (A) Block diagram of experiment system; (B) Pressure module and wellbore simulation module; (C) Record during the experiment.
3 Experiments
To verify the correctness of the model, evaporation drainage experiments under different temperature and pressure conditions are carried out.
3.1 Experiment materials and parameters
As methane is flammable and explosive, we use nitrogen instead of methane. Due to the fast gas flow rate and different molecular diameters of water vapor and nitrogen after the high-pressure gas flows out of the wellbore, the desiccant of X13 molecular sieve is selected for gas drying. The maximum gas flow rate is 30.0 SL/min limited by the range of the gas flowmeter. The experimental temperatures were 20.0°C and 27.7°C. The pressure is set at 0.7–5.6 MPa. The steps of the evaporation experiment are as follows.
1. Inject a certain amount of water (set to 55.0 mL) into the wellbore using a syringe from the casing at the lowest end of the wellbore module.
2. Record the laboratory room temperature and the temperature at the bottom of the wellbore module.
3. Weigh and record the total mass of the drying device.
4. Connect the air supply system and set the pressure and wellhead backpressure.
5. Open the air supply system, connect the wellbore module gas outlet to the drying unit after the airflow stabilizes, and record the flowmeter readings.
6. Disconnect the wellhead gas outlet from the drying device when the cumulative gas flow reaches the test requirements.
7. Weigh the drying module again and record.
8. By changing the pressure value of the device and repeating the above steps.
3.2 Model validation
The results of the model calculations and experiments are shown in Figure 6.
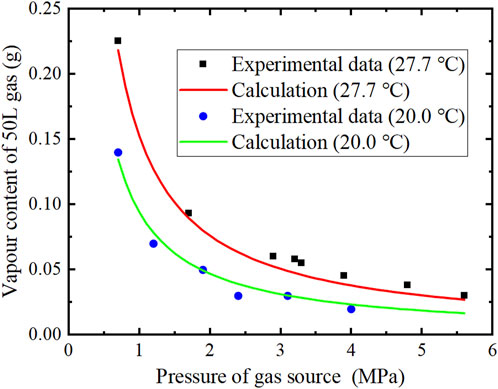
FIGURE 6. The mass of water vapor for experiments and model calculations at different temperatures and pressures.
As shown in Figure 6, the trend of changes in experiments and calculated data is consistent. However, there are deviations between the experimental values and the theoretical calculation values. The reasons for these deviations are as follows: gas volume measurement, drying device quality measurement, etc. As the temperature increases, the water content of the gas increases at the same pressure, since the saturated vapor pressure of water increases with increasing temperature. At the same temperature, the vapor content of the gas decreases as the CSG pressure increases. The experimental values are consistent with the calculated values of the model, which verifies the model.
4 Results and discussion
Taking a CSG well in Ordos Basin as an example, the evaporation drainage of CSG wells is analyzed. Through theoretical calculation and experimental evaporation data, it can be concluded that temperature, pressure, daily gas production and initial gas content have an impact on evaporation drainage. Calculations were carried out using MATLAB to analyze the effect of different factors on the amount of liquid discharged by evaporation. The parameters of a production well in Ordos Basin are shown in Table 2.
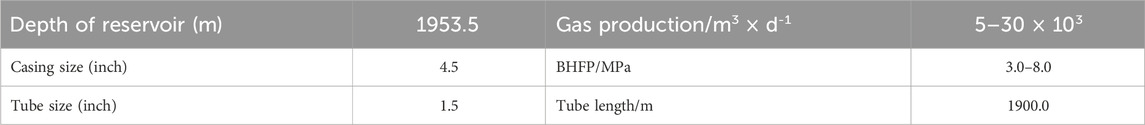
TABLE 2. Basic data of a CSG well in Ordos Basin.
4.1 Temperature
As shown in Figure 7, the water production by evaporation in CSG wells increases rapidly with increasing temperature. As shown in Figure 7A, when the BHFP is 1.0 MPa and the gas production is 30 × 103 m3/d, the mass of liquid discharged by evaporation increases from 56.75 kg/d to 1,203.90 kg/d when the bottomhole temperature is increased from 20°C to 80°C. As shown in Figure 7B, when the BHFP is 3.0 MPa and the bottomhole temperature is increased from 20°C to 80°C, the mass of liquid discharged by evaporation increases from 18.89 to 388.42 kg/d. The reason for the above change is that the saturated vapor pressure of water increases rapidly with the increase of downhole temperature, which leads to a sharp increase in the amount of vapor carried by saturated CSG, and thus leads to an increase in the amount of evaporated liquid carried by the CSG. This is consistent with the experiment results of different temperatures in Figure 6. From the above analysis, it is clear that temperature has a great influence on the evaporation drainage of CSG wells. Therefore, when CSG wells conduct evaporation drainage, wells with higher bottomhole temperatures can be prioritized. There is also the option of heating the fluid at the bottom of the well with a suitable device (such as electric heating, microwave heating, etc.), which can effectively improve the water production of evaporative fluid production.
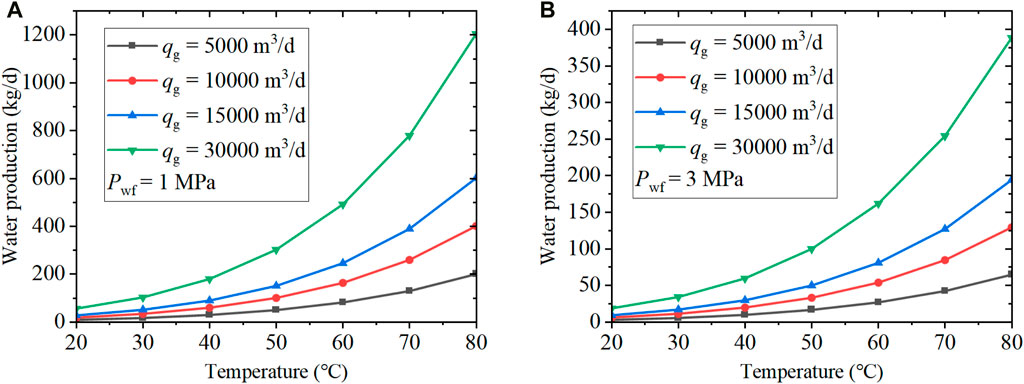
FIGURE 7. Effect of temperature variation on evaporative water production in CSG wells. (A) The BHFP is 1 MPa; (B) The BHFP is 3 MPa.
4.2 Daily gas production
As shown in Figure 8, under different temperature and pressure conditions, the evaporation drainage of the CSG well will increase with the increase in daily gas production. The reasons are as follows. Under the given condition of CSG well space parameters, the actual gas flow rate must not exceed the critical gas rate. Thus the gas is saturated with water vapor. As the daily gas production increases, the mass of the water discharged with the gas will also increase. As shown in Figure 8A, when the BHFP is 1.0 MPa and the temperature is 60°C, with the increase of gas production from 5 × 10³ m3/d up to 50 × 103 m3/d, the water production increases from 143.01 kg/d to 1,430.08 kg/d. The trends in Figure 8B are consistent with those in Figure 8A but differ in their values. Therefore, the evaporation drainage increases with the increase of daily gas production, and the water production of evaporation mode is linearly related to the gas production. In field application, when the water production is less than the theoretical evaporation drainage capacity, the evaporation drainage method can be adopted. While the daily water production is slightly greater than the theoretical evaporation drainage capacity of the current daily gas production, the evaporation drainage can be moderately increased by circulating dry gas injection to discharge more accumulated water.
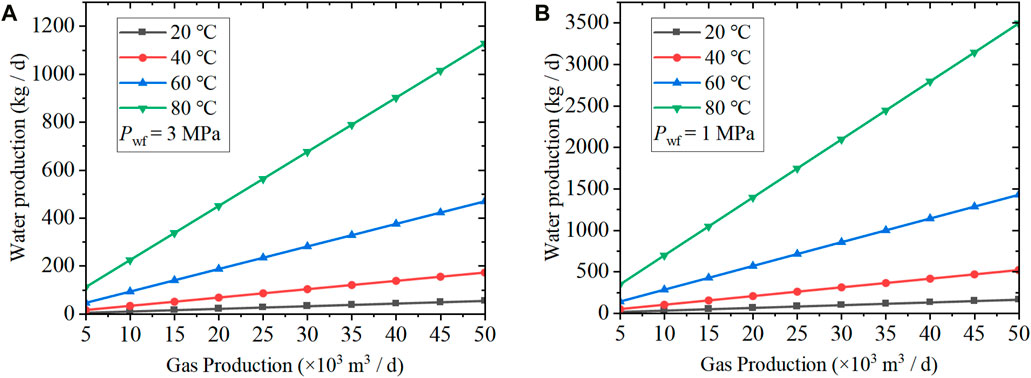
FIGURE 8. The influence of daily gas production changes at the bottom on evaporation drainage in CSG wells. (A) The BHFP is 1 MPa; (B) The BHFP is 3 MPa.
4.3 BHFP
As shown in Figure 9, under different temperatures, with the increase of BHFP, the water discharged by evaporation is in a declining trend. As shown in Figure 9A, while the bottomhole temperature is 80°C and the gas production is 10 × 103 m3/d, with the increase of BHFP from 0.5 to 7.0 MPa, the mass of evaporation drainage decreases from 335.05 kg/d to 23.04 kg/d. As shown in Figure 9B, while the bottomhole temperature is 80°C and the gas production is 10 × 103 m3/d, with the increase of BHFP from 0.5 to 7.0 MPa, the mass of evaporation drainage decreases from 844.6 to 54.98 kg/d. Under the condition of constant temperature and daily gas production, the saturated vapor pressure of water does not change. The reason for the change in evaporation drainage production is that the saturated vapor pressure ratio of water decreases with the increase of BHFP. This results in a decrease in the amount of water vapor per unit mass of CSG, which is consistent with the trend in the experimental data in Figure 6. Therefore, if the CSG well is considered to drain water through evaporation, the BHFP can be reduced through proper measures to ensure that the theoretical evaporation drainage production is greater than the actual water output.
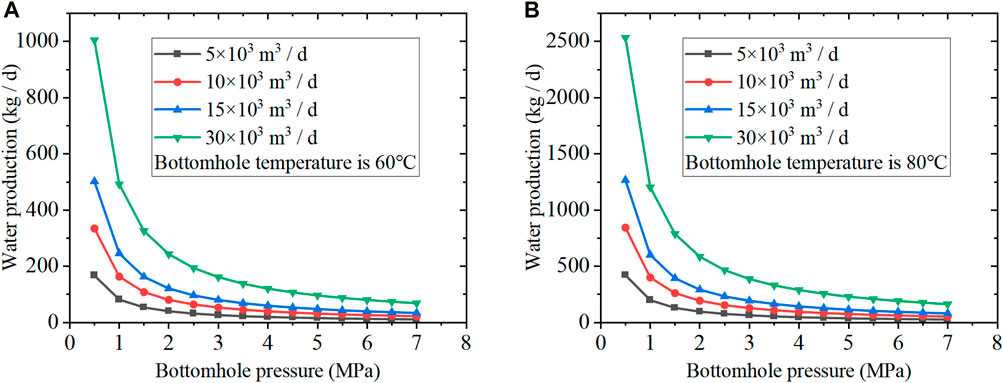
FIGURE 9. Effect of variation of BHFP on evaporation water production. (A) Bottomhole temperature is 60°C; (B) Bottomhole temperature is 80°C.
4.4 Moisture content of gas in reservoir
With single or multiple coproduction, the moisture content of the gas produced by the reservoir affects the amount of water vapor absorbed by the gas at the bottom of the well. The pressure drop between the reservoir and BHFP for single-layer production and the difference in moisture content between two layers for coproduction are considered for analysis. The results are shown in Figure 10.
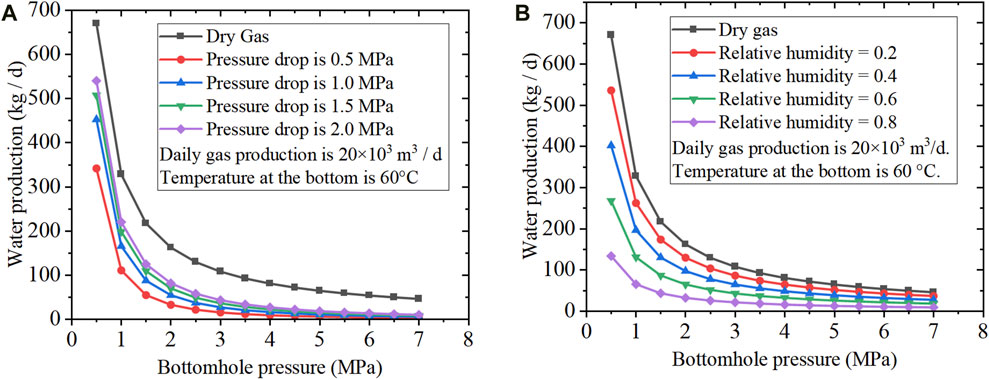
FIGURE 10. Effect of different moisture content of reservoir output gas on evaporative drainage. (A) Effect of difference in moisture content due to pressure difference between reservoir and BHFP; (B) Effect of difference in relative humidity of output gas from the other reservoir in a two-layer coproduction well.
As shown in Figure 10A, with the increase of pressure difference between the reservoir and BHFP, the amount of water discharged by evaporation increases, but the magnitude of the increase gradually decreases. When the BHFP is 1.0 MPa and the pressure difference is 0.5 MPa and 1.0 MPa, the water production by evaporation is 110.89 kg/d and 165.77 kg/d, respectively. When the pressure difference is 1.5 MPa, the water production by evaporation is 198.52 kg/d. The reasons for this trend are as follows. As the temperature of the bottom of the wellbore remains unchanged, the saturated vapor pressure of the effluent vapor from the bottom of the wellbore remains unchanged. Does not change. According to Eq. 11, as the bottomhole temperature is constant, the mass of water vapor per unit mass of CSG in the reservoir decreases with the increase of pressure difference. Due to the gas flow rate not reached the critical flow rate, when the gas enters the wellbore, it absorbs the water vapor produced by the evaporation of water in the wellbore and reaches the state of saturated water content. Therefore, when the pressure difference between the reservoir and the BHFP is greater, CSG could absorb more water vapor. However, as the pressure difference between the wellbore and the producing formation increases, the same magnitude of change in pressure difference does not result in the same magnitude of change in the mass of absorbed vapor. However, it gradually decreases as the pressure difference increases, which is consistent with the trend in Figure 8.
Different moisture contents of gas from different layers in coproduction CSG wells lead to different evaporation drainage capacities. As shown in Figure 10B, with the wellbore temperature of 60°C and daily gas production rate of 10 × 103 m3/d, when the moisture content of the gas produced from another production layer is different, the drainage capacity of the gas produced from this layer is opposite to the value of the moisture content of the gas. When the bottom pressure is 1.0 MPa and the relative humidity is 0.8, the evaporation drainage production is 65.65 kg/d. When the relative humidity is 0.6, the evaporated water production is 131.29 kg/d, which is twice as much as that of the moisture content of 0.8. The evaporated water yield at relative humidity of 0.4 is three times as much as that at 0.8 moisture content. The reason for this is that the moisture content is the mass fraction of water vapor in the gas. Therefore, as the humidity of the gas decreases, the mass of vapor that the gas can carry away from the bottom of the well increases proportionately.
5 Conclusion
Aiming at the problem that the short time for flowing production of CSG wells, which is caused by liquid loading. Based on the Dalton model, the model of evaporation drainage in the wellbore for CSG wells was established. The correctness of the evaporation model was verified by experiments in the laboratory. The effects of temperature, BHFP, daily gas production and moisture content of gas from the reservoir on the evaporation drainage were investigated. The increase of temperature and gas production can promote the growth of evaporation drainage. The increase of wellbore pressure and moisture content of reservoir gas will inhibit the evaporation process for drainage.
By lowering the BHFP of CSG wells, increasing the temperature of bottomhole fluid, and adopting measures such as circulating dry gas injection, the evaporation water production of bottomhole fluid can be further promoted, thus effectively prolonging the flowing production time of in CSG wells. This can effectively reduce the production cost of CSG wells (including co-production wells). Currently, we are working on tools for heating fluids at the bottomhole, which will be presented in a future work.
Data availability statement
The original contributions presented in the study are included in the article/Supplementary Material, further inquiries can be directed to the corresponding author.
Author contributions
HZ: Conceptualization, Writing–original draft, Writing–review and editing. CJ: Formal Analysis, Methodology, Writing–original draft, Writing–review and editing. FZ: Project administration, Supervision, Writing–original draft, Writing–review and editing. YQ: Funding acquisition, Writing–original draft, Writing–review and editing, Resources. HH: Funding acquisition, Investigation, Writing–original draft. TY: Validation, Writing–review and editing.
Funding
The author(s) declare financial support was received for the research, authorship, and/or publication of this article. This work is supported by the Major Science and Technology Project of CNOOC Corporation in the 14th Five-Year Plan “Key Technology for Onshore Unconventional Gas Exploration and Development” (ZZGSSAYFWGJS 2022-454); National Science and Technology Major Project (2016ZX05066004 and 2017ZX05064004).
Conflict of interest
Author HH was employed by China United Coalbed Methane Co., Ltd.
The remaining authors declare that the research was conducted in the absence of any commercial or financial relationships that could be construed as a potential conflict of interest.
Publisher’s note
All claims expressed in this article are solely those of the authors and do not necessarily represent those of their affiliated organizations, or those of the publisher, the editors and the reviewers. Any product that may be evaluated in this article, or claim that may be made by its manufacturer, is not guaranteed or endorsed by the publisher.
Abbreviations
BHFP, bottomhole flow pressure; CSG, coal seam gas.
References
Al-Shammiri, M. (2002). Evaporation rate as a function of water salinity. Desalination 150, 189–203. doi:10.1016/S0011-9164(02)00943-8
Bowen, I. S. (1926). The ratio of heat losses by conduction and by evaporation from any water surface. Phys. Rev. 27, 779–787. doi:10.1103/PhysRev.27.779
Chen, H., He, S., Liu, C., Zhang, S., Mao, S., and Zhao, D. (1989). Experimental study on mass and heat exchange at air-water interface of heated water body. J. Hydraulic Eng., 27–36.
Chen, S., Hou, X., Qu, X., Wang, Y., Zhou, B., Zhu, Y., et al. (2023). Superimposed gas-bearing system of coal measure gas and its natural gas accumulation characteristics: a case study of Yushe-Wuxiang demonstration area in the Qinshui Basin. Nat. Gas. Ind. 43, 12–22. doi:10.3787/j.issn.1000-0976.2023.05.002
Cui, Y., and Liu, Y. (2023). Advances in observation and calculation of lake evaporation. J. Lake Sci. 35, 1501–1517. doi:10.18307/2023.0501
Dalton, J. (1802). “Experimental essays on the constitution of mixed gases: on the force of steam or vapour from water or other liquids in different temperatures, both in a torricelli vacuum and in air; on evaporation; and on expansion of gases by heat,” in Memoirs of the literary and philosophical society of manchester. 5th ed.
Gao, H., Chen, Z., Shi, Z., Yan, C., Wang, B., Zou, Z., et al. (2022). Experimental study of the influence of water temperature on Pan evaporation. Acta Sci. Nat. Univ. Pekin. 58, 147–156. doi:10.13209/j.0479-8023.2021.093
Gao, X., Wang, Y., Li, Y., Guo, H., Ni, X., Wu, X., et al. (2019). Characteristics of tight sandstone reservoirs and controls of reservoir quality: a case study of He 8 sandstones in the linxing area, eastern Ordos Basin, China. Acta Geol. Sin. Eng. 93, 637–659. doi:10.1111/1755-6724.13862
Geng, L., Zhaobiao, Y., Wei, G., Zhengguang, Z., Bingren, J., and Benju, L. (2022). Characteristics of coal-measure gas reservoirs in thin interbedded marine–continental transitional facies and optimization of combined production: examples from the tucheng syncline in western Guizhou. Nat. Resour. Res. 31, 1503–1522. doi:10.1007/s11053-022-10053-8
Horton, R. E. (1943). Hydrologic interrelations between lands and oceans. Eos Trans. AGU 24, 753–764. doi:10.1029/TR024i002p00753
Hou, X., Zhang, J., Zhu, Y., Zhou, G., Chen, L., Wang, Y., et al. (2023). Distribution and geological controls on gas-bearing section of coal measure gases in Qinshui Basin. Coal Sci. Technol., 1–10. doi:10.13199/j.cnki.cst.2022-2081
Jiang, W., Wu, C., Wang, Q., Xiao, Z., and Liu, Y. (2016). Interlayer interference mechanism of multi-seam drainage in a CBM well: an example from Zhucang syncline. Int. J. Min. Sci. Technol. 26, 1101–1108. doi:10.1016/j.ijmst.2016.09.020
Jin, Z., Yang, C., and Zhang, S. (2004). Gas production engineering. First edition. Beijing: Petroleum Industry Press.
Le, H., Tang, J., Ge, Y., and Yu, P. (2012). Drainage and gas production technology. 1st ed. Beijing: Petroleum Industry Press.
Liu, Y., Zhou, L., and Du, X. (2023). Evaporation in thin film region of water at ambient temperature under reduced pressure conditions: flow and interface characteristics. Vacuum 209, 111814. doi:10.1016/j.vacuum.2023.111814
Meng, S., Li, Y., Wu, X., Xu, Y., and Guo, H. (2018). Productivity equation and influencing factors of co-producing coalbed methane and tight gas. J. China Coal Soc. 43, 1709–1715. doi:10.13225/j.cnki.jccs.2018.4019
Min, Q. (2005). Research on the application of Dalton’ s formula. Adv. Sci. Technol. Water Resour., 17–20.
Penman, H. L. (1948). Natural evaporation from open water, hare soil and grass. Proc. R. Soc. Lond. A 193, 120–145. doi:10.1098/rspa.1948.0037
Priestley, C. H. B., and Taylor, R. J. (1972). On the assessment of surface heat flux and evaporation using large-scale parameters. Mon. Wea. Rev. 100, 81–92. doi:10.1175/1520-0493(1972)100<0081:OTAOSH>2.3.CO;2
Pu, P. (1994). Studies on the formulae for calculating evaporation and heat loss coefficient from water surface in China (I). J. Lake Sci. 6, 1–12. doi:10.18307/1994.0101
Qi, Y., Pan, L., Zhu, H., Zhang, F., and Zhang, J. (2018). Analysis of continuous transition condition for coalbed methane of rod pump-velocity string drainage. Coal Technol. 37, 7–9. doi:10.13301/j.cnki.ct.2018.08.003
Qin, Y., Shen, J., Shen, Y., Li, G., Fan, B., and Yao, H. (2019). Geological causes and inspirations for high production of coal measure gas in Surat Basin. Acta Pet. Sin. 40, 1147–1157. doi:10.7623/syxb201910001
Qin, Y., Shen, J., Wang, B., Yang, S., and Zhao, L. (2012). Accumulation effects and coupling relationship of deep coal bed methane. Acta Pet. Sin. 33, 48–54.
Ryan, P. J., Harleman, D. R. F., and Stolzenbach, K. D. (1974). Surface heat loss from cooling ponds. Water Resour. Res. 10, 930–938. doi:10.1029/WR010i005p00930
Schmidt, W. (1915). Strahlung und Verdunstung an freien asserflächen; ein Beitrag zum Wärmehaushalt des Weltmeers und zum Wasserhaushalt der Erde. Ann. Calender Hydrogr. Marit. Meteorol. 43, 111–124.
Scott, S., Anderson, B., Crosdale, P., Dingwall, J., and Leblang, G. (2007). Coal petrology and coal seam gas contents of the Walloon Subgroup — surat Basin, Queensland, Australia. Int. J. Coal Geol. 70, 209–222. doi:10.1016/j.coal.2006.04.010
Stelling, E. (1882). Über die Abhängigkeit der Verdunstung des Wassers von seiner Temperatur und von der Feuchtigkeit und Bewegung der Luft. Österreichische Ges. für Meteorol. 17, 372.
Wang, C., Xu, R., Chen, X., Jiang, P., and Liu, B. (2019). Study on water flash evaporation under reduced pressure. Int. J. Heat Mass Transf. 131, 31–40. doi:10.1016/j.ijheatmasstransfer.2018.11.009
Wang, F., Xiong, T., Liu, Y., Bi, C., Shan, Y., Wang, X., et al. (2022). Study on coal measures gas exploration and exploitation Technology in duge minefield, western Guizhou. Coal Geol. China 34, 45–49+70. doi:10.3969/j.issn.1674-1803.2022.03.07
Wang, Z., and Qin, Y. (2019). Physical experiments of CBM coproduction: a case study in Laochang district, Yunnan province, China. Fuel 239, 964–981. doi:10.1016/j.fuel.2018.11.082
Wu, X., Liu, Z., Wang, J., Zheng, M., Chen, X., and Qi, X. (2022). Petroleum resource potential, distribution and key exploration fields in China. Earth Sci. Front. 29, 146–155. doi:10.13745/j.esf.sf.2022.8.27
Zhang, B., Xu, W., Xu, Y., Gu, J., Yang, G., and Zhao, J. (2016a). Key parameters identification for deep coalbed methane reservoir in Linxing block of eastern Ordos Basin. J. China Coal Soc. 41, 87–93. doi:10.13225/j.cnki.jccs.2015.9031
Zhao, Z., Wang, T., Zhang, L., Ruan, J., and Zhu, X. (2023). Measurement and modeling of the evaporation rate of loess under high temperature. Int. J. Heat Mass Transf. 215, 124486. doi:10.1016/j.ijheatmasstransfer.2023.124486
Zhu, H., Qi, Y., Hu, H., Zhang, F., Jing, C., and Zhao, J. (2023). A wellbore pressure control method for two-layer coal seam gas coproduction wells. Energies 16, 7148. doi:10.3390/en16207148
Zhu, S. (2020). Study on prediction of deep coalbed methane production capacity and dynamic change law of reservoir permeability in Linxing block. Available at: https://kns.cnki.net/KCMS/detail/detail.aspx?dbcode=CMFD&dbname=CMFD202002&filename=1020048846.nh&v=.
Zou, C., Yang, Z., Huang, S., Ma, F., Sun, Q., Li, F., et al. (2019). Resource types, formation, distribution and prospects of coal-measure gas. Petroleum Explor. Dev. 46, 451–462. doi:10.1016/S1876-3804(19)60026-1
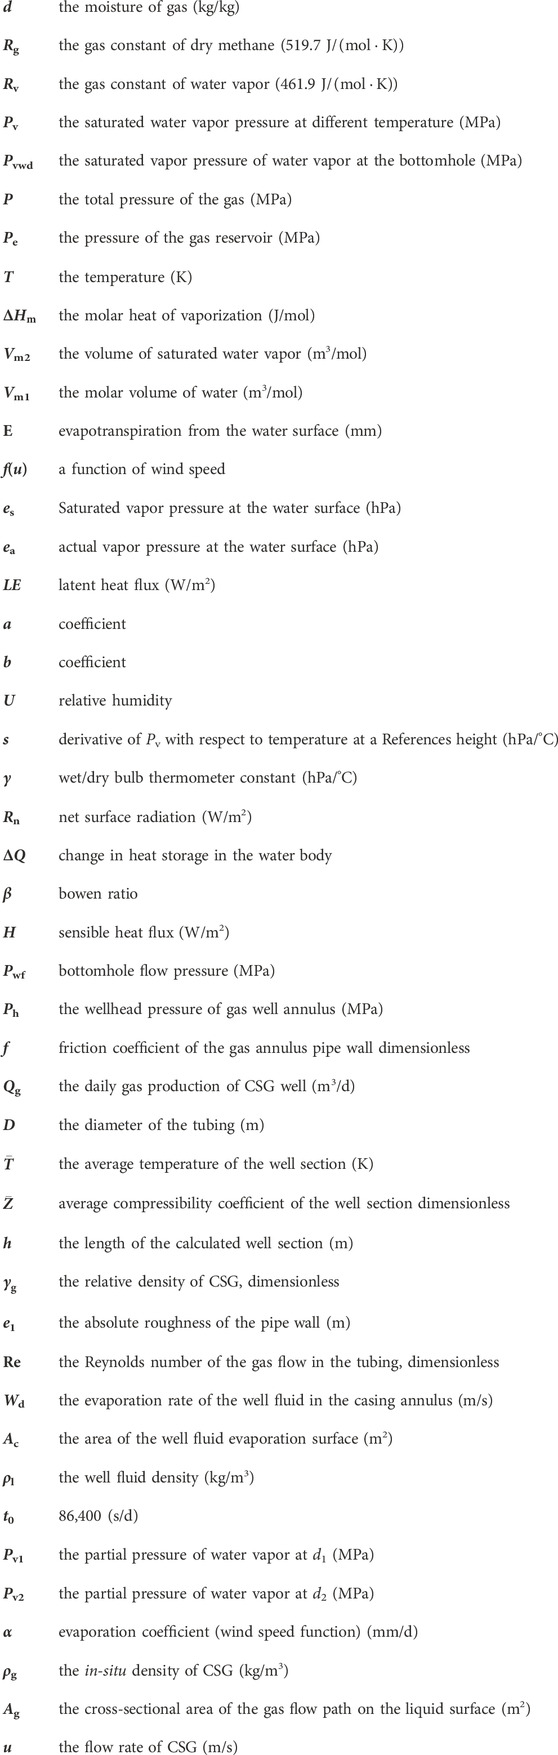
Nomenclature
Keywords: deep coal seam gas well, evaporation drainage, experimental validation of the evaporation model, prolong time of flowing production, liquid loading cleanup
Citation: Zhu H, Jing C, Zhang F, Qi Y, Hu H and Yi T (2024) Study on evaporation drainage of deep coal seam gas wells. Front. Energy Res. 12:1339901. doi: 10.3389/fenrg.2024.1339901
Received: 17 November 2023; Accepted: 06 February 2024;
Published: 22 February 2024.
Edited by:
Hongyan Qu, China University of Petroleum, ChinaReviewed by:
Jie Zeng, Southwest Petroleum University, ChinaErdong Yao, China University of Petroleum, China
Copyright © 2024 Zhu, Jing, Zhang, Qi, Hu and Yi. This is an open-access article distributed under the terms of the Creative Commons Attribution License (CC BY). The use, distribution or reproduction in other forums is permitted, provided the original author(s) and the copyright owner(s) are credited and that the original publication in this journal is cited, in accordance with accepted academic practice. No use, distribution or reproduction is permitted which does not comply with these terms.
*Correspondence: Fenna Zhang, MjAxNTAwNjlAdXBjLmVkdS5jbg==