 Xiang Huang1
 Ruizeng Zhao2*
- 1State Grid Zhejiang Electric Power Company Ltd., Hangzhou, China
- 2School of Economics and Management, Southwest University of Science and Technology, Mianyang, China
Previous studies on the carbon emission efficiency (CEE) in the power industry have neglected concerns related to regional heterogeneity and the integer character of certain indicators. In response to these issues, this study proposes a meta-frontier DEA model that integrates integer constraints for evaluating the CEE of China’s provincial power industry from 2011 to 2021. This study also proposes to apply the Theil, technology gap ratio, and inefficiency decomposition indexes to analyze regional disparities, technological gaps, and strategies for enhancing CEE within China’s provincial power industry. The research findings highlight several key points. First, China’s power industry exhibits inefficiencies in CEE. The central region mainly contributes to the overall CEE decline, and approximately 70% of provinces demonstrate an average CEE below 0.70. Second, the technological level of the western region is leading, while that of the central region is the worst. Specifically, Ningxia, Hainan, and Jiangsu have the most advanced production technology levels. Third, substantial disparities in CEE within China’s power industry primarily stem from regional imbalances in development. Fourth, technical inefficiency contributed 68.24% of the CEE in the central region, and management inefficiency contributed 96.91% and 65.42% in the western and eastern regions, respectively. Overall, China’s power industry still has 37% potential for improvement.
Introduction
The power industry plays a crucial role in promoting China’s economic and social development by supplying the energy essential for economic growth and ensuring the sustainability of social production (Zhu et al., 2020). However, given China’s current energy landscape, thermal power remains the primary source of power generation (Zhao et al., 2021). Coal consumption for thermal power generation exceeds 50% of China’s total coal usage (Jia and Lin, 2021). In the short term, fundamentally changing the energy consumption mode dominated by fossil energy, especially coal, remains difficult, which also determines that the power industry will long remain China’s primary source of greenhouse gas emissions (Zhao et al., 2021). Scientifically assessing the power industry’s carbon emission efficiency (CEE) is essential for offering practical guidance towards sustainable development in China (Zhang et al., 2022).
Scholars have used a variety of methods to evaluate the CEE, and these methods mainly include stochastic frontier analysis (Cai et al., 2019), fuzzy set theory (Taylan et al., 2016), entropy weight method (Banadkouki, 2023), Topsis (Govindan and Sivakumar, 2016), and data envelopment analysis (DEA) (Zhang et al., 2015). Among these methods, DEA is frequently used (Zhang and Wei, 2015). However, previous studies have some research gaps as follows. First, owing to the regional heterogeneity inherent in the power system, substantial variations exist in resource input, power output, and production technology (Han et al., 2020). Neglecting the inherent heterogeneity in investigating CEE within the power system may yield biased evaluation outcomes, thereby hindering the provision of precise decision-making guidance to policymakers (Yu et al., 2022). Second, most scholars have not considered the integer constraints of some indicators, such as integer constraints on employment numbers (Chen et al., 2021a). This oversight can result in biased efficient boundaries that provide insufficient support for decision-making reference.
To address these research gaps, this study conducted specific practical work as follows. First, this study proposes improved DEA models based on the meta-frontier analysis framework and integer constraints. Then, these models are utilized to measure power industry’s CEE. Second, this study constructs a development difference measurement index and a technology gap ratio (TGR) index to analyze the regional heterogeneity and technology heterogeneity of CEE in the power industry. Third, this study decomposes the inefficiency of CEE to explore the internal factors leading to low performance in the power industry and provides improvement strategies.
The contributions of this study can be summarized as follows. First, variations in regional development across China lead to heterogeneity in the technological level of China’s regional power industries. Previous studies have ignored the technological heterogeneity (Sueyoshi et al., 2020; Li et al., 2022), potentially leading to biased CEE results. This study addresses this issue by constructing a DEA model within a meta-frontier framework. Second, existing research often lacks identification of the constraints of input–output indicators when overemphasizing reducing inputs or increasing outputs (Liu and Sun, 2022). For example, personnel input indicators are characterized by integer constraints. Disregarding the integer constraints on indicators can result in the generation of inaccurate production boundaries and the formulation of misleading conclusion. To address this issue, this study incorporates integer constraints into the evaluation models, realistically reflecting the integer characteristics of some indicators. Third, some studies have been done to deconstruct the inefficiency of carbon emissions to explore efficiency improvement strategies (Ding et al., 2020; Wang and Feng, 2021; Chen and Wang, 2023). However, the research on exploring technology gaps between groups and non-equilibrium CEE between groups and within groups is insufficient. Therefore, this study combines the Theil, TGR, and inefficiency decomposition indexes to explore the technology gap of CEE, the differences in CEE between regions and within regions, and the improvement strategies for CEE in China’s power industry. The combined use of these methods can provide valuable improvement strategies for CEE enhancement in the power industry from multiple perspectives.
The content of the following four sections is organized as follows. A comprehensive overview of the relevant literature is displayed in Section 2. Section 3 elaborates on the extended model and its associated indicators. Section 4 is the empirical findings and their corresponding interpretations. Section 5 summarizes the study’s findings and provides relevant recommendations.
Literature review
Application of DEA in performance evaluation
DEA is a non-parametric method that utilizes linear programming to assess the relative efficiency of similar evaluation units based on input and output indicators (Sueyoshi et al., 2017). In comparison to the parametric SFA model, the DEA method can produce superior evaluation results while requiring a smaller dataset. At the same time, it has many advantages, such as no need to set indicator weights, unified indicator dimensions, and preset function models (Fall et al., 2018). Classical DEA models include the CCR model (Charnes et al., 1978) with constant returns to scale and the BCC model (Banker et al., 1984) with variable returns to scale. Throughout the evolutionary development of DEA models, scholars have explored and developed various DEA models to overcome the potential limitations of traditional approaches. In traditional DEA, the flexibility in weight selection often results in identifying multiple DMUs as valid, posing challenges in distinguishing between all DMUs. Roll et al. (1991) and Roll and Golany (1993) introduced a series of approaches to derive a unified weight set, considering various viewpoints to maximize the average efficiency and the number of effective DMUs. Tone (2001) proposed a slacks-based DEA (SBM) model to deal with the problems of excess input and insufficient output related to DMU. Andersen and Petersen (1993) were the pioneers in introducing the concept of super-efficiency. The super-efficiency DEA model allows for the reordering of effective units, facilitating the differentiation of efficiency among these units. Subsequently, to circumvent the disadvantages of tranditional super-efficiency model, Tone (2002) developed a super SBM method. Fried et al. (2002) proposed the three-stage DEA model, which effectively eliminates the influence of external factors and statistical noise, resulting in a more realistic efficiency calculation. Tone and Tsutsui. (2010) proposed an epsilon-based measure (EBM) model including radial and non-radial information based on SBM, which can more honestly and effectively reflect the efficiency of DMU. To address the missing data within the dataset, Cook et al. (2013) developed a heterogeneous DEA model to evaluate the relative efficiency of datasets with more relaxed homogeneity criteria. Lio and Liu (2018) regarded input and output as uncertain variables and proposed an uncertain DEA model.
The DEA method has undergone continuous expansion and evolution, gaining widespread application in production, management, environmental, and economic decision-making analyses due to its high adaptability. For example, Wu et al. (2019) used the EBM model to evaluate the production efficiency of Chinese coal enterprises and found that mining areas far away from cities have high efficiency. Liu et al. (2020) utilized the improved super-SBM to explore and find noticeable regional differences in industrial water efficiency in China, and areas with highly scarce water sources have the highest industrial water efficiency. Shuai and Fan (2020) employed the super-efficiency approach to assess China’s green economic efficiency. Additionally, they employed Tobit regression to examine the U-shaped relationship between environmental regulations and green economic efficiency. Liu et al. (2020) considered the common frontier framework and intermediate output target setting and evaluated the loan efficiency and deposit efficiency of 28 commercial British airlines in China through the developed two-stage DEA model. The results show that most banks’ deposit subsystems exhibit inefficiency, and a large loan efficiency gap exists among banks. Chen et al. (2021) segmented the production process of the high-tech industry into three series of sub-stages characterized by shared inputs and undesired outputs. They employed the super DEA approach to assess overall innovation and sub-stage efficiency. The findings highlight pronounced variations in innovation efficiency across Chinese provinces, with significant room for improvement. Xiao et al. (2021) utilized a two-stage DEA method to assess the ecological efficiency of resource-based cities in China. Their findings indicate a year-over-year improvement in overall efficiency, with governance and production efficiency displaying parallel growth trends. Chen et al. (2021) measured the operational efficiency of 52 universities in China through an extended two-stage DEA model under the framework of considering shared inputs. The results show that 75% of colleges and universities operate inefficiently, with no significant difference between regions. Yu and Zhang (2021) investigated the influence of low-carbon pilot policies on CEE using DEA and regression models. The empirical outcomes indicate that China’s low-carbon pilot policies contribute to improving CEE. Wang et al. (2021) assessed China’s energy efficiency development trends and features. Their findings indicate significant potential for improvement in China’s overall energy efficiency. Regional energy efficiency predominantly exhibits a pattern of being high in the east and low in the west, with the disparities within and between regions gradually diminishing. Zhou et al. (2023) applied the non-radial DEA and the staggered difference-in-differences models to analyze the impact of innovation on improvement in carbon total factor productivity. Their research provides valuable suggestions for improving carbon productivity and innovation direction in China.
Evaluation of CEE in the power industry
The electric power industry serves as the cornerstone of the national economy. As the primary energy consumer, it consumes substantial energy and releases significant pollutants. Consequently, scholarly attention has consistently gravitated toward research on the CEE of the power industry. Xie et al. (2018) employed the game cross-efficiency method to assess the environmental efficiency of the power generation sector across 30 provinces in China and revealed notable regional disparities. Sueyoshi et al. (2018) introduced natural disposability, management disposability, and group heterogeneity into the DEA model to evaluate the sustainability performance of the power generation sectors in China’s coastal and inland regions. The study identified regional disparities in the sustainability performance of these power generation sectors. Wang et al. (2018) integrated the material balance principle into the DEA method to assess China’s thermal power industry’s environmental and emission reduction efficiency. Building upon this foundation, the authors introduced the Malmquist productivity index to track environmental and emission reduction efficiency variations. Sun et al. (2020) employed meta-frontier technology and DEA methods to empirically analyze China’s provincial power system’s sustainable performance and technological disparities. The findings reveal pronounced regional disparities in China’s power system’s sustainable performance and technological prowess, with strength concentrated in the east and relative weakness in the west. Sueyoshi et al. (2020) proposed an improved DEA method to identify group heterogeneity among the evaluated units. This method was applied in the environmental performance analysis of China’s inter-provincial power industry, revealing substantial disparities in power’s environmental performance under natural and managed disposability. Du et al. (2021) used DEA and econometric models to analyze the impact of environmental regulation on the production performance of power plants in China. Based on the results, the authors also provided recommendations for implementing environmental regulations and improving the production performance of power plants in China. Sun et al. (2021) introduced the meta-frontier into the performance evaluation model to quantify the technological disparities among power supply chain systems. They assessed the sustainable development performance of China’s regional power supply chain systems, with empirical findings indicating pronounced regional technological heterogeneity within China’s power supply chain system and substantial potential for improvement in its sustainable development performance. Xie et al. (2022) proposed an improved semi-disposable dynamic network SBM model and evaluated the environmental efficiency of China’s inter-provincial power system. The empirical findings indicate that the recent power system reform has markedly enhanced the efficiency of China’s power generation and distribution sectors. Sun and Dong (2022) constructed a DEA model to evaluate the carbon emission reduction performance of the clean power industry in 58 countries. The results show significant differences in carbon emission reduction performance across countries, and regional and industry heterogeneity affects the gap in technology and management levels. Fang et al. (2022) explored the CEE and improvement strategies of 42 thermal power plants in China through the SBM model. The results reveal a polarization phenomenon in the CEE distribution of thermal power plants and noticeable regional differences.
Literature summary
The above literature shows that scholars have conducted a series of studies on the CEE of the power industry. The main differences between this study and the previous studies are as follows. First, performance evaluation for electricity or other energy systems has been extensively studied and analyzed by scholars (Mardani et al., 2017). However, the majority of these studies have concentrated on energy saving or emission reduction, ignoring the heterogeneity that exists between different units being evaluated. Unlike most of the previous studies, this study incorporates the regional technological heterogeneity of the power industry into the evaluation process and assesses the CEE of the power industry from the group- and meta-frontier perspectives. Second, with the exception of Liu and Sun (2022), few studies have considered the integer constraints associated with indicators during the efficiency evaluation process. However, the model of Liu and Sun (2022) is radial and may overestimate evaluation results. Unlike Liu and Sun (2022), this study extends the model from a non-radial perspective to obtain reasonable results. This study also introduces Kuosmanen’s (2005) technique into the DEA method to effectively model the convex technology and the weak disposability of the outputs. Third, previous studies usually use the inefficiency decomposition index to explore efficiency improvement strategies from a single perspective. Unlike previous studies, this study combines the Theil, TGR, and inefficiency decomposition indexes to explore the technology gap of CEE, the differences in CEE between regions and within regions, and the improvement strategies of CEE in China’s power industry. The combined use of these indexes in this paper can provide improvement strategies for CEE improvement in China’s power industry from multiple perspectives.
Models and indicators
Group-frontier DEA
Assume that
In Model (1),
Meta-frontier DEA
Model (1) can calculate the group efficiency of each DMU. Referring to O’Donnell et al. (2008), this section proposes the meta-frontier model.
In Model (2),
Technology gap ratio
The TGR indicates the technological disparity between the group- and meta-frontier. The larger the value, the closer the DMU is to the meta-frontier technology level. In essence, a greater TGR corresponds to a higher production technology level.
Theil index
The Theil index was widely used to estimate regional income gaps. This index divides the gap into intra- and inter-group gaps, thereby measuring the temporal changes in the two types of gaps and their contribution to the total gap. This study uses the Theil index to measure regional differences in the CEE of China’s power industry. The Theil index can decompose the overall regional differences (
The samples in this study were stratified into three groups according to geographical location: eastern, central, and western. Here,
CEE inefficiency decomposition
Building upon the work of Yu and Chen. (2020), this study decomposes CEE inefficiency into two components: technical inefficiency (TIE) and management inefficiency (MIE). By assessing the contribution ratio of TIE and MIE, this study conducts an in-depth analysis of the internal factors behind inefficiency, potential for improvement, and directions for enhancement in each province. The specific formula is as follows:
In Model (7),
Indicator description
This study refers to the selection of evaluation indicators by Sun et al. (2020) and uses the following input–output indicators to assess the CEE of China’s power industry. The four input indicators are energy consumption (X1), power generation installed capacity (X2), energy industry investment (X3), and power industry employment-population (X4). The desired output is power generation (Y1), and the undesired output is CO2 emissions (Y2). Input indicators and power generation are derived from China’s electricity, energy, and employment-related statistical yearbooks. CO2 data come from the Emissions Database for Global Atmospheric Research. Statistical descriptions of these indicators are presented in Table 1.
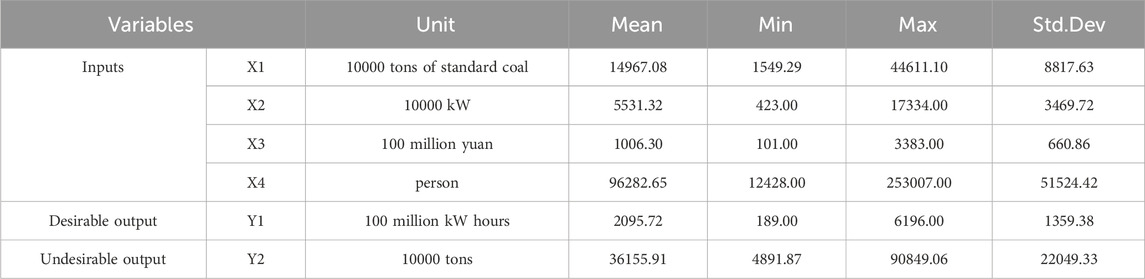
TABLE 1. Statistical descriptions.
Empirical analysis
CEE analysis
Figure 1 depicts the meta-frontier efficiency change characteristics of CEE in China’s power industry from 2011 to 2021. The following discoveries are made. First, the CEE in the eastern and central regions follows a U-shaped trend, similar to the overall trend. Until 2016, the CEE in the western region remained constant, but after that, it demonstrated annual improvement. This change can be linked to the issuance of China’s 13th 5-year plan for electric power development, which played a pivotal guiding role. This plan delineates 18 critical tasks and provides a clear direction for fostering green and CEE within the power industry. Second, throughout the study period, the average CEE of the power industry is highest in the eastern region, followed by the western region, while the central region displays the lowest performance, with respective average values of 0.68, 0.67, and 0.50. In addition, this study’s investigation revealed that post-2017, the CEE of the power industry in the western region surpassed that in the eastern region. Despite the eastern province’s well-developed economy and advanced technical infrastructure, granting it a leading edge in CEE, it grapples with substantial electricity demand and relies heavily on a single form of power generation (Cheong et al., 2019). By contrast, the western region boasts abundant power generation capacity and diverse forms of power generation, positioning it not only to meet regional power demands but also to play a pivotal role in west–east power transmission (Wang et al., 2019). Third, the average CEE across China’s power industry is 0.63. Figure 1 shows that the central region’s CEE has dragged down the overall level. This phenomenon may be intricately linked to regional resource endowments. The eastern and western regions predominantly employ nuclear, hydropower, photovoltaic, and wind energy, whereas the central region heavily relies on thermal power generation (Liu et al., 2017). Consequently, the choice of power generation method significantly influences the CEE in the central region and overall.
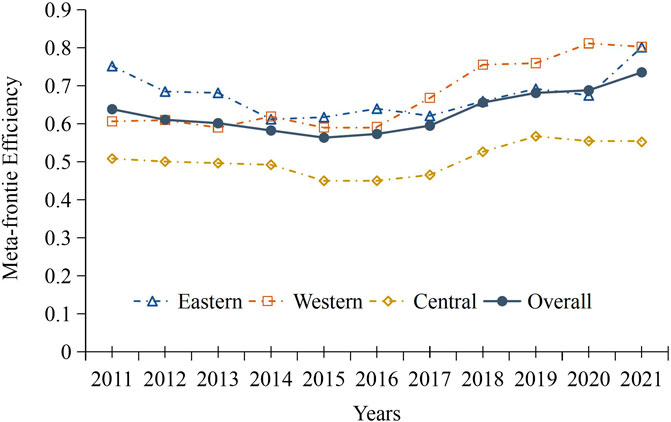
FIGURE 1. Meta-frontier CEE trends.
The study offers a comprehensive insight into the CEE levels of the power industry in each province, as depicted in Figure 2. Some results can be summarized. First, regarding the ranking of provinces within the region, Hainan, Jiangsu, and Zhejiang in the eastern region rank among the top three in group-frontier CEE, with their average values being 0.99, 0.95, and 0.91, respectively. The average group-frontier CEE values of Ningxia and Qinghai in the western region exceeded 0.90, which are 0.92 and 0.90, respectively. In the central region, Jiangxi, Anhui, and Inner Mongolia exhibit the group’s highest average CEE, with values of 0.99, 0.97, and 0.96, respectively. Second, each province’s average meta-frontier CEE falls below the group frontier performance average. Overall, only Hainan, Jiangsu, Ningxia, and Qinghai have meta-frontier CEE averages exceeding 0.90, which are 0.98, 0.93, 0.92, and 0.90, respectively. The meta-frontier CEE averages of provinces in the central region are generally lower than 0.50.
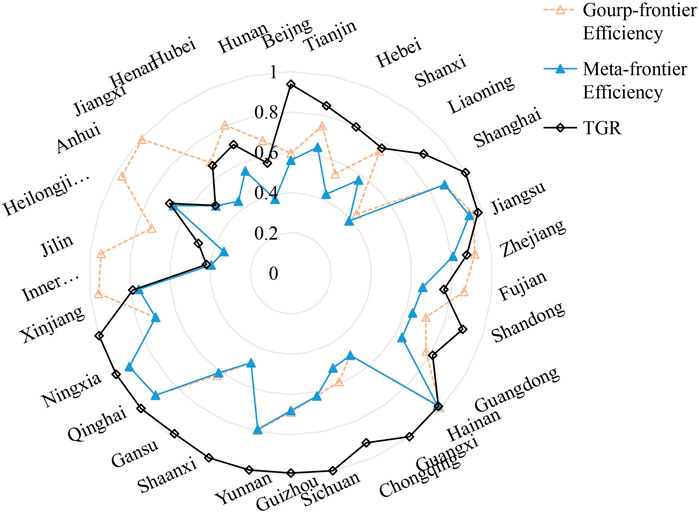
FIGURE 2. Averages of CEE and TGR of each province from 2011 to 2021.
TGR analysis
Figure 2 illustrates the average TGR for each province from 2011 to 2021, providing insights into the following findings. First, the TGR mean of the western provinces is generally close to 1.00, which shows that the group-frontier technology level of the western provinces is close to the meta-frontier technology level. Second, Ningxia, Hainan, and Jiangsu exhibit high average TGR rankings and have high meta-frontier CEE. This observation indicates that these three provinces operate at an optimal production technology level and display technological leadership. This outcome may be because Ningxia is a leader in solar power generation, and Jiangsu is outstanding in nuclear and solar energy. Therefore, their TGR levels are higher. Hainan’s power industry is small in scale, so input and output are relatively efficient. Figure 3 compares the average TGR across each region, revealing that the overall average TGR hovers around 0.84. The average TGR value of the western region is the highest, followed by the eastern region, and the central region is the lowest. Their average values are 0.99, 0.88, and 0.60, respectively. This finding shows that the production technology level in the central region has great potential for improvement.
FIGURE 3. Average changes in TGR from 2011 to 2021.
Regional differences analysis
This section delves deeper into the underlying factors contributing to variations in CEE within the regional power industry. Figure 4 illustrates the overall inter-regional and intra-regional variances in CEE over the study period. This section finds the following conclusions. First, the overall difference is consistent with the trend of intra-regional differences, showing a U-shaped trend during the study period. Second, intra-regional differences accounted for 81.56% of the overall differences, while inter-regional differences accounted for 18.44%. This result indicates that intra-regional differences are the main factor responsible for the overall differences. This result may be because the development of provinces within the region is unbalanced, and developed provinces have a siphon effect on less developed provinces (Wei et al., 2020; Sun et al., 2023). Specifically, noticeable economic and technological differences also arise among regional provinces. Economically developed provinces prioritize technological innovation and environmental conservation (Zhang and Li, 2020). Therefore, developed provinces can improve input–output efficiency through technological innovation. At the same time, increased ecological awareness and investment in green innovation can alleviate the production of undesired outputs (Lv et al., 2021). The gap between developed and underdeveloped provinces in the region will also continue to expand with the economic and technological gap (Ouyang et al., 2021).
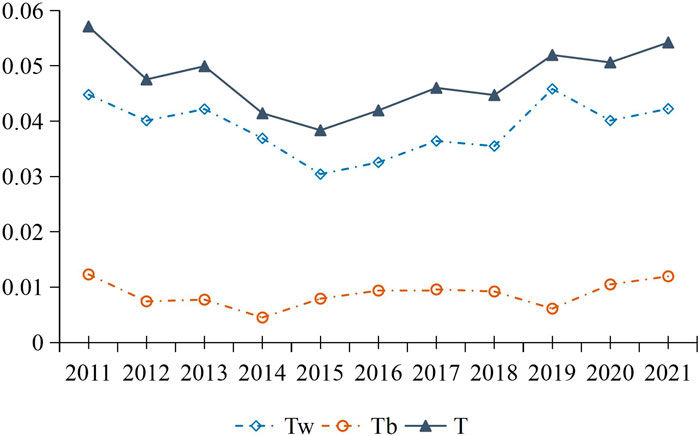
FIGURE 4. Differences in regional CEE from 2011 to 2021.
Improvement potential analysis
This section explores the potential for improvement in the CEE of China’s power industry and the internal causes of its inefficiency. Figure 5 shows the overall CEE inefficiency and its decomposition. First, the average inefficiency in CEE within the power industry initially rises and declines over time, signifying an overall improvement in China’s power industry. Second, the changing trend of overall inefficiency is consistent with the changing trend of management inefficiency, and the level of management inefficiency is higher than that of technical inefficiency. This result indicates that managerial inefficiency is the dominant factor in overall inefficiency. Third, technical inefficiency is relatively stable, with its average value floating around 0.13. Over the study period, the mean values for overall CEE and management inefficiency are 0.37 and 0.24, respectively.
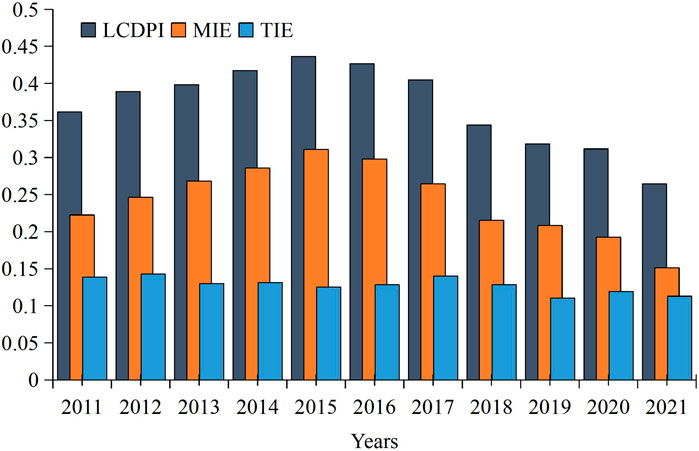
FIGURE 5. Decomposition of CEE inefficiency from 2011 to 2021.
Figure 6 presents the inefficiency decomposition of each region, from which the following conclusions can be obtained. First, the central region is most affected by technical inefficiency, with its contribution reaching 68.24%, far exceeding the overall national level. Second, the western region is mainly affected by management inefficiency, which accounts for 96.91%. Third, management inefficiency largely dominates the CEE inefficiency in the eastern region, with technical inefficiency contributing to 34.58% of the overall inefficiency. The reasons for this result are shown below. First, Figure 7 shows that technical inefficiency in Anhui, Jiangxi, Jilin and Inner Mongolia in the central region contributes more than 80% to CEE inefficiency. The poor technical performance of these provinces pulls down the technical efficiency of the central region. They need to focus on improving their technology levels. Second, as depicted in Figures 2, 7, there is a small gap between group-efficiency and meta-efficiency in both the eastern and western regions. Therefore, the power industry in these two regions should currently focus on management improvements.
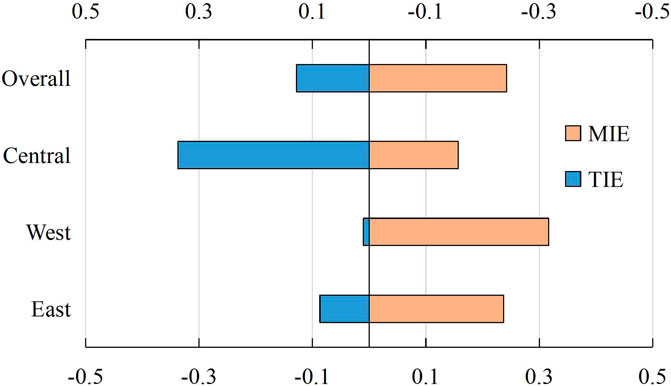
FIGURE 6. Decomposition of CEE inefficiency in each region.
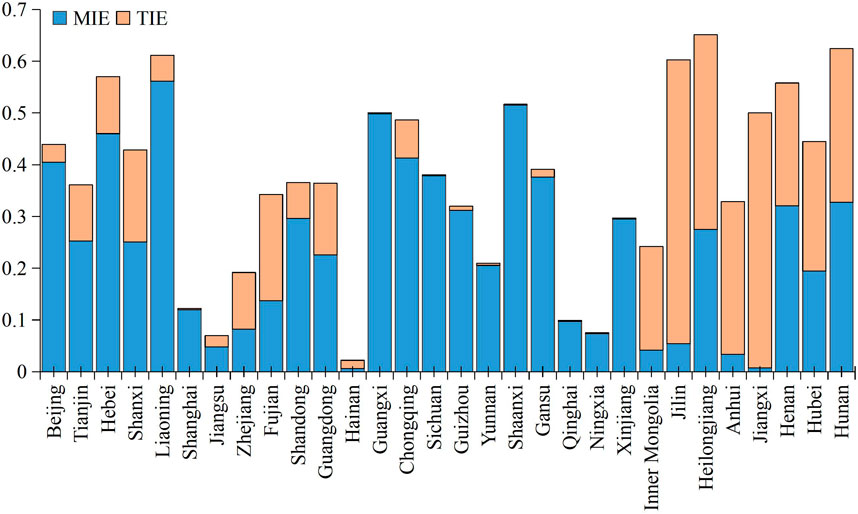
FIGURE 7. Decomposition of CEE inefficiency in each province.
In this section, a strategy map for enhancing the CEE of the power industry is presented in Figure 8, using each province’s average management and technical inefficiency as a foundation. Type 1 provinces should prioritize improving their management capabilities. Provinces categorized as Type 2 exhibit relatively high levels of CEE with limited room for improvement. Type 3 provinces should address enhancements in management and technical proficiency. Lastly, Type 4 provinces should focus on elevating their technology levels.
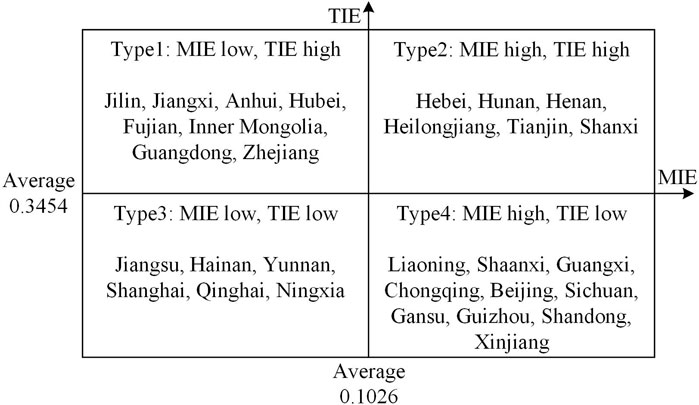
FIGURE 8. Improvement strategies of each province.
Conclusion and suggestions
This study expands the DEA model using the meta-frontier analysis framework and integer constraints to assess China’s power industry’s CEE from 2011 to 2021. In addition, it investigates regional disparities, technology gaps, the underlying causes of inefficiency, and improvement directions within China’s power industry’s CEE utilizing the Theil, TGR, and inefficiency decomposition indexes. The research findings are summarized below. First, the CEE of China’s power industry has improved year by year, with the average performance values of the eastern, central, and western regions being 0.68, 0.67, and 0.50, respectively. Second, the CEE of the power industry in 70% of provinces is lower than 0.70. Third, the average TGR value is the highest in the western region, followed by the eastern region, and the lowest in the central region. Specifically, Ningxia, Hainan, and Jiangsu have existing technological leadership advantages. Fourth, uneven development within regions is the dominant factor causing the overall development gap in the power industry to increase. Fifth, management inefficiency is the leading internal cause of inefficiency in CEE in the power industry. The performance inefficiency of CEE in the central region is most affected by technical inefficiency, while the inefficiency of CEE in the eastern and western regions is affected by management inefficiency.
Drawing upon the findings of this study, the following implications are delineated. First, considerable room for improvement remains in the CEE of China’s power industry, and gaps are apparent between regions. The central region also brought down overall performance levels. China should therefore further scientifically lay out the power industry and entirely rely on regional green resources to drive green development of the power industry. Given that the uneven development within the region has widened the overall differences, the provinces in the region should coordinate development and promote the complementarity of the power industry network.
Second, Ningxia, Hainan, and Jiangsu have technological leadership advantages in the CEE of China’s power industry. Therefore, provinces with technological advantages should provide technical assistance to technologically backward provinces to promote the overall development of the power industry. Technical cooperation and exchanges should be strengthened among various regions.
Third, management inefficiency is the main factor leading to inefficiency in the CEE of the power industry. Government departments should therefore introduce supporting policies related to energy structure transformation and strengthen low-carbon supervision of the power industry. In addition, power generation companies should increase investment in clean energy technology research and development and reduce the proportion of thermal power generation.
Data availability statement
The original contributions presented in the study are included in the article/Supplementary material, further inquiries can be directed to the corresponding author.
Author contributions
XH: Conceptualization, Investigation, Resources, Supervision, Validation, Writing–original draft. RZ: Conceptualization, Data curation, Formal Analysis, Investigation, Methodology, Software, Writing–original draft, Writing–review and editing.
Funding
The author(s) declare that no financial support was received for the research, authorship, and/or publication of this article.
Conflict of interest
Author XH was employed by State Grid Zhejiang Electric Power Company Ltd.
The remaining author declares that the research was conducted in the absence of any commercial or financial relationships that could be construed as a potential conflict of interest.
Publisher’s note
All claims expressed in this article are solely those of the authors and do not necessarily represent those of their affiliated organizations, or those of the publisher, the editors and the reviewers. Any product that may be evaluated in this article, or claim that may be made by its manufacturer, is not guaranteed or endorsed by the publisher.
References
Andersen, P., and Petersen, N. C. (1993). A procedure for ranking efficient units in data envelopment analysis. Manag. Sci. 39 (10), 1261–1264. doi:10.1287/mnsc.39.10.1261
Banadkouki, M. R. Z. (2023). Selection of strategies to improve energy efficiency in industry: a hybrid approach using entropy weight method and fuzzy TOPSIS. Energy 279, 128070. doi:10.1016/j.energy.2023.128070
Banker, R. D., Charnes, A., and Cooper, W. W. (1984). Some models for estimating technical and scale inefficiencies in data envelopment analysis. Manag. Sci. 30 (9), 1078–1092. doi:10.1287/mnsc.30.9.1078
Cai, B., Guo, H., Ma, Z., Wang, Z., Dhakal, S., and Cao, L. (2019). Benchmarking carbon emissions efficiency in Chinese cities: a comparative study based on high-resolution gridded data. Appl. Energy 242, 994–1009. doi:10.1016/j.apenergy.2019.03.146
Charnes, A., Cooper, W. W., and Rhodes, E. (1978). Measuring the efficiency of decision making units. Eur. J. Operational Res. 2 (6), 429–444. doi:10.1016/0377-2217(78)90138-8
Chen, K., Ren, X. T., and Yang, G. L. (2021a). A novel approach for assessing academic journals: application of integer DEA model for management science and operations research field. J. Inf. 15 (3), 101176. doi:10.1016/j.joi.2021.101176
Chen, L., and Wang, Y. M. (2023). Game directional distance function in meta-frontier data envelopment analysis. Omega 121, 102935. doi:10.1016/j.omega.2023.102935
Chen, X., Liu, X., Gong, Z., and Xie, J. (2021b). Three-stage super-efficiency DEA models based on the cooperative game and its application on the R&D green innovation of the Chinese high-tech industry. Comput. Industrial Eng. 156, 107234. doi:10.1016/j.cie.2021.107234
Chen, Y., Ma, X., Yan, P., and Wang, M. (2021c). Operating efficiency in Chinese universities: an extended two-stage network DEA approach. J. Manag. Sci. Eng. 6 (4), 482–498. doi:10.1016/j.jmse.2021.08.005
Cheong, T. S., Li, V. J., and Shi, X. (2019). Regional disparity and convergence of electricity consumption in China: a distribution dynamics approach. China Econ. Rev. 58, 101154. doi:10.1016/j.chieco.2018.02.003
Cook, W. D., Harrison, J., Imanirad, R., Rouse, P., and Zhu, J. (2013). Data envelopment analysis with nonhomogeneous DMUs. Operations Res. 61 (3), 666–676. doi:10.1287/opre.2013.1173
Ding, T., Wu, H., Jia, J., Wei, Y., and Liang, L. (2020). Regional assessment of water-energy nexus in China’s industrial sector: an interactive meta-frontier DEA approach. J. Clean. Prod. 244, 118797. doi:10.1016/j.jclepro.2019.118797
Du, M., Liu, Y., Wang, B., Lee, M., and Zhang, N. (2021). The sources of regulated productivity in Chinese power plants: an estimation of the restricted cost function combined with DEA approach. Energy Econ. 100, 105318. doi:10.1016/j.eneco.2021.105318
Fall, F., Akim, A. M., and Wassongma, H. (2018). DEA and SFA research on the efficiency of microfinance institutions: a meta-analysis. World Dev. 107, 176–188. doi:10.1016/j.worlddev.2018.02.032
Fang, T., Fang, D., and Yu, B. (2022). Carbon emission efficiency of thermal power generation in China: empirical evidence from the micro-perspective of power plants. Energy Policy 165, 112955. doi:10.1016/j.enpol.2022.112955
Fried, H. O., Lovell, C. K., Schmidt, S. S., and Yaisawarng, S. (2002). Accounting for environmental effects and statistical noise in data envelopment analysis. J. Prod. Analysis 17, 157–174. doi:10.1023/a:1013548723393
Govindan, K., and Sivakumar, R. (2016). Green supplier selection and order allocation in a low-carbon paper industry: integrated multi-criteria heterogeneous decision-making and multi-objective linear programming approaches. Ann. Operations Res. 238 (1-2), 243–276. doi:10.1007/s10479-015-2004-4
Han, H., Ding, T., Nie, L., and Hao, Z. (2020). Agricultural eco-efficiency loss under technology heterogeneity given regional differences in China. J. Clean. Prod. 250, 119511. doi:10.1016/j.jclepro.2019.119511
Jia, Z., and Lin, B. (2021). How to achieve the first step of the carbon-neutrality 2060 target in China: the coal substitution perspective. Energy 233, 121179. doi:10.1016/j.energy.2021.121179
Kuosmanen, T. (2005). Weak disposability in nonparametric production analysis with undesirable outputs. Am. J. Agric. Econ. 87 (4), 1077–1082. doi:10.1111/j.1467-8276.2005.00788.x
Li, F., Zhang, D., Zhang, J., and Kou, G. (2022). Measuring the energy production and utilization efficiency of Chinese thermal power industry with the fixed-sum carbon emission constraint. Int. J. Prod. Econ. 252, 108571. doi:10.1016/j.ijpe.2022.108571
Lio, W., and Liu, B. (2018). Uncertain data envelopment analysis with imprecisely observed inputs and outputs. Fuzzy Optim. Decis. Mak. 17, 357–373. doi:10.1007/s10700-017-9276-x
Liu, N., Ma, Z., and Kang, J. (2017). A regional analysis of carbon intensities of electricity generation in China. Energy Econ. 67, 268–277. doi:10.1016/j.eneco.2017.08.018
Liu, X., and Sun, J. (2022). Analysis of China’s regional energy efficiency based on DEA considering integer constraint. Environ. Dev. Sustain., 1–18. doi:10.1007/s10668-022-02192-y
Liu, X., Yang, F., and Wu, J. (2020). DEA considering technological heterogeneity and intermediate output target setting: the performance analysis of Chinese commercial banks. Ann. Operations Res. 291, 605–626. doi:10.1007/s10479-019-03413-w
Luo, G., Baležentis, T., and Zeng, S. (2023). Per capita CO2 emission inequality of China's urban and rural residential energy consumption: a Kaya-Theil decomposition. J. Environ. Manag. 331, 117265. doi:10.1016/j.jenvman.2023.117265
Lv, C., Shao, C., and Lee, C. C. (2021). Green technology innovation and financial development: do environmental regulation and innovation output matter? Energy Econ. 98, 105237. doi:10.1016/j.eneco.2021.105237
Mardani, A., Zavadskas, E. K., Streimikiene, D., Jusoh, A., and Khoshnoudi, M. (2017). A comprehensive review of data envelopment analysis (DEA) approach in energy efficiency. Renew. Sustain. Energy Rev. 70, 1298–1322. doi:10.1016/j.rser.2016.12.030
N’Drin, M. G. R., Dahoro, D. A., Amin, A., and Kassi, D. F. (2022). Measuring convergence of energy and emission efficiencies and technology inequality across African countries. J. Clean. Prod. 381, 135166. doi:10.1016/j.jclepro.2022.135166
O’Donnell, C. J., Rao, D. P., and Battese, G. E. (2008). Metafrontier frameworks for the study of firm-level efficiencies and technology ratios. Empir. Econ. 34, 231–255. doi:10.1007/s00181-007-0119-4
Ouyang, X., Chen, J., and Du, K. (2021). Energy efficiency performance of the industrial sector: from the perspective of technological gap in different regions in China. Energy 214, 118865. doi:10.1016/j.energy.2020.118865
Roll, Y., Cook, W. D., and Golany, B. (1991). Controlling factor weights in data envelopment analysis. IIE Trans. 23 (1), 2–9. doi:10.1080/07408179108963835
Roll, Y., and Golany, B. (1993). Alternate methods of treating factor weights in DEA. Omega 21 (1), 99–109. doi:10.1016/0305-0483(93)90042-J
Shuai, S., and Fan, Z. (2020). Modeling the role of environmental regulations in regional green economy efficiency of China: empirical evidence from super efficiency DEA-Tobit model. J. Environ. Manag. 261, 110227. doi:10.1016/j.jenvman.2020.110227
Sueyoshi, T., Li, A., and Gao, Y. (2018). Sector sustainability on fossil fuel power plants across Chinese provinces: methodological comparison among radial, non-radial and intermediate approaches under group heterogeneity. J. Clean. Prod. 187, 819–829. doi:10.1016/j.jclepro.2018.03.216
Sueyoshi, T., Qu, J., Li, A., and Xie, C. (2020). Understanding the efficiency evolution for the Chinese provincial power industry: a new approach for combining data envelopment analysis-discriminant analysis with an efficiency shift across periods. J. Clean. Prod. 277, 122371. doi:10.1016/j.jclepro.2020.122371
Sueyoshi, T., Yuan, Y., and Goto, M. (2017). A literature study for DEA applied to energy and environment. Energy Econ. 62, 104–124. doi:10.1016/j.eneco.2016.11.006
Sun, J., and Dong, F. (2022). Decomposition of carbon emission reduction efficiency and potential for clean energy power: evidence from 58 countries. J. Clean. Prod. 363, 132312. doi:10.1016/j.jclepro.2022.132312
Sun, J., Li, G., and Lim, M. K. (2020). China’s power supply chain sustainability: an analysis of performance and technology gap. Ann. Operations Res., 1–29. doi:10.1007/s10479-020-03682-w
Sun, J., Wang, Z., and Li, G. (2018). Measuring emission-reduction and energy-conservation efficiency of Chinese cities considering management and technology heterogeneity. J. Clean. Prod. 175, 561–571. doi:10.1016/j.jclepro.2017.12.042
Sun, J., Xu, S., and Li, G. (2021). Does China’s power supply chain systems perform well? A data-based path-index meta-frontier analysis. Industrial Manag. Data Syst. 121 (9), 2048–2070. doi:10.1108/IMDS-04-2020-0183
Sun, Y., Shen, S., and Zhou, C. (2023). Does the pilot emissions trading system in China promote innovation? Evidence based on green technology innovation in the energy sector. Energy Econ. 126, 106984. doi:10.1016/j.eneco.2023.106984
Taylan, O., Kaya, D., and Demirbas, A. (2016). An integrated multi attribute decision model for energy efficiency processes in petrochemical industry applying fuzzy set theory. Energy Convers. Manag. 117, 501–512. doi:10.1016/j.enconman.2016.03.048
Tone, K. (2001). A slacks-based measure of efficiency in data envelopment analysis. Eur. J. Operational Res. 130 (3), 498–509. doi:10.1016/S0377-2217(99)00407-5
Tone, K. (2002). A slacks-based measure of super-efficiency in data envelopment analysis. Eur. J. Operational Res. 143, 32–41. doi:10.1016/S0377-2217(01)00324-1
Tone, K., and Tsutsui, M. (2010). An epsilon-based measure of efficiency in DEA–a third pole of technical efficiency. Eur. J. Operational Res. 207 (3), 1554–1563. doi:10.1016/j.ejor.2010.07.014
Wang, K., Wei, Y. M., and Huang, Z. (2018). Environmental efficiency and abatement efficiency measurements of China’s thermal power industry: a data envelopment analysis based materials balance approach. Eur. J. Operational Res. 269 (1), 35–50. doi:10.1016/j.ejor.2017.04.053
Wang, M., and Feng, C. (2021). The consequences of industrial restructuring, regional balanced development, and market-oriented reform for China's carbon dioxide emissions: a multi-tier meta-frontier DEA-based decomposition analysis. Technol. Forecast. Soc. Change 164, 120507. doi:10.1016/j.techfore.2020.120507
Wang, R., Wang, Q., and Yao, S. (2021). Evaluation and difference analysis of regional energy efficiency in China under the carbon neutrality targets: insights from DEA and Theil models. J. Environ. Manag. 293, 112958. doi:10.1016/j.jenvman.2021.112958
Wang, S., Zhu, X., Song, D., Wen, Z., Chen, B., and Feng, K. (2019). Drivers of CO2 emissions from power generation in China based on modified structural decomposition analysis. J. Clean. Prod. 220, 1143–1155. doi:10.1016/j.jclepro.2019.02.199
Wei, W., Hao, S., Yao, M., Chen, W., Wang, S., Wang, Z., et al. (2020). Unbalanced economic benefits and the electricity-related carbon emissions embodied in China’s interprovincial trade. J. Environ. Manag. 263, 110390. doi:10.1016/j.jenvman.2020.110390
Wu, P., Wang, Y., Chiu, Y. H., Li, Y., and Lin, T. Y. (2019). Production efficiency and geographical location of Chinese coal enterprises-undesirable EBM DEA. Resour. Policy 64, 101527. doi:10.1016/j.resourpol.2019.101527
Xiao, H., Wang, D., Qi, Y., Shao, S., Zhou, Y., and Shan, Y. (2021). The governance-production nexus of eco-efficiency in Chinese resource-based cities: a two-stage network DEA approach. Energy Econ. 101, 105408. doi:10.1016/j.eneco.2021.105408
Xie, B. C., Gao, J., Zhang, S., Pang, R. Z., and Zhang, Z. (2018). The environmental efficiency analysis of China’s power generation sector based on game cross-efficiency approach. Struct. Change Econ. Dyn. 46, 126–135. doi:10.1016/j.strueco.2018.05.002
Xie, B. C., Lu, L., and Duan, N. (2022). Environmental efficiency assessment of China’s integrated power system under the assumption of semi-disposability. Comput. Industrial Eng. 167, 108023. doi:10.1016/j.cie.2022.108023
Yu, M. M., and Chen, L. H. (2020). A meta-frontier network data envelopment analysis approach for the measurement of technological bias with network production structure. Ann. Operations Res. 287 (1), 495–514. doi:10.1007/s10479-019-03436-3
Yu, S., Yuan, X., Yao, X., and Lei, M. (2022). Carbon leakage and low-carbon performance: heterogeneity of responsibility perspectives. Energy Policy 165, 112958. doi:10.1016/j.enpol.2022.112958
Yu, Y., and Zhang, N. (2021). Low-carbon city pilot and carbon emission efficiency: quasi-experimental evidence from China. Energy Econ. 96, 105125. doi:10.1016/j.eneco.2021.105125
Zhang, N., and Wei, X. (2015). Dynamic total factor carbon emissions performance changes in the Chinese transportation industry. Appl. Energy 146, 409–420. doi:10.1016/j.apenergy.2015.01.072
Zhang, N., Zhou, P., and Kung, C. C. (2015). Total-factor carbon emission performance of the Chinese transportation industry: a bootstrapped non-radial Malmquist index analysis. Renew. Sustain. Energy Rev. 41, 584–593. doi:10.1016/j.rser.2014.08.076
Zhang, W., and Li, G. (2020). Environmental decentralization, environmental protection investment, and green technology innovation. Environ. Sci. Pollut. Res. 29, 12740–12755. doi:10.1007/s11356-020-09849-z
Zhang, Z., Hu, G., Mu, X., and Kong, L. (2022). From low carbon to carbon neutrality: a bibliometric analysis of the status, evolution and development trend. J. Environ. Manag. 322, 116087. doi:10.1016/j.jenvman.2022.116087
Zhao, G., Yu, B., An, R., Wu, Y., and Zhao, Z. (2021a). Energy system transformations and carbon emission mitigation for China to achieve global 2 °C climate target. J. Environ. Manag. 292, 112721. doi:10.1016/j.jenvman.2021.112721
Zhao, J., Jiang, Q., Dong, X., and Dong, K. (2021b). Assessing energy poverty and its effect on CO2 emissions: the case of China. Energy Econ. 97, 105191. doi:10.1016/j.eneco.2021.105191
Zhou, T., Huang, X., and Zhang, N. (2023). The effect of innovation pilot on carbon total factor productivity: quasi-experimental evidence from China. Energy Econ. 125, 106895. doi:10.1016/j.eneco.2023.106895
Keywords: power industry, carbon emission efficiency, DEA, meta-frontier, integer constraints
Citation: Huang X and Zhao R (2024) Regional differences and improvement potential of carbon emission efficiency in China’s power industry: insights from meta-frontier DEA model considering integer constraints. Front. Energy Res. 12:1339553. doi: 10.3389/fenrg.2024.1339553
Received: 16 November 2023; Accepted: 16 February 2024;
Published: 28 February 2024.
Edited by:
Xu Zhao, Shandong University, Weihai, ChinaReviewed by:
Morie Guy-Roland N’drin, Shandong University, Weihai, ChinaHaiqian Ke, Shandong University, China
Copyright © 2024 Huang and Zhao. This is an open-access article distributed under the terms of the Creative Commons Attribution License (CC BY). The use, distribution or reproduction in other forums is permitted, provided the original author(s) and the copyright owner(s) are credited and that the original publication in this journal is cited, in accordance with accepted academic practice. No use, distribution or reproduction is permitted which does not comply with these terms.
*Correspondence: Ruizeng Zhao, emhhb3J6QG1haWwudXN0Yy5lZHUuY24=