 Xiangfei Meng1*
 Lei Wang
 Nian Liu
- 1Economic and Technology Research Institute of State Grid Shandong Electric Power Company, Jinan, China
- 2North China Electric Power University, Beijing, China
The carbon factor is the core driving force behind the low-carbon transformation of the power system. The study of Emission Reduction Paths (ERPs) has become a key issue for the New-type Power System to achieve clean and low-carbon goals. In order to measure the relationship between ERP and the economy, this paper considers the retirement requirements of coal-fired power units and emission reduction requirements on a long cycle planning scale, and constructs a multi-scenario planning model that considers electric-thermal coupling, enabling the determination of installed capacity for power and heat sources each year. The effectiveness of the proposed model was verified using an improved IEEE-39 bus power system. A case study was conducted to analyze the economic performance of the system based on the selected ERP set. The results showed that under the rear acceleration’s ERP, the system could achieve optimal economic performance based on the selected ERP set.
1 Introduction
Under the framework of the dual carbon targets, reducing carbon emissions in the power system is pivotal for achieving low-carbon development (Xinyu CHEN et al., 2022; Du, 2023). For China to accomplish its carbon neutrality target by 2060, there should be a concerted effort to minimize the construction of coal-fired power units while augmenting the deployment of renewable energy units (Barakat et al., 2016; Shi et al., 2022). However, integrating intermittent and fluctuating sources like wind and solar power into the grid (Barakat et al., 2016; Alshammari et al., 2018; Samy et al., 2018) exacerbates the challenge of power supply instability within the power system. Ensuring sustainable power delivery involves rational deployment of energy storage capacities (Yuan and Shang, 2021; Liu et al., 2022a) and leveraging thermal energy resources to unleash the potential for adjustments on the heat side, thereby expanding the system’s regulatory capacity (Tongming LIU et al., 2022). Furthermore, combined heat and power (CHP) units enhance overall energy utilization and contribute to reducing the system’s carbon emissions. Consequently, the long cycle planning of ERPs in consideration of the electric-thermal coupling system is of significant importance in the current low-carbon transformation of China’s power system.
With the development of the economy and society, the interconnection between energy sources has become increasingly intricate, particularly in the deep coupling of electricity and heat. Presently, numerous scholars have made significant progress in studies involving the electric-thermal coupling power planning (Ding et al., 2021; Li et al., 2021; Liu et al., 2021) and coordinated electric-thermal coupling planning of sources and networks (Cui et al., 2019; Du et al., 2023). In studies considering electric-thermal coupling power planning, reference (Li et al., 2021) assembled a hybrid system comprising CHP units with concentrating solar power plants, effectively enhancing system operational flexibility. Furthermore, reference (Ding et al., 2021) integrated wind farms and solar-assisted CHP systems to establish a multi-source complementary CHP system, developing two linear models for heating and non-heating seasons, respectively. Moreover, reference (Liu et al., 2021) established an optimization model for an energy system in the electric-thermal coupling area with heat-to-power devices, based on the decoupling characteristics of heat pumps and electric boilers. In studies involving coordinated planning of sources and networks considering electric-thermal coupling, reference (Du et al., 2023) contemplated the reconfiguration of seasonal regional heating networks, proposing an electric-thermal coordination planning model, while reference (Cui et al., 2019) formulated a planning model for the coordinated distribution grid of distributed wind power generation and large-scale heat pumps. However, the planning research on CHP units in the aforementioned reference generally considers back-pressure or extraction-condensing types, providing unclear characterizations of the actual electric-thermal joinrt operation conditions.
The present power system’s power planning research can be categorized into single-node planning, long-term expansion planning, and low-carbon planning. In the studies related to single-node planning, reference (Liu et al., 2022b) integrates new energy sources and energy storage within a specific timeframe using a typical day approach. Additionally, reference (Huang et al., 2023) establishes a coordinated power planning model based on target cascading, focusing on the planning and configuration of power capacity within a designated year. To achieve practical power planning, long-term expansion planning involves continuous decisions regarding units throughout the planning period. Reference (RAWA et al., 2022) formulates a comprehensive technical-economic planning model for renewable energy and energy storage systems, considering load growth for mid-to-long-term renewable energy and energy storage capacity planning decisions. In the context of the power system’s low-carbon transformation, carbon emissions have become a crucial consideration. Present low-carbon planning research proposes new power system planning models aimed at low-carbon objectives, emphasizing technical means, economic incentives, and policy constraints (Chen et al., 2009; Qiao et al., 2023). Aligned with China’s current energy development situation (Weidou NI and Chen, 2021; Luo et al., 2023), the New-type Power System prioritizes clean and low-carbon objectives. The carbon factor emerges as the core driving force for the power system’s low-carbon transformation. However, current single-node planning research overlooks the mutual impact of unit expansion decisions during the planning period. Long-term expansion planning lacks consideration for low-carbon elements. Low-carbon planning research overlooks the retirement of coal-fired power units, and has limited involvement in long cycle ERPs driven by carbon factors.
In conclusion, based on the diverse practicalities of combined electric-thermal operations, this paper considers the actual issue of phased retirement of coal-fired power units in planning research, analyzing the impact of carbon-driven ERPs on the system’s economics. Therefore, this paper first focuses on the power and heat sources of a regional-level power system with thermal constraints, establishing a model for the operation of CHP units. Subsequently, within the scope of long-term planning, this paper develops a multi-scenario planning model aligned with system emission reduction objectives, analyzing the carbon dioxide emissions under various ERPs. The model optimizes the energy system structure and configuration to meet future energy development needs. Finally, this paper decomposes the long-term planning problem into annual issues, employing commercial solvers for resolution. The effectiveness of the proposed model was verified using an improved IEEE-39 bus power system.
2 System element analysis
2.1 System research objects
The subject of this study is a regional-level power system considering thermal constraints, depicted in Figure 1. The research accounts for load demand growth and the practicalities of electric-thermal coupling. Within the scope of long-term planning, expansions are made to the power and heat sources. The power component encompasses wind turbines, photovoltaic units, coal-fired power units, and energy storage systems. The heat sources involve heating boilers. CHP units serve as the coupling nodes in the studied system, fulfilling both electricity supply and heating tasks.
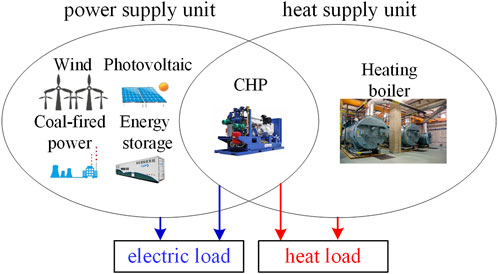
FIGURE 1. Schematic diagram of power system research objects.
2.2 Operation model of CHP units
CHP units can both provide heating and participate in the power generation process. Based on the operational conditions of CHP units, they are mainly categorized into two types: back-pressure and extraction-condensing.
The power generation and heating output of back-pressure CHP units are approximately linearly related, as shown in (Eq. 1).
where,
The extraction-condensing CHP units can freely adjust their power output for both electricity generation and heat supply within a certain range. This adjustability in power output allows for flexible unit operation, as depicted in Figure 2, illustrating the range of electric-thermal output, and as shown in (Eq. 2).
where,
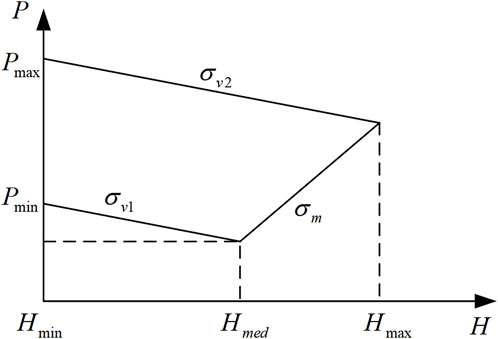
FIGURE 2. Operating range of extraction-condensing CHP units.
Additionally, heating boilers, functioning as supplemental heat sources on the thermal side, can decouple the electric-thermal coupling relationship of CHP units (Liu et al., 2021; Du et al., 2023).
3 A multi-scenario planning model considering electric-thermal coupling
The multi-scenario planning model developed in this paper can make decisions regarding the installed capacity of power and heat source units. To simplify the model, the model assumes investment and retirement decisions are made at the beginning of the year.
3.1 Objective function
The objective function of the multi-scenario planning model considering electric-thermal coupling is to minimize the total cost of the system during the planning period: as shown in (Eq. 3).
where,
The units considered in the system mainly include wind turbines, photovoltaic units, coal-fired power units, CHP units, and heating boilers. Energy storage accounts for electrochemical energy storage systems. Among these, wind turbines encompass offshore and onshore wind power, while CHP units comprise back-pressure and extraction-condensing types. The construction and maintenance costs for each type of unit are as shown in (Eqs 4, 5).
where,
where, i represents the discount rate.
The operating costs mainly comprise the generation cost and heat supply cost of fuel-based generating units, the curtailment penalty cost of new energy-based generating units, and the power operation cost of energy storage equipment: The operating costs are as shown in (Eqs 7, 8).
where,
The retirement planning of coal-fired power units should prioritize the decommissioning of units reaching the end of their service life. However, certain coal-fired power units with significant installed capacity and high efficiency may retain value as flexible resources even after reaching their designated lifespan. It is advisable to allow refurbishment and continued operation of these units.
During the planning period, for coal-fired power units that reach the end of their service life and are selected for decommissioning, their retirement costs should consider both disposal expenses and recovery revenue, as shown in (Eq. 9).
where,
During the planning period, the refurbishment cost for the selected coal-fired power units earmarked for renovation is as shown in (Eq. 10).
where,
The total cost of planned decommissioning of coal-fired power units during the planning period is as shown in (Eq. 11).
The penalty cost for load shedding and carbon emission cost of the system are as shown in (Eqs 12, 13).
where,
3.2 Constraint condition
The constraint conditions mainly include planning-level constraints and operational-level constraints. Planning-level constraints consist of installed capacity constraints and preliminary screening constraints for unit capacity. Operational-level constraints encompass power balance constraints, transmission line power constraints, unit output characteristic constraints, energy storage system behavioral constraints, spinning reserve capacity demand constraints, and carbon emission limitations.
Installed capacity constraints is as shown in (Eq. 14).
where,
The total installed capacity of the system’s power and heat sources should meet the maximum electric and thermal loads with a certain margin, incorporating a confidence factor to further narrow down the constraints. It is evident that this constraint is not exhaustive and is used solely for preliminary screening of obviously inadequate unit installation capacity configurations. Preliminary screening constraints for unit capacity are as shown in (Eqs 15, 16).
where,
The power balance constraints are as shown in (Eqs 17, 18).
where,
The transmission line power constraints is as shown in (Eq. 19).
where,
The unit output characteristic constraints are as shown in (Eqs 20, 21).
where,
For energy storage systems, the electric energy level must remain consistent before and after scheduling cycle and must be maintained within a certain range. The energy storage system behavioral constraints are as shown in (Eqs 22, 23).
where,
Setting positive and negative rotating reserve capacity is an effective measure to improve the reliability of power system operation. Usually, the positive and negative rotating reserve capacity is borne by coal-fired power units, CHP units, and energy storage systems. The spinning reserve capacity demand constraints are as shown in (Eqs 24, 25).
where,
To meet the dual carbon targets, limitations are imposed on the carbon emissions from fuel-based units in the system. Carbon emission limitations is as shown in (Eq. 26).
where,
The planning model ensures the reliable supply of electric loads and thermal loads through constraint conditions while demanding compliance with carbon emission targets. The model can generate the installed capacities of power and heat sources annually under the most economically optimal strategy and provide operational insights for various scenarios.
4 Solution method
For the planned retirement of coal-fired power units, there are two options: direct decommissioning or refurbishment for continued operation. To ensure that all planned retired coal-fired power units are decommissioned within the planning period, the following constraints exist as shown in (Eq. 27).
where,
For units in the system other than coal-fired power units, only expansion is considered. The previous year’s installed capacity is taken as the initial capacity for the subsequent year, as shown in (Eq. 28). The annual planning constraint for coal-fired power units should include the retirement capacity, as shown in (Eq. 29).
The long-term planning problem in this paper is decomposed into annual issues. Coal-fired power units designated for decommissioning consider two options: retirement and refurbishment. New energy units and heating units are only considered for additions. The model makes decisions on retirement and investment capacities at the planning level. Multi-scenario operational simulations are conducted based on the installed capacity results at the planning level. The previous year’s decisions are used as the initial conditions for the subsequent year’s problems, ensuring carbon reduction compliance. The specific model solving process is illustrated in Figure 3. Additionally, this paper linearizes the model, transforming the mixed-integer linear programming (MILP) problem into a pure linear programming (LP) problem. This problem is a typical convex optimization problem, solvable using commercial solvers for rapid solutions. The proposed model in this paper is solved using the Gurobi solver, with a solution precision set at 0.1%.
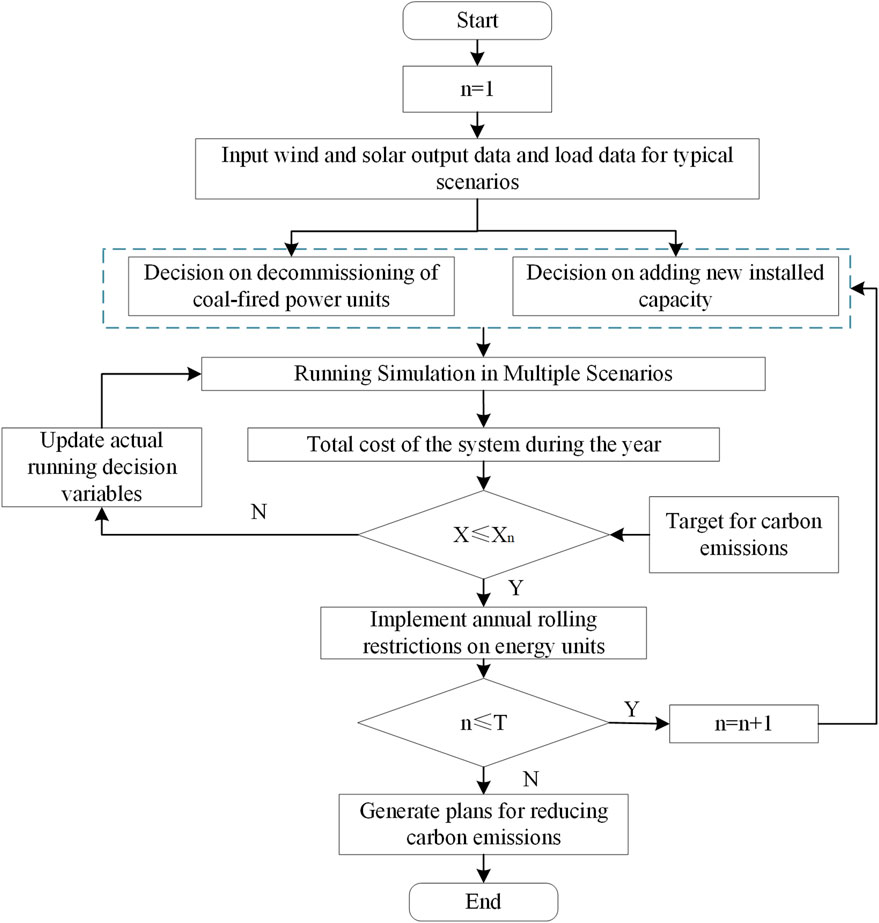
FIGURE 3. Solution process based on the electric-thermal coupling system model.
5 Case study
5.1 Case description
This paper validates the planning model using an improved IEEE-39 bus power system (Gu et al., 2015). The selected planning horizon spans 15 years, divided into three phases within 5-year intervals. At the initial planning stage, the installed capacity of power supply units in the system totals 1940MW, and that of the heat supply units is 900 MW, with coal-fired power units capacity of 1000 MW. Considering the remaining lifespan of units and actual carbon emission requirements, the coal-fired power units should be phased out gradually. During the decommissioning decision, units may choose to exit directly or continue operating after renovation. In the first phase, 100 MW of coal-fired power units capacity is scheduled for retirement. In the second phase, 200 MW of coal-fired power units capacity is planned for retirement. In the third phase, 200 MW of coal-fired power units capacity is projected for retirement. By the end of the planning horizon, a total of 500 MW of coal-fired power units capacity is scheduled for retirement, accounting for 50% of the total coal-fired power units capacity.
The investment cost, maintenance cost, and operating cost of various types of units in the system are shown in Table 1. For wind turbines and photovoltaic units, only penalty costs for power abandonment are considered. In addition, the penalty cost coefficient for load shedding set by the system is 24,000 CNY/(MWh), the carbon tax price is 48 CNY/ton, and it increases at an annual growth rate of 20%. The annual growth rate of electricity and heat loads is 4.5%, and the annual discount rate is 8%.
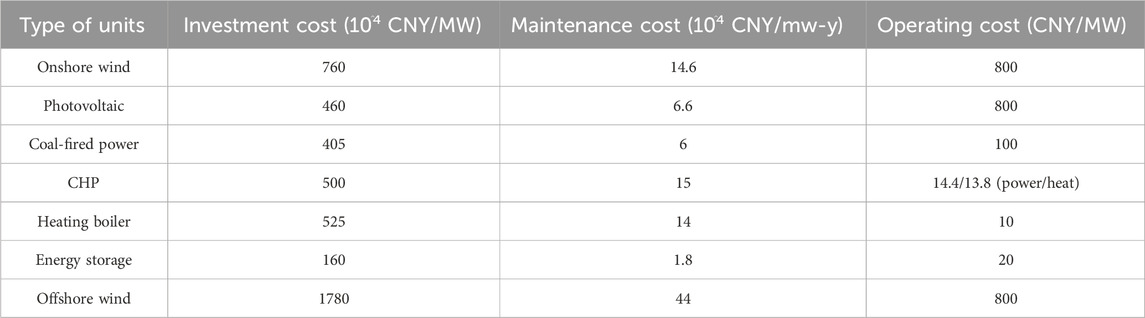
TABLE 1. Parameters setting of case study.
The new energy output has strong seasonal characteristics. The planning year is divided into four seasons: spring, summer, autumn, and winter. The binary K-means clustering algorithm is used to cluster the new energy output, electric load and heat load of each season in each stage. Typical daily data is selected as the basic data input to solve the above planning model.
To validate the planning model considering carbon emission factors in this paper, four scenarios have been established for comparative analysis.
Scenario 1: The planning model does not consider carbon emission constraints or carbon tax.
Scenario 2: The planning model does not consider carbon emission constraints but considers carbon tax.
Scenario 3: The planning model does not consider carbon tax but considers carbon emission constraints.
Scenario 4: The planning model considers both carbon tax and carbon emission constraints.
5.2 Simulation results and analysis
1) Capacity allocation and economic analysis
In the aforementioned four scenarios, this paper conducts numerical simulations and solutions, analyzing the capacity allocation and the economic feasibility of the system individually.
The planning results of the fuel-based units are presented in Table 2. Scenario 4, verified by this model, involves coal-fired power units capacity of 500 MW constrained by carbon emissions. In Scenario 4, the planned retirement of coal-fired power units occurs as scheduled without choosing the option for renovation and continued operation. For Scenario 4, the installed capacity of CHP units reaches 1,334.17MW, with heating boilers capacity of 591.17 MW. In Scenario 1, orderly retirements of coal-fired power units occur in the first two phases. In the third phase, to meet the actual demands of both electric and heat loads, the coal-fired power units’ installed capacity is expanded to 999.05 MW. Simultaneously, the installed capacities of CHP units and heating boilers reach 1,341.09 and 455.12 MW, respectively. Scenarios 2 and 3 are affected by carbon emission constraints, resulting in the timely retirement of coal-fired power units, with CHP unit and heating boiler capacities similar to Scenario 4. In summary, carbon emission constraints drive the system toward cleaner and lower carbon operations, prompting the scheduled retirement of coal-fired power units. However, the large-scale retirement of these units may lead to insufficient system flexibility. The planning proposal addresses this by expanding CHP units and heating boilers to increase adjustment capabilities on the heat source side, thereby alleviating the adjustment pressure on the power system.
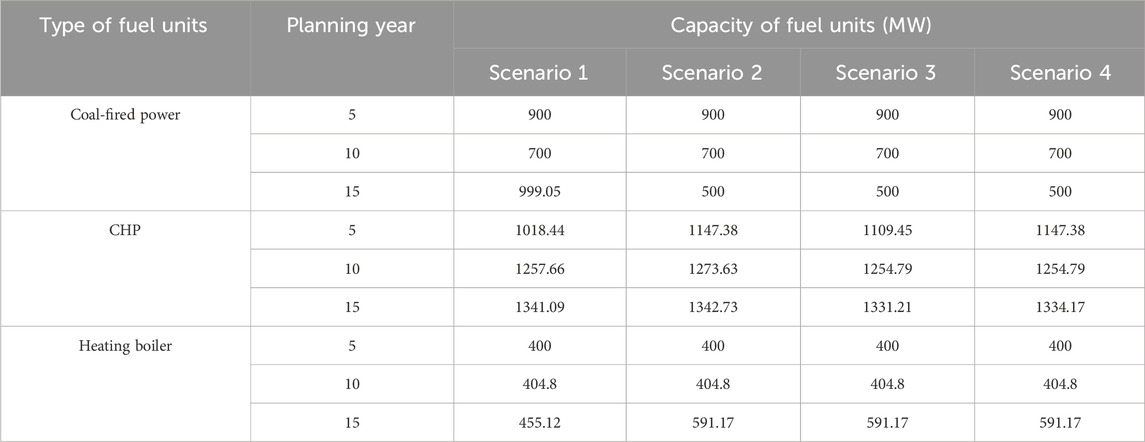
TABLE 2. Fuel units planning results for each scenario.
The installed capacities of wind power and photovoltaic units are shown in Table 3, and the planning results for energy storage capacities are presented in Table 4. The comparative economic costs across different scenarios are illustrated in Table 5. In Scenario 1, the installed capacity of new energy units remains at its original level, while the energy storage capacity is set at 451.19 MW to alleviate potential inadequacies in the system’s flexibility in later planning stages. Scenario 2 demonstrates a rise in the installed capacity of new energy units to 1,812.53 MW and an energy storage capacity of 604.08 MW. The limitations imposed by the carbon tax lead to increased operational costs for coal-fired power units, resulting in a substantial influx of new energy units. However, due to the stochastic and fluctuating nature of new energy sources, the system faces insufficient reserve capacity, necessitating further expansion in energy storage capacity. In Scenario 3, the installed capacity of new energy units reaches 1,863.72 MW, accompanied by an energy storage capacity of 604.88 MW, resulting in a total cost of 213,902 million CNY. Adhering to predefined standards for annual carbon emissions, there’s a sacrifice of economic efficiency to meet environmental requirements, leading to a cost increase of 19,215.5 million CNY compared to Scenario 1. Scenario 4 displays an installed capacity of new energy units reaching 1,868.79 MW, highlighting the growing trend in new energy unit capacity, as depicted in Figure 4. The planning model considers the evolving cost reduction in offshore wind power installations over time. During the first stage of the planning horizon, the capacity of new energy units remains unchanged due to ample installed capacity. In the second stage, onshore wind power proves more cost-effective than offshore wind power, becoming the preferred choice for new energy unit additions. In the final stage, the integrated cost of offshore wind power installations becomes lower than onshore wind power, making it the most economically viable option among new energy units. Moreover, Scenario 4 features an energy storage capacity of 679.7 MW, slightly increased compared to previous scenarios. These storage facilities contribute to peak shaving, reducing the curtailment of new energy and effectively minimizing carbon emissions during system operations. With a total cost of 299,147.3 million CNY, Scenario 4, having the most stringent carbon emission restrictions, exhibits the highest overall cost among the scenarios. In summary, the low-carbon evolution of the power system inevitably necessitates extensive expansion of new energy and energy storage systems. By judiciously selecting appropriate capacities for new energy and energy storage installations, the power system can economically develop while meeting load demands and ensuring operational stability.

TABLE 3. New energy planning results for each scenario.
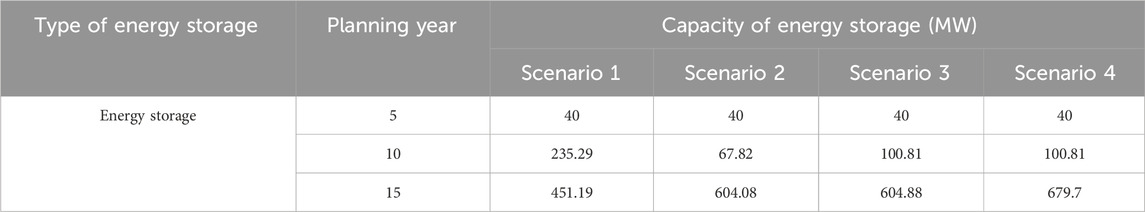
TABLE 4. Energy storage planning results for each scenario.
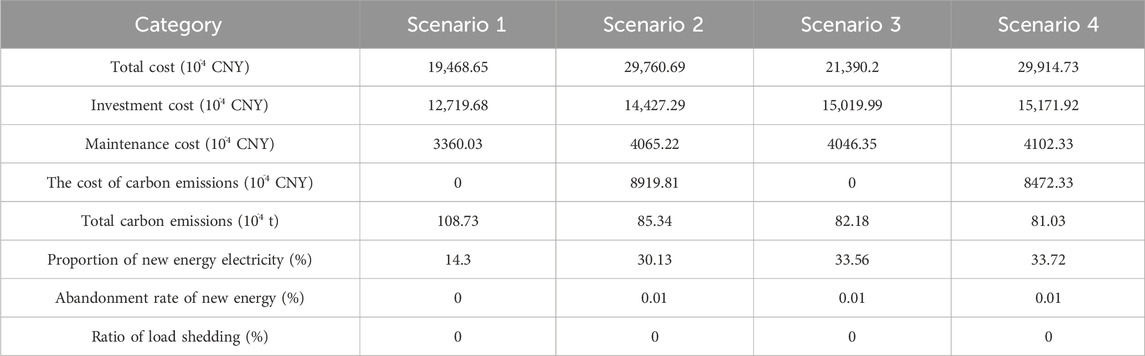
TABLE 5. Economic cost analysis for each scenario.
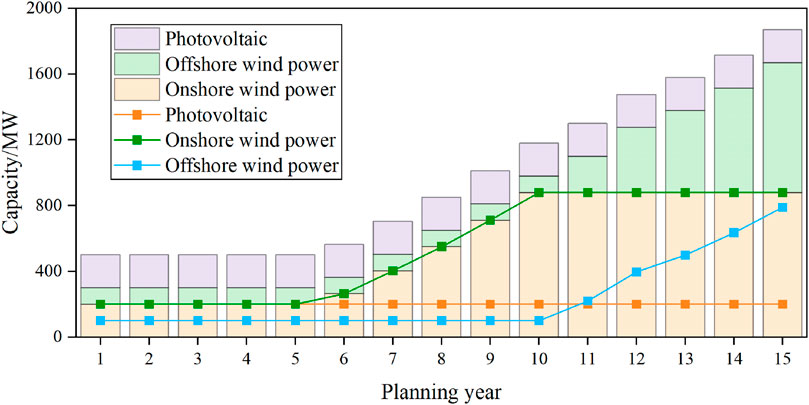
FIGURE 4. New energy capacity installation situation.
According to the simulation examples in four scenarios, the planning results of installed capacity for each type of unit during the planning period are shown in Figure 5.
2) Comparison of carbon emissions
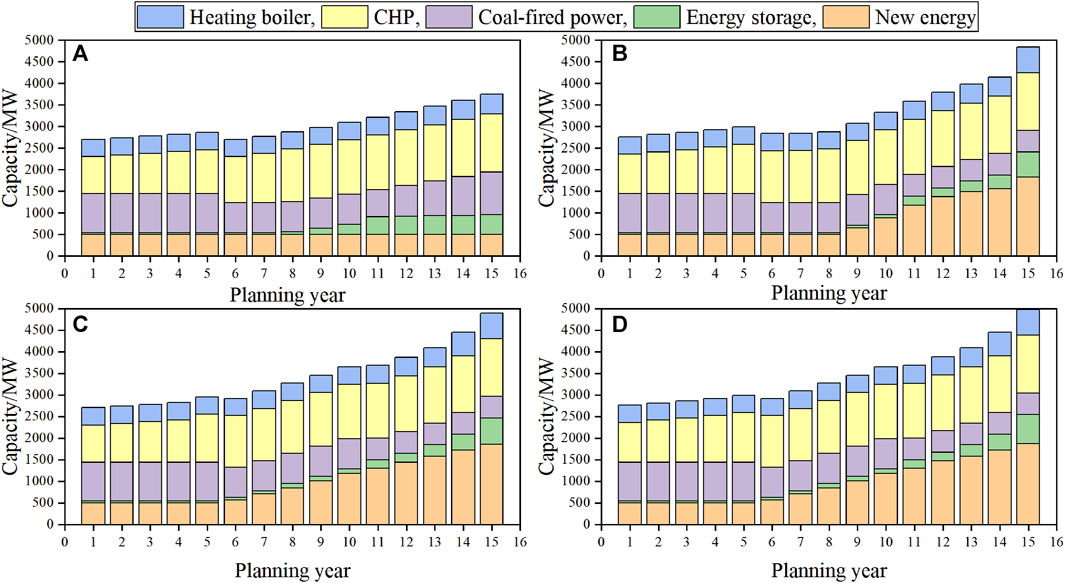
FIGURE 5. Capacity planning results for scenarios 1 to 4.
The carbon emissions for each scenario are illustrated in Figure 6. In Scenario 1, carbon emissions steadily rise year by year, with a total of 1.0873 million tons. Apart from the initial generation from new energy units, the remaining load is powered by fuel-based units. In Scenario 2, constrained by increasing carbon taxes, emissions slightly decrease in the initial phase due to lower carbon taxation costs. However, as carbon taxes surge, additional new energy generation is introduced to mitigate system emissions, resulting in a total of 0.8534 million tons. Scenario 3 abides by a unified standard for carbon emissions. Once the set limit is reached, carbon emissions stabilize, totaling 0.8218 million tons. In Scenario 4, total emissions amount to 0.8103 million tons, marking a reduction of 0.277 million tons compared to Scenario 1, constituting 25.48% of the total emissions in Scenario 1. Scenario 4 features the highest capacities for new energy units and energy storage. The primary power supply comes from new energy and CHP units, while the main heat supply is from CHP units, supplemented by heat supply boilers. In summary, the carbon emission constraints driven by economic incentives and policy regulations effectively enhance carbon reduction. Higher carbon tax prices and lower carbon emission limits lead to more substantial carbon reduction. However, a better carbon reduction performance increases the overall system cost, necessitating higher demands for new energy units and energy storage capacities, consequently elevating the proportion of new energy generation.
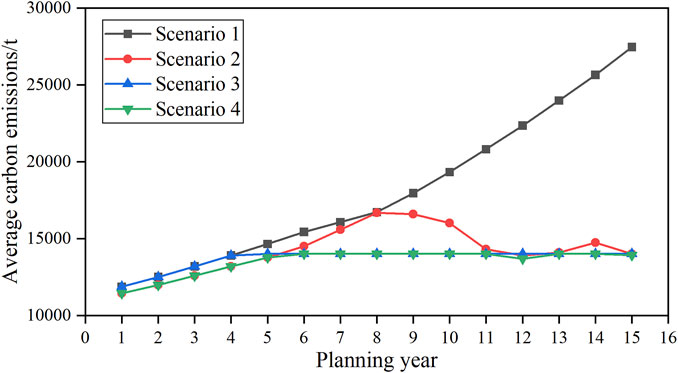
FIGURE 6. Comparison of carbon emissions for each scenario.
5.3 Planning of ERPs
With the advancement of dual carbon targets, the paths to limit carbon emissions to achieve the target during the planning period can be categorized into uniform, front acceleration, and rear acceleration. Front acceleration refers to a relatively rapid increase or decrease in the early stage followed by a slowdown, while rear acceleration indicates a slower increase or decrease in the early stage followed by a faster rate later on. Uniform progression lies between the two, maintaining a steady increase or decrease throughout. Using the carbon emissions from the scenario not considering carbon emission constraints and carbon taxes as the baseline, within three 5-year planning phases, there are options to calculate carbon emission quotas based on the uniform, front acceleration, and rear acceleration paths, generating a total of 27 ERPs, as shown in Figure 7. Under these ERPs, the planning model considering carbon taxes is solved.
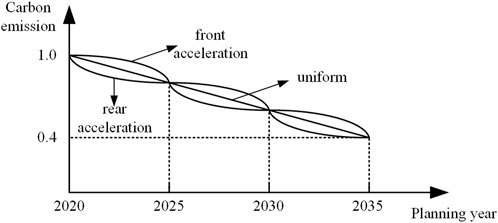
FIGURE 7. Evolution path of carbon emissions.
The economic costs under different ERPs are illustrated in Figure 8. Among these paths, the “Front Acceleration + Front Acceleration + Front Acceleration” trajectory exhibits the highest total cost, totaling 315.895 million CNY. Conversely, the “Rear Acceleration + Rear Acceleration + Rear Acceleration” trajectory reflects the lowest total cost at 306.471 million CNY, indicating a difference of 9.424 million CNY. The comparison of total costs across stages reveals that within the same phase, the rear acceleration pathway outperforms the uniform pathway, and the uniform pathway surpasses the front acceleration pathway. This trend is attributed to the higher carbon emission limits, enabling greater optimization scope for the output of various units within the system, resulting in superior optimization outcomes. Additionally, as the construction costs of offshore wind power units decrease over time, choosing to incorporate new offshore wind power units in the later stages of each phase evidently offers better economic viability.
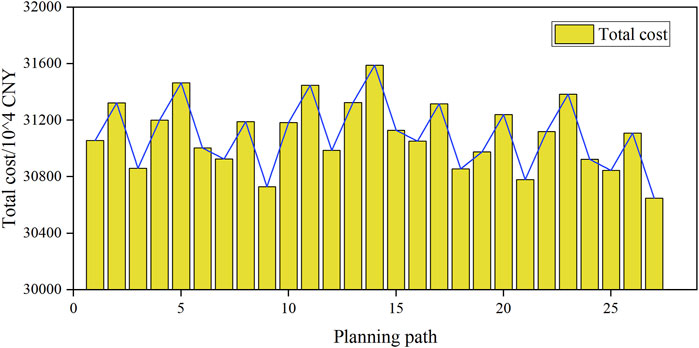
FIGURE 8. Economic costs under various planning paths.
The chosen comparative scenarios are: the “Uniform + Uniform + Uniform” path 1, representing the moderate economic feasibility, the “Front Acceleration + Front Acceleration + Front Acceleration” path 14, signifying the least economic viability, and the “Rear Acceleration + Rear Acceleration + Rear Acceleration” path 27, representing the most optimal economic performance. The planned capacities for new energy sources, energy storage, and the variations in carbon emissions are illustrated in Figure 9. In path 27, the carbon emissions during each phase of the planning period exhibit a rear acceleration trend, corresponding to the carbon emission constraints in this pathway. During this phase, the total carbon emissions amount to 722,600 tons. In contrast, in path 1 and path 14, the total carbon emissions amount to 690,800 and 660,300 tons, respectively. Notably, in the pathway showcasing the most optimal economic performance, the system exhibits relatively higher carbon emissions throughout the planning period. Furthermore, from an overall perspective, the trend in carbon emissions corresponds to the variations in new energy and energy storage capacities. Specifically, when selecting the rear acceleration pathway for carbon emission constraints, the capacities for new energy units and energy storage also follow the rear acceleration pathway.
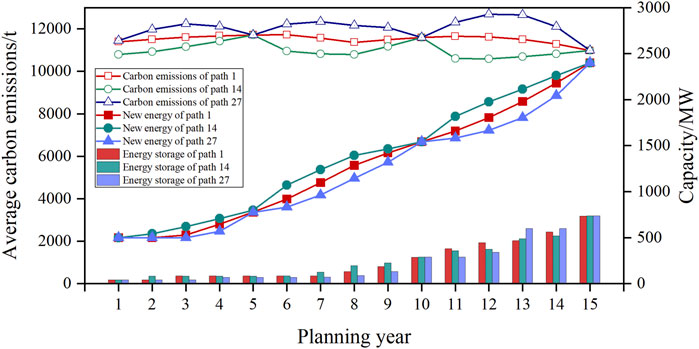
FIGURE 9. Capacity allocation and carbon emissions under various planning paths.
6 Conclusion
The carbon factor is the core driving force behind the low-carbon transformation of the power system. The study of ERPs has become a key issue for the New-type Power System to achieve clean and low-carbon goals. This paper establishes a multi-scenario planning model within a long cycle planning framework. The model accounts for electric-thermal coupling and the decommissioning of coal-fired power units, providing insights into the developmental scale and trends of electric-thermal coupled systems under carbon reduction objectives. Additionally, the paper addresses the impact of ERPs on economic feasibility. Within the set of candidate ERPs, the paper identifies the most economically optimal ERP along with the developmental scale and trends of the system. The proposed model’s validity is verified using an improved IEEE-39 bus power system as the basis for the case study.
The case study results demonstrate that both economic incentives and policy-driven carbon emission constraints effectively enhance carbon reduction efforts. The optimal carbon emissions can be reduced by 277,000 tons, accounting for 25.48% of the total carbon emissions. Higher carbon tax prices and lower carbon emission limits will further enhance the system’s carbon reduction efficiency. Additionally, within the selected ERPs, the rear acceleration pathway demonstrates the best economic viability, reducing the total cost by 9.424 million CNY compared to the front acceleration pathway. Under the rear acceleration’s ERP, the initially high carbon dioxide limits do not urgently necessitate the expansion of new energy unit capacities. Instead, the approach opts to incorporate additional new energy installation capacity when the unit construction costs are lower in later stages. The final approach balances the objectives of carbon reduction and system economic feasibility.
Furthermore, in optimizing long cycle ERPs, this study overlooked the impact of carbon emissions on both the grid side and load side. Considering a planning method for ERPs that incorporates coordinated planning between sources, grid, and loads will be a future research direction.
Data availability statement
The original contributions presented in the study are included in the article/supplementary material, further inquiries can be directed to the corresponding author.
Author contributions
XM: Writing–original draft. LZ: Writing–review and editing. BC: Writing–review and editing. XT: Writing–review and editing. LW: Writing–original draft. NL: Writing–review and editing.
Funding
The author(s) declare financial support was received for the research, authorship, and/or publication of this article. This work is sponsored by the Science and Technology Project of State Grid Shandong Electric Power Company, Grant/Award Number: 52062522000P.
Conflict of interest
Authors XM, LZ, BC, and XT were employed by Economic and Technology Research Institute of State Grid Shandong Electric Power Company.
The remaining authors declare that the research was conducted in the absence of any commercial or financial relationships that could be construed as a potential conflict of interest.
Publisher’s note
All claims expressed in this article are solely those of the authors and do not necessarily represent those of their affiliated organizations, or those of the publisher, the editors and the reviewers. Any product that may be evaluated in this article, or claim that may be made by its manufacturer, is not guaranteed or endorsed by the publisher.
References
Alshammari, N., Samy, M. M., and Asumadu, J. (2018). “Optimal economic analysis study for renewable energy systems to electrify remote region in kingdom of Saudi arabia,” in 2018 Twentieth International Middle East Power Systems Conference (MEPCON), Cairo, Egypt, December, 2018. doi:10.1109/MEPCON.2018.8635287
Barakat, S., Samy, M. M., Eteiba, M. B., and Wahba, W. I. (2016). “Viability study of grid connected PV/Wind/Biomass hybrid energy system for a small village in Egypt,” in 2016 Eighteenth International Middle East Power Systems Conference (MEPCON), Cairo, Egypt, December, 2016. doi:10.1109/MEPCON.2016.7836870
Chen, Q. X., Kang, C. Q., Xia, Q., Zhou, Y. C., Yokoyama, R., et al. (2009). Key low-carbon factors in the evolution of power decarbonisation and their impacts on generation expansion planning. Automation Electr. Power Syst. 33 (15), 18–23. doi:10.3321/j.issn:1000-1026.2009.15.004
Cui, Q., Bai, X., and Dong, W. (2019). Collaborative planning of distributed wind power generation and distribution network with large-scale heat pumps. CSEE J. Power Energy Syst. 5 (3), 335–347. doi:10.17775/CSEEJPES.2019.00140
Ding, Z., Hou, H., Duan, L. Q., Frate, G. F., Zhang, N., Desideri, U., et al. (2021). Study on the capacity-operation collaborative optimization for multi-source complementary cogeneration system. Energy Convers. Manag. 2021, 250, 114920. doi:10.1016/j.enconman.2021.114920
Du, X. (2023). Thoughts on strategies and paths to achieve carbon peaking and carbon neutrality in China. Front. Energy 17 (3), 324–331. doi:10.1007/s11708-023-0883-7
Du, Y., Xue, Y., Wu, W., Shahidehpour, M., Shen, X., Wang, B., et al. (2023). Coordinated planning of integrated electric and heating system considering the optimal reconfiguration of district heating network. IEEE Trans. Power Syst., 1–14. doi:10.1109/TPWRS.2023.3242652
Gu, Z. P., Kang, C. Q., Chen, X. Y., Bai, J. H., Cheng, L., et al. (2015). Operation optimization of integrated power and heat energy systems and the benefit on wind power accommodation considering heating network constraints. Proc. CSEE 35 (14), 3596–3604. doi:10.13334/j.0258-8013.pcsee.2015.14.014
Huang, B. B., Xie, M., Lin, S. Z., He, R. Q., Cheng, P. J., et al. (2023). Research on collaborative optimization planning method of power supply under the background of new-type power system. Electr. Autom. 45 (01), 54–58. doi:10.3969/j.issn.1000-3886.2023.01.015
Li, X., Wu, X., Gui, D., Hua, Y. W., Guo, P. F., et al. (2021). Power system planning based on CSP-CHP system to integrate variable renewable energy. Energy, 232, 121064. doi:10.1016/j.energy.2021.121064
Liu, B., Liu, L., and Sun, T. (2021). “Influence of power-to-heat installations on wind power consumption in regional energy system,” in proceedings of the 2021 China International Conference on Electricity Distribution (CICED), Shanghai, China, April, 2021. doi:10.1109/CICED50259.2021.9556770
Liu, D., Zhang, S., Cheng, H., et al. (2022a). Accommodating uncertain wind power investment and coal-fired unit retirement by robust energy storage system planning. CSEE J. Power Energy Syst. 8 (5), 1398–1407. doi:10.17775/CSEEJPES.2019.01890
Liu, Y. K., Zhang, W. J., Zhang, Y., Hou, M. X., et al. (2022b). Joint planning method of renewable energy and energy storage for new-type power system. Smart Power 50 (10), 1–8. doi:10.3969/j.issn.1673-7598.2022.10.002
Luo, Q. Y., Mao, Z. J., Zhao, Q. H., Gong, S. R., Zhao, H. F., You, H. J., et al. (2023). “China's energy evolving approach to carbon peaking by 2030 based on 23 provincial carbon peaking implementation programs,” in Proceedings of the 2023 Panda Forum on Power and Energy (PandaFPE), Chengdu, China, April, 2023. doi:10.1109/PandaFPE57779.2023.10140229
Qiao, M. A. S. W., Yan, F. U., Wenlong, ZHOU, Mingwei, S. H. I., Xueting, PENG, Haodong, L. V., et al. (2023). China’s policy framework for carbon capture, utilization and storage: review, analysis, and outlook. Front. Energy 17 (3), 400–411. doi:10.1007/s11708-023-0862-z
Rawa, M., Alkubaisy, Z. M., Alghamdi, S., Refaat, M. M., Ali, Z. M., and Aleem, S. H. A. (2022). A techno-economic planning model for integrated generation and transmission expansion in modern power systems with renewables and energy storage using hybrid Runge Kutta-gradient-based optimization algorithm. Energy Rep. 8, 6457–6479. doi:10.1016/j.egyr.2022.04.066
Samy, M. M., Sarhan, H. H., Barakat, S., and Al-Ghamdi, S. A. (2018). “A hybrid PV-biomass generation based micro-grid for the irrigation system of a major land reclamation Project in kingdom of Saudi arabia (KSA) - case study of albaha area,” in 2018 IEEE International Conference on Environment and Electrical Engineering and 2018 IEEE Industrial and Commercial Power Systems Europe (EEEIC/I&CPS Europe), Palermo, Italy, June, 2018. doi:10.1109/EEEIC.2018.8494543
Shi, W., Luo, K., Li, Q., He, Y., Wang, W., and Wang, W. (2022). Grid-integration and operation of HighProportioned new energy. Strategic Study Chin. Acad. Eng. 24 (6), 52–63. doi:10.15302/j-sscae-2022.07.006
Tongming Liu, W. Z., Jia, Y., Zhao, Y.DONG, and Dong, Z. Y. (2022). Optimal operation of integrated energy system including power thermal and gas subsystems. Front. Energy 16 (1), 105–120. doi:10.1007/s11708-022-0814-z
Weidou Ni, Z. C., and Chen, Z. (2021). Synergistic utilization of coal and other energy – key to low carbon economy. Front. Energy 5, 1–19. doi:10.1007/s11708-010-0136-4
Xinyu Chen, Y. L., Mcelroy, M., and Mcelroy, M. (2022). Transition towards carbon-neutral electrical systems for China: challenges and perspectives. Front. Energy 9 (3), 504–508. doi:10.1007/s42524-022-0220-6
Yuan, Y., and Shang, C. (2021). “Planning of renewable sources and energy storages and retirement of coal plants with unit commitment reserving operational flexibility,” in proceedings of the 2021 IEEE Sustainable Power and Energy Conference (iSPEC), Nanjing, China, December, 2021. doi:10.1109/iSPEC53008.2021.9735749
Keywords: dual carbon targets, carbon emissions, electric-thermal coupling, path optimization, decommissioning of coal-fired power units
Citation: Meng X, Zhao L, Chen B, Tian X, Wang L and Liu N (2024) Optimization of long cycle emission reduction paths for new-type power system considering electric-thermal coupling. Front. Energy Res. 12:1338161. doi: 10.3389/fenrg.2024.1338161
Received: 14 November 2023; Accepted: 15 January 2024;
Published: 02 February 2024.
Edited by:
Chaojie Li, University of New South Wales, AustraliaReviewed by:
Mohamed Samy, Beni-Suef University, EgyptManeesh Kumar, Indian Institute of Technology Roorkee, India
Copyright © 2024 Meng, Zhao, Chen, Tian, Wang and Liu. This is an open-access article distributed under the terms of the Creative Commons Attribution License (CC BY). The use, distribution or reproduction in other forums is permitted, provided the original author(s) and the copyright owner(s) are credited and that the original publication in this journal is cited, in accordance with accepted academic practice. No use, distribution or reproduction is permitted which does not comply with these terms.
*Correspondence: Xiangfei Meng, MzE2MzI3MTkyQHFxLmNvbQ==