 Belqasem Aljafari1
 Praveen Kumar Balachandran2*
 Devakirubakaran Samithas3,4*
 Sudhakar Babu Thanikanti5
 Nnamdi I. Nwulu6
- 1Department of Electrical Engineering, College of Engineering, Najran University, Najran, Saudi Arabia
- 2Department of Electrical and Electronics Engineering, Vardhaman College of Engineering, Hyderabad, India
- 3Center for Electric Mobility, Department of Electrical and Electronics Engineering, SRM Institute of Science and Technology, Chennai, Tamil Nadu, India
- 4Center for Nonlinear Systems, Chennai Institute of Technology, Chennai, India
- 5Department of Electrical and Electronics Engineering, Chaitanya Bharathi Institute of Technology, Hyderabad, India
- 6Center for Cyber Physical Food, Energy and Water Systems, University of Johannesburg, Johannesburg, South Africa
The world depends heavily on electrical energy for accessing technologies. For the generation of electricity, technology can utilize renewable energy sources like solar energy and wind energy. Solar photovoltaic (PV) systems occupy space among consumers due to their feasibility, flexibility, cost, and simple implementation procedures. The solar PV system experiences many factors causing power loss like partial shading, hotspots, and diode failure. In this work, a new static PV array configuration, named Renzoku puzzle pattern-based array configuration, is proposed. This proposed configuration technique was designed to overcome the drawbacks of the previously proposed array configurations in terms of power generation, fewer mismatch losses, a high shade-dispersion rate, and consistent performance under any level of partial shading. The proposed array configuration has been validated using both simulation and hardware. The simulation is carried out in a 9 × 9 PV array in MATLAB/Simulink®. The performance analysis, results, and corresponding characteristic curves are presented in this manuscript.
1 Introduction
Due to fossil fuel depletion and the global shift to low-carbon energy, distributed renewable energy generation has increased over the past decade (Viebahn et al., 2015; Bryant et al., 2024). In 2021, China’s National Energy Administration reported 107.5 GW of distributed solar energy generation infrastructure, an increase of 29 GW from 2020 (Wang et al., 2024). Distributed PV solar power generation is becoming more important in green energy (Yang et al., 2020).
Despite their importance, distributed photovoltaic (PV) systems face technical challenges, especially array mismatch losses. These losses occur when the PV module current–voltage (I–V) characteristics vary within an array. Connecting PV modules in series can limit current to the lowest-current module, causing mismatch losses that reduce PV array power generation. Mismatch losses introduce multiple power–voltage (P–V) peaks, complicating maximum power point tracking (Lappalainen and Valkealahti, 2017).
In order to ensure dependable operation and maximize power generation, monitoring a PV system is essential (Alwar et al., 2022). This monitoring also enables performance evaluation and troubleshooting (Aghaei et al., 2020). For the purpose of this study, field sensors were utilized to perform real-time measurements of the voltage and current of PV modules. Maximizing power generation under mismatched loss conditions is the goal of the dynamic topology optimization that has been proposed (Devakirubakaran et al., 2023). This optimization will influence the awareness of PV system generation systems.
The reconfiguration of PV arrays is an efficient method for preventing mismatch losses in total-cross-tied (TCT) and series–parallel (SP) topologies when mismatch conditions (MCs) are present (Mohammadnejad et al., 2016; Pendem and Mikkili, 2018; Sagar et al., 2020; Ye et al., 2023). This strategy involves modifying the interconnections between PV modules in accordance with the levels of irradiance, with the goals of lowering mismatch losses and improving the performance of the PV systems. In the TCT topology, photovoltaic modules are connected in parallel and series rows, whereas in the SP topology, PV modules are connected in series and PV strings are connected in parallel. These strategies included both physical relocation and electrical array reconfiguration.
In order to physically relocate photovoltaic modules, it is necessary to move them without affecting their electrical connections (Srinivasan et al., 2020). For the purpose of distributing shading effects across the PV array, a pattern that can be reconfigured is utilized during the installation process (Prince Winston et al., 2020a; Prince Winston et al., 2020b). When it comes to physical relocation reconfiguration, the Sudoku puzzle method is a well-known approach that has been demonstrated in references. Through the process of rearranging modules, this technique enhances the generation of power in partially shaded, 9 × 9 TCT-interconnected photovoltaic arrays. It is important to note that the effectiveness of the Sudoku-based reconfiguration is limited because it can only move PV modules in columns and not rows. Other puzzle-based methods, such as Futoshiki and Magic Square, are capable of exhibiting limitations that are comparable to these. On the other hand, a dominance square-based array reconfiguration scheme (Dhanalakshmi and Rajasekar, 2018a; Dhanalakshmi and Rajasekar, 2018b) was proposed in the reference for a 5 × 5 TCT topology. This scheme offers a novel approach in comparison to different solutions that have been proposed in the past. Additionally, the Calcudoku method (Aljafari et al., 2023) and competence square arrangement method (Dhanalakshmi and Rajasekar, 2018a), spiral pattern-based configuration (Cherukuri et al., 2021), and L-shaped propagated array configuration (Srinivasan et al., 2021), as demonstrated in reference, outperformed the dominance square solution. Another innovative approach that was proposed in the reference involves the arrangement of photovoltaic arrays numerically and alphabetically in order to reduce shading effects and distribute shadow patterns.
Reconfigurations that are based on physical relocation, such as Sudoku, Competence Square, and Dominance Square, have their limitations. They require modules to be arranged in rows and columns that are equal, which may not be possible given the actual layout of the PV array. In addition, photovoltaic modules undergo non-uniform aging, which results in a gradual decrease in power generation over time. It is necessary to perform periodic physical reconfigurations as a result of this, which results in high labor costs. These methods lack the flexibility to address the impact of multiple partial shadows and random module defects on PV arrays.
On the other hand, environmental or electric parameter-based array reconfiguration (EAR) strategies make use of switches in order to alter the electrical connection of the photovoltaic array. Through the utilization of global EAR strategies such as particle swarm optimization and genetic algorithms, every module is able to switch electrical connections, thereby increasing the amount of power that is produced (Babu et al., 2018; Durango-Flórez et al., 2022). These techniques, on the other hand, call for a greater number of switches and more complex control algorithms, which drive up the costs. Local reconfiguration, which makes use of a switching matrix to connect adaptive modules with different electrical connections to fixed modules, has the potential to reduce the number of switches; however, it may not be effective in areas with large shadows or in situations where fixed modules have shadows. The uncertain power generation affects the stability of the grid, which also requires power management algorithms (Prasad et al., 2022).
To summarize, physical relocation is a simple option that does not necessitate the utilization of switches or sensors. However, due to the uneven aging of PV modules, it necessitates repeated efforts. When it is functioning under MCs, its effectiveness is hindered by a number of issues, such as the presence of various shadows, the presence of non-uniform aging, and the failure of modules (Thanikanti et al., 2023). Even in the presence of significant shading, its utility is limited because of these concerns. It is necessary to conduct additional studies into the EAR technique in order to reduce the number of switches that are utilized and improve the efficiency of power generation under the majority of mechanical configurations.
The contribution of this work to the field is the development of a novel array configuration approach that is inspired by the concept of the Renzoku puzzle pattern. The term “Renzoku” comes from the Japanese phrase “to the neighbors,” and this pattern is similar to puzzles such as Futoshiki, in which the number that is closest to the player is selected to be the surrounding shell. Using this method, the array layout chooses the photovoltaic modules that are closest to each other and have optimal spacing between them, much like solving a square puzzle. Certain rules define the pattern of the Renzoku puzzle, which are as follows:
• The numbers range from one to the size of the grid; for example, for a 9 × 9 puzzle, the numbers run from one to nine.
• Only one instance of any number can be found in each row and in any given column.
• In the event that there is a dot between two cells, it signifies that the numbers included within those cells should be consecutive; otherwise, they should not be sequential.
• After numeral 9, letters such as A, B, and C are utilized for more complex puzzles.
The array layout approach that has been developed optimizes the arrangement of photovoltaic modules by applying these guidelines. This ensures that space is utilized effectively and improves the overall performance of the photovoltaic system. This novel methodology provides a strategy that is both systematic and structured for array setup, which makes it possible to improve power generation in a variety of applications.
The remainder of this research article is arranged as follows: Section 2 describes the proposed methodology; Section 3 presents the performance analysis of the proposed array configuration, including power output, efficiency, and the percentage of mismatch loss generation; and finally, Section 4 concludes the research article.
1.1 Proposed Renzoku PV array configuration
The amount of photovoltaic power generated is directly proportional to the amount of direct sunlight that reaches the panel surface. The direction of the sunlight, or the number of photons striking the PV surface, determines the number of free electrons released from the PV cell. Eq. 1 provides a PV cell current output equation (Nguyen and Nguyen, 2015; Ma et al., 2019). When several cells or modules are linked in series, Eq. 2 indicates the current output.
The voltage is added in series and the current is added in parallel on the different connections of PV cells connected as an array.
When multiple cells are connected in series and a single PV module is affected by the partial shading, it alone operates with the minimum current. This current will be available at the output terminal as per Equation 2. The entire row’s current will be reduced due to the shaded panel.
The proposed array configuration is framed based on the Renzoku puzzle pattern. Renzoku means “to the neighbors,” whereas this puzzling pattern is like Futoshiki, and the rule chooses the nearest number as the neighbor shell. So, this form of array configuration selects the nearest PV modules with the optimum distance. This puzzling pattern can be applied to any kind of square puzzle. The Renzoku puzzle has certain rules, as follows:
• The numbers range from one to the size of the grid; for example, one to nine for a 9 × 9 puzzle.
• Each number must appear just once in each row and column.
• A dot between two cells signifies that the numbers in those cells should be sequential. The numerals should not be sequential if there is no dot.
• For larger problems, the letters (A, B, C, and so on) come after the digit 9.
In this work, a 9 × 9 PV array has been selected for testing and analyzing the proposed Renzoku puzzle pattern-based PV array configuration. An unsolved 9 × 9 Renzoku puzzle is shown in Figure 1A. Only eight squares among the ninety-one squares had the values, and the values of other squares needed to be obtained by solving the puzzle. The only clue for solving the puzzles is to follow the dots placed between the squares. In this puzzle, the square at the position of the second row and sixth column has a value of 3, surrounded by dots. These dots indicate the neighboring cells, i.e., 27 and 25 should be 2 or 4. By following these dots, the entire puzzle can be solved. Figure 1B shows the solved 9 × 9 Renzoku puzzle. The puzzle should be solved based on the dots and the rules of Renzoku puzzles. The array formation on the Renzoku puzzle can be done by adding a number ranging from 1 to the size of the grid in each column. Figure 2 shows the final matrix diagram of the 9 × 9 PV array. The proposed array configuration has been validated using the MATLAB/Simulink® model. The performance of the proposed array configuration has been compared with the conventional array configurations.
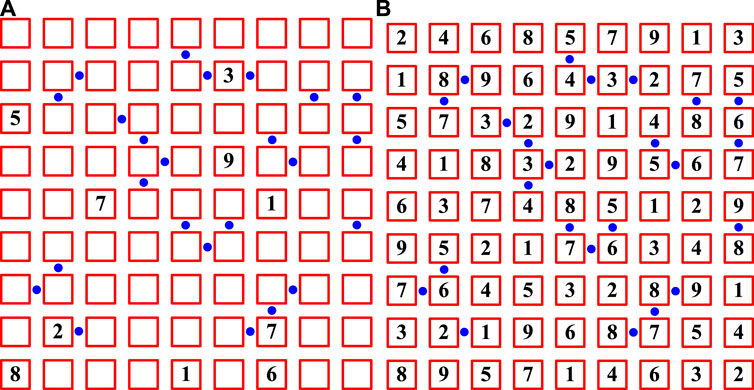
FIGURE 1. (A) 9 × 9 Renzoku puzzle; (B) solved 9 × 9 Renzoku puzzle.
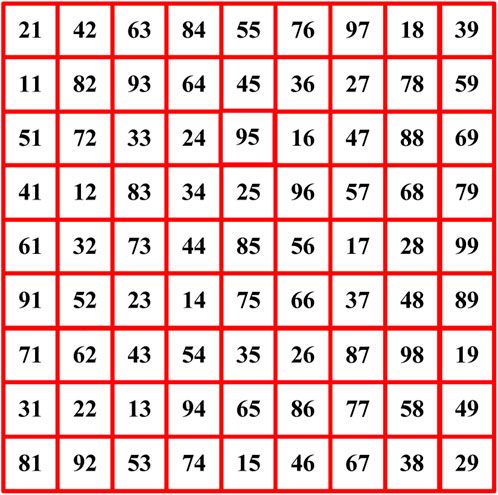
FIGURE 2. Matrix diagram of the 9 × 9 PV array from the Renzoku puzzle pattern.
The Renzoku puzzle pattern-based configuration can be defined by the following steps:
• Define the grid size: determine the size of the grid based on the number of PV modules that are available or planned to be installed. For example, a 9 × 9 grid will have 81 PV modules.
• Assign numbers to PV modules: assign numbers to each PV module in the grid, starting from 1 and ranging up to the size of the grid. For a 9 × 9 grid, the numbers will range from 1 to 81.
• Ensure unique numbers: ensure that each number appears only once in each row and column of the grid. This ensures that each PV module is uniquely identified within the array.
• Sequential numbers: place a dot between two cells to indicate that the numbers in those cells should be sequential. This helps in arranging the PV modules in a sequential order, optimizing the distance between them.
• Arrange PV modules: arrange the PV modules in the grid according to the Renzoku puzzle pattern. Start with the nearest number as the neighbor shell, ensuring that the distance between neighboring PV modules is optimal.
• Extend to larger problems: for larger PV arrays, use letters (A, B, C, and so on) after the digit 9 to continue the numbering sequence. Ensure that each letter is used only once in each row and column, similar to the numbering scheme for smaller grids.
• Iterate for optimization: iterate over the array configuration to optimize the placement of PV modules, ensuring maximum efficiency and power generation.
2 Simulation model and shading patterns
The simulation of the PV cell is performed using the mathematical equation of the single-diode model. Figure 3A illustrates the Simulink model of a single PV cell, depicting specifications such as short circuit current (ISC), open circuit voltage (VOC), maximum output current (IM), maximum output power (PM), temperature (T), and irradiation (S). Figure 3B shows the simulink model of the proposed array configuration with other conventional configurations. The PV cells are interconnected in series and parallel based on the desired configuration. Figure 4B showcases a 9 × 9 PV array with different array configurations, including series–parallel (S-PAC), total cross-tied (TCT-AC), Sudoku puzzle array configuration (SUPAC), L-shaped propagated array configuration (LSPAC), and the proposed Renzoku puzzle pattern array configuration (RPPAC). The interconnections between the PV cells vary depending on the array configuration type. The irradiation block represents the input irradiation value for the PV array. Within this block, the shading pattern is created, and the irradiation is distributed to the PV modules using the Goto blocks in Simulink.
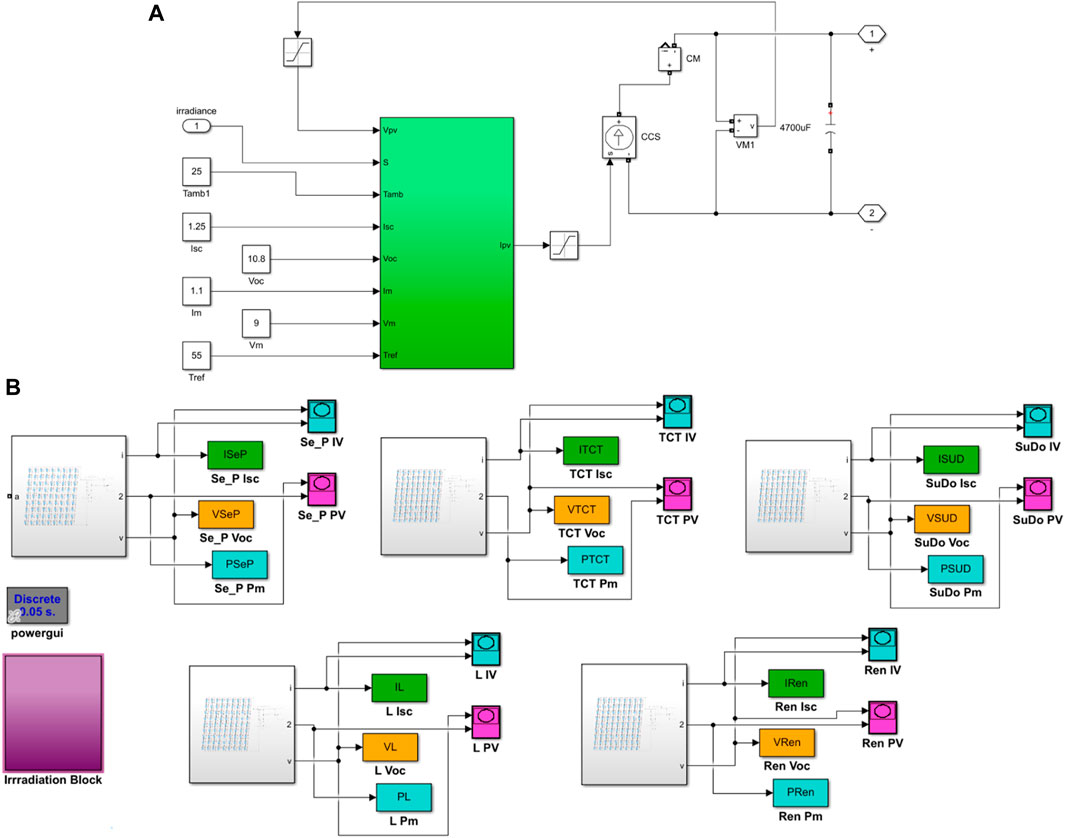
FIGURE 3. (A) Simulink of a single diode model of a PV cell. (B) Simulink model of the proposed array configuration with conventional configurations.
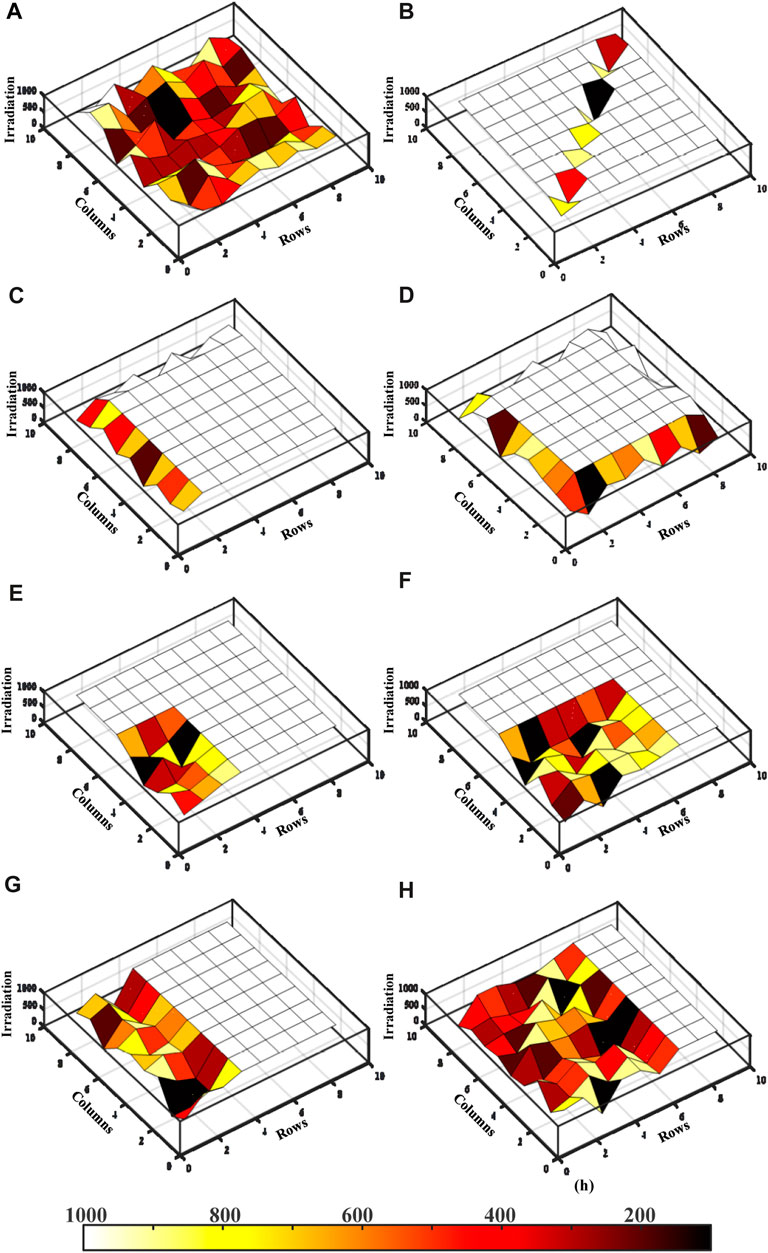
FIGURE 4. (A) Random shading. (B) Diagonal shading. (C) L-shaped shading. (D) Frame shading. (E) Short and narrow shading. (F) Short and wide shading. (G) Long and narrow shading. (H) Long and wide shading.
3 Results and analysis
The proposed Renzoku puzzle pattern array configuration’s performance was evaluated under eight different shading conditions, which are commonly encountered. The shading conditions are depicted in Figure 4. Figure 4A represents random shading, where shading occurs sporadically without any uniform pattern due to temporary objects obstructing sunlight from reaching the PV surface. The extent of shading can vary between 5% and 80%, depending on the type of object causing the shading. Figure 4B illustrates diagonal shading caused by taller and narrower objects positioned near the PV system. This type of shading results in one shaded panel in each row and column, leading to increased mismatch losses due to varying irradiation levels across rows and columns. L-shaped shading conditions are shown in Figure 4C, causing shading in each row and column. This shading pattern significantly impacts the performance of all array configurations, particularly series–parallel and TCT, due to the high shading levels in rows and columns. The Sudoku and L-shaped array configurations can mitigate this issue to some extent. It is essential to assess the performance of the proposed configuration under this shading condition to determine its effectiveness. The frame shading condition, illustrated in Figure 4D, shades all sides of the PV array. Under this shading condition, the series–parallel and TCT configurations exhibit high mismatch losses. On the other hand, the Sudoku, L-shaped, and proposed array configurations demonstrate better resistance to this shading condition and generate higher power output.
The short and narrow shading condition is depicted in Figure 4E, which occurs when nearby buildings, towers, trees, or new infrastructure cast shadows. The shading conditions are further classified based on their length and breadth into short and narrow (SN), short and wide (SW), long and narrow (LN), and long and wide (LW). Figure 4F illustrates the short and wide shading condition, where the breadth of the object causing the shade is greater compared to the short and narrow shading condition. Similarly, Figures 4G, H represent the shading conditions of long and narrow and long and wide conditions, respectively. The LN and LW shading conditions involve objects or shade-causing elements with extended height. The shading levels in these four shading conditions are higher and more complex compared to the other shading conditions discussed previously. Conventional array configurations, such as series–parallel and total cross-tied configurations, experience greater power losses under these eight shading conditions. On the other hand, recently developed PV array configurations like the Sudoku and L-shaped propagated configurations have shown the ability to reduce power losses compared to conventional methods.
In this work, a comprehensive analysis is conducted on the proposed Renzoku array configuration under these eight shading conditions. The performance of the proposed configuration is compared with four other array configurations, and the corresponding data are presented in Table 1. To validate the performance of the proposed array configuration, measurements were taken for short-circuit current, maximum power output, power conversion efficiency, and mismatch loss between PV rows. These metrics serve as indicators of the performance and effectiveness of the proposed configuration.
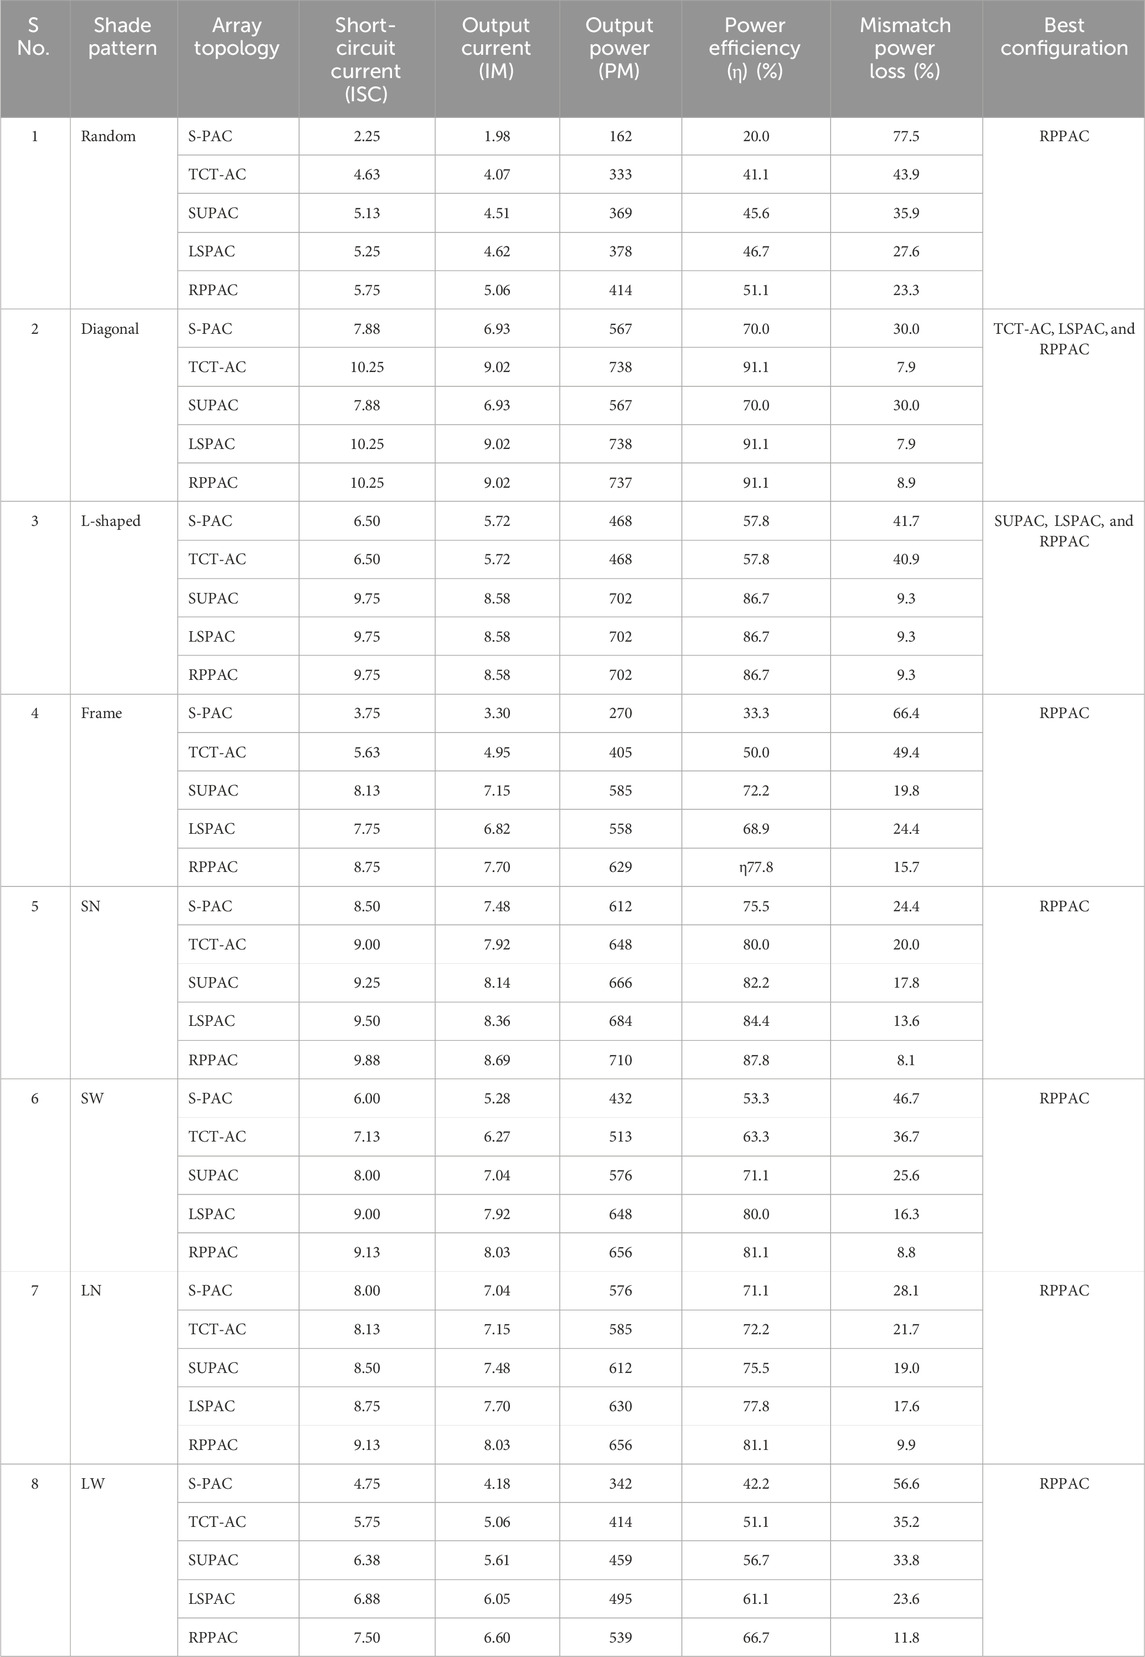
TABLE 1. Performance of the proposed array configurations in different shading types.
The term mismatch loss can be defined as the power difference between the maximum and minimum power-generating PV rows. By measuring the mismatch loss between the PV rows, the shade dispersion level can be measured. The shade dispersion level of the PV array can define the quality of the PV array configuration. If the PV array is operated with the minimum mismatch losses, power generation can be enhanced. In any kind of shading circumstance, the PV array should be operated with the minimum mismatch losses, and the array configuration method that achieves this constraint would be the best PV array configuration.
In the random shading condition, the proposed Renzoku array configuration generates more power compared to the other PV array configurations. It generates 414 W of power, and the mismatch loss is 27.6%. The LSPAC generates an output power of 378 W with a mismatch loss of 27.6%, which is slightly higher than the proposed configuration, and it reflects on the power output. The SUPAC generates the third-highest power generation and is very close to the LSPAC, and the power output is 369 W with 35.9% mismatch losses. The TCT-AC and S-PAC configurations generate minimum power, among other configurations. The results of these configurations under random-type shading conditions are given in Table 1, and the corresponding P–V and I–V characteristic curves are shown in Figure 5.
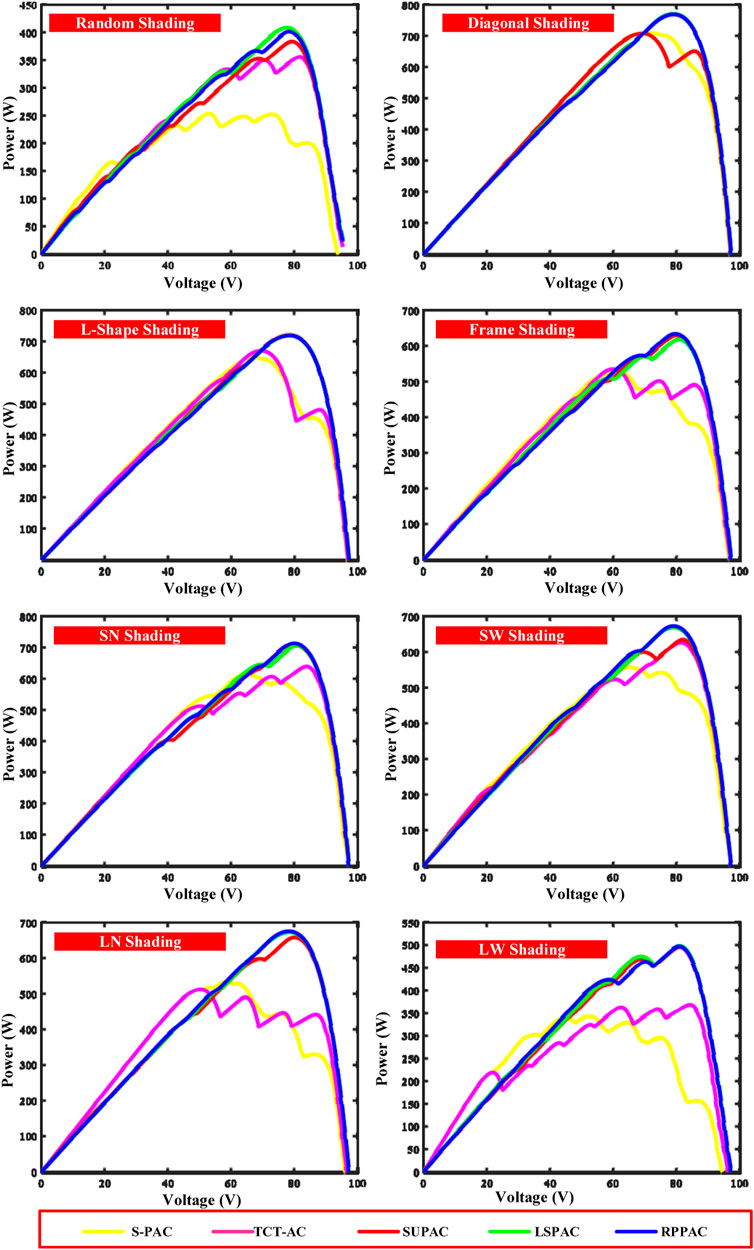
FIGURE 5. P–V characteristic curves.
In the diagonal shading condition, the proposed RPPAC, TCT-AC, and LSPAC configurations perform similarly. The diagonal shading pattern shades only one PV module in one PV row. Therefore, the shade dispersion in the TCT-AC, LSPAC, and proposed RPPAC is almost equal, whereas the SUPAC and S-PAC are highly influenced by this shading pattern due to the shade accumulation on a single row of the SUPAC and shade accumulation on each column of the S-PAC. The P-V and I-V characteristic curves of all PV array configurations are shown in Figure 6.
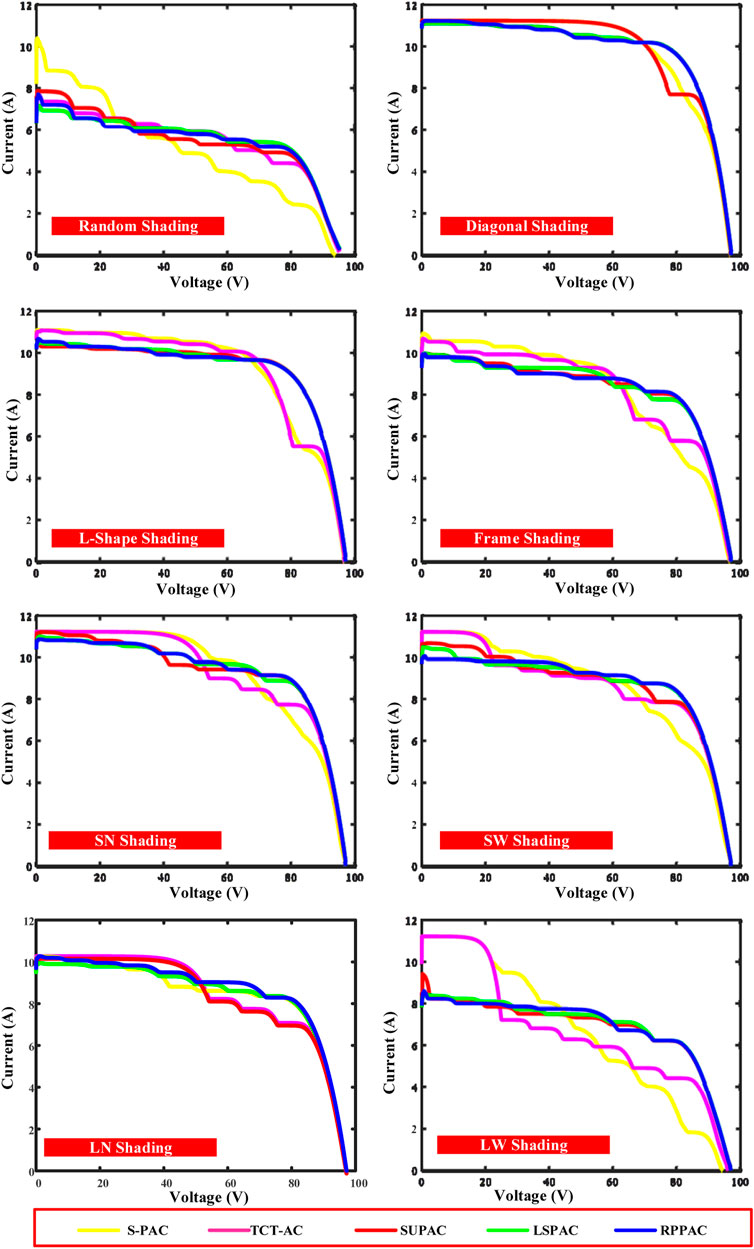
FIGURE 6. I–V characteristic curves.
The L-shaped shading causes more power losses in the TCT-AC method. As the L-shaped shading shades a complete PV row and column, the S-PAC and TCT-AC experiences more power loss. The neighboring PV module in the PV row in TCT-AC is completely shaded, which reduces current generation. This shaded PV row was connected in series with the other PV arrays, which caused more mismatch losses between the PV rows. In S-PAC, one PV module in each column is affected by shading, which results in mismatch losses in each string. So, the S-PAC and TCT-AC will experience more power losses compared with the SUPAC, LSPAC, and proposed RPPAC. The S-PAC and TCT-AC generate a power output of 468 W, with 5.72 A of maximum current output. The SUPAC, LSPAC, and proposed RPPAC configurations generated a power output of 702 W with 8.58 A of maximum current.
The proposed RPPAC outperforms all other existing methods under the frame shading conditions, which are the short and narrow, short and wide, long and narrow, and long and wide shading conditions. As these abovementioned shading conditions vary from moderate to high levels of shading, existing array configurations fail to resist. The proposed array configuration chooses the PV modules for each PV row from the various locations of the conventional PV array so that it can disperse the shading uniformly over the PV array, and the shade dispersion rate is greater than the conventional array configurations. The frame shading shades all corners of the PV array.
In frame shading conditions, the proposed RPPAC configuration generates 629 W of power output with 8.75 A of short circuit current, whereas the other configurations, such as LSPAC, SUPAC, TCT-AC, and S-PAC, generate power outputs of 558 W, 585 W, 405 W, and 270 W, respectively. The SN and LN shading patterns are shades of 25%–40% of the PV panel surface. The S-PAC PV array generates 612 W of power under SN and 576 W of power under LN shading conditions. The SUPAC and LSPAC methods are efficient for minimizing the power loss associated with the SN and LN shading conditions. The TCT-AC has 80% efficiency under SN and 72.2% under LN shading. However, another configuration has similar performance in both of these narrow shading patterns, which can be observed from the mismatch losses. The efficiency of these configurations dropped under N shading conditions. The proposed RPPAC also has a similar kind of mismatch loss as the SUPAC and LSPAC. However, it has 4% greater efficiency than SUPAC and LSPAC. The proposed RPPAC has 710 W power output in SN shading, which is the highest among others, whereas the LSPAC method has the second-highest power output of 684 W. In LN shading, the proposed configuration has the highest power generation of 656 W and the LSPAC has the second-highest generation of 630 W.
Under the SW and LW shading patterns, the proposed RPPAC and LSPAC configurations perform with a smaller deviation, but both of them generate higher output power than other array configurations. The S-PAC has the lowest performance in both SW and LW shadings, which shows poor shade dispersion ability, whereas in TCT, the power generation is enhanced. In SUPAC, the performance has been further enhanced, and in LSPAC, it has the maximum power. However, the proposed RPPAC method has more shade dispersion ability than LSPAC. The LSPAC method generates 648 W in SW shading and 495 W in LW shading. The proposed RPPAC generates 656 W and 539 W of power output under SW and LW shading, respectively. All five array configurations are simulated in MATLAB/Simulink® to analyze and validate the performance of the proposed configuration method, and the corresponding results are given in Table 1; the power(P)–voltage(V) and current(I)–voltage(V) characteristic curves are plotted in Figures 5, 6, respectively.
4 Comparative analysis
According to the literature and the analysis of various PV array configurations, the L-shaped PV array configuration generates maximum power. The LSPAC method disperses the maximum amount of shading, which can be enhanced further using the proposed RPPAC method. This proposed configuration method follows the Renzoku puzzle pattern, which can disperse more shading than the LSPAC. The performance of the S-PAC, TCT-AC, SUPAC, LSPAC, and proposed RPPAC was analyzed using MATLAB/Simulink®. According to the observed results, the proposed RPPAC performed better than the other four configurations. The power output comparison under various shading conditions is shown in Figure 7. In diagonal shading conditions, the TCT-AC, LSPAC, and proposed RPPAC methods generated the maximum output power. In L-shaped shading conditions, SUPAC, LSPAC, and RPPAC methods generated the maximum output power. In the other six shading conditions, the proposed RPPAC method generated the maximum output power, whereas the LSPAC method produced the second-highest power output.
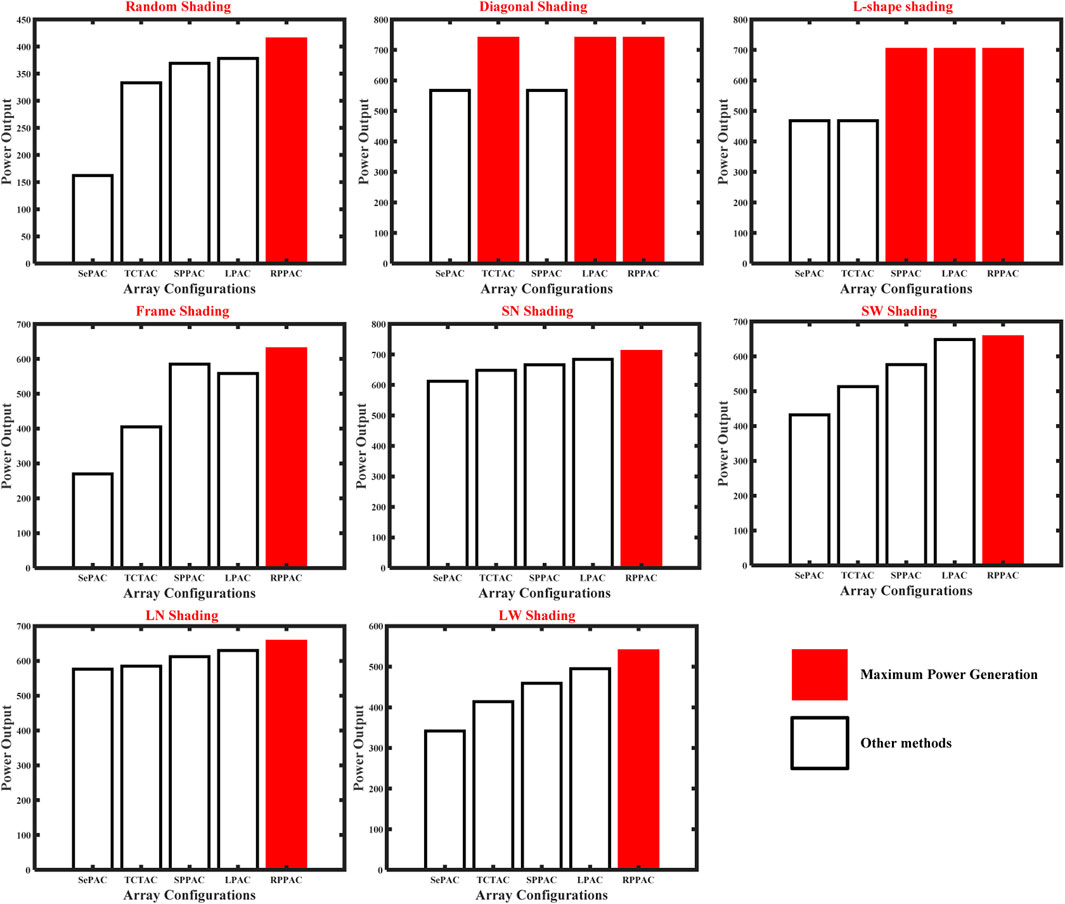
FIGURE 7. Power output comparison chart.
5 Conclusion
In this work, a novel array configuration method called RPPAC was introduced to address the limitations of the existing methods. The performance of the proposed RPPAC was evaluated under eight different shading conditions commonly encountered in photovoltaic systems. The analysis was conducted on a 9 × 9 PV array using MATLAB/Simulink®. The performance of the proposed RPPAC was compared with other established methods, including S-PAC, SUPAC, TCT-AC, and LSPAC. The results and characteristic curves demonstrated that the RPPAC method offers a unique solution for mitigating the effects of partial shading in PV arrays. Compared to the conventional configurations, the proposed RPPAC method exhibited an average efficiency improvement of 30%. Additionally, it outperformed recently developed configurations such as LSPAC, achieving 5%–10% higher efficiency. Notably, the implementation of the proposed configuration did not require any additional setup, although it necessitated a higher quantity of cables for interconnecting the PV modules. These findings highlight the effectiveness and superiority of the proposed RPPAC method in overcoming partial shading issues in PV arrays, offering improved efficiency without the need for major modifications to the existing setup.
Data availability statement
The original contributions presented in the study are included in the article/Supplementary material; further inquiries can be directed to the corresponding author.
Author contributions
BA: Formal Analysis, Investigation, Resources, Writing–original draft. PB: Conceptualization, Writing–review and editing. DS: Methodology, Writing–original draft. ST: Methodology, Writing–review and editing. NN: Resources, Supervision, Writing–review and editing.
Funding
The author(s) declare that no financial support was received for the research, authorship, and/or publication of this article.
Acknowledgments
Authors would like to acknowledge the support of the Deputy for Research and Innovation- Ministry of Education, Kingdom of Saudi Arabia for this research through a grant (NU/IFC/2/SERC/-/25) under the Institutional Funding Committee at Najran University, Kingdom of Saudi Arabia.
Conflict of interest
The authors declare that the research was conducted in the absence of any commercial or financial relationships that could be construed as a potential conflict of interest.
Publisher’s note
All claims expressed in this article are solely those of the authors and do not necessarily represent those of their affiliated organizations, or those of the publisher, the editors, and the reviewers. Any product that may be evaluated in this article, or claim that may be made by its manufacturer, is not guaranteed or endorsed by the publisher.
References
Aghaei, M., Kumar, N. M., Eskandari, A., Ahmed, H., de Oliveira, A. K. V., and Chopra, S. S. (2020). “Solar PV systems design and monitoring,” in Photovoltaic solar energy conversion (Germany: Elsevier), 117–145. doi:10.1016/B978-0-12-819610-6.00005-3
Aljafari, B., S, D., C, B., Balachandran, P. K., and Babu, T. S. (2023). Power enhanced solar PV array configuration based on calcudoku puzzle pattern for partial shaded PV system. Heliyon 9 (5), e16041. doi:10.1016/j.heliyon.2023.e16041
Alwar, S., Samithas, D., Boominathan, M. S., Balachandran, P. K., and Mihet-Popa, L. (2022). Performance analysis of thermal image processing-based photovoltaic fault detection and PV array reconfiguration—a detailed experimentation. Energies 15 (22), 8450. doi:10.3390/en15228450
Babu, T. S., Ram, J. P., Dragicevic, T., Miyatake, M., Blaabjerg, F., and Rajasekar, N. (2018). Particle swarm optimization based solar PV array reconfiguration of the maximum power extraction under partial shading conditions. IEEE Trans. Sustain. Energy 9 (1), 74–85. doi:10.1109/TSTE.2017.2714905
Bryant, S. T., Straker, K., and Wrigley, C. (2024). The need for sectoral transition design: a case of the shift to renewable energy. Technol. Forecast. Soc. Change 198, 122930. doi:10.1016/j.techfore.2023.122930
Cherukuri, S. K., Balachandran, P. K., Kaniganti, K. R., Buddi, M. K., Butti, D., Devakirubakaran, S., et al. (2021). Power enhancement in partial shaded photovoltaic system using spiral pattern array configuration scheme. IEEE Access 9, 123103–123116. doi:10.1109/ACCESS.2021.3109248
Devakirubakaran, S., Verma, R., Bharatiraja, C., and Mihet-Popa, L. (2023). Performance evaluation of static PV array configurations for mitigating mismatch losses. IEEE Access, 1. doi:10.1109/ACCESS.2023.3274684
Dhanalakshmi, B., and Rajasekar, N. (2018a). A novel Competence Square based PV array reconfiguration technique for solar PV maximum power extraction. Energy Convers. Manag. 174, 897–912. doi:10.1016/j.enconman.2018.08.077
Dhanalakshmi, B., and Rajasekar, N. (2018b). Dominance square based array reconfiguration scheme for power loss reduction in solar PhotoVoltaic (PV) systems. Energy Convers. Manag. 156, 84–102. doi:10.1016/j.enconman.2017.10.080
Durango-Flórez, M., González-Montoya, D., Trejos-Grisales, L. A., and Ramos-Paja, C. A. (2022). PV array reconfiguration based on genetic algorithm for maximum power extraction and energy impact analysis. Sustainability 14 (7), 3764. doi:10.3390/su14073764
Lappalainen, K., and Valkealahti, S. (2017). Effects of irradiance transition characteristics on the mismatch losses of different electrical PV array configurations. IET Renew. Power Gener. 11 (2), 248–254. doi:10.1049/iet-rpg.2016.0590
Ma, T., Gu, W., Shen, L., and Li, M. (2019). An improved and comprehensive mathematical model for solar photovoltaic modules under real operating conditions. Sol. Energy 184, 292–304. doi:10.1016/j.solener.2019.03.089
Mohammadnejad, S., Khalafi, A., and Ahmadi, S. M. (2016). Mathematical analysis of total-cross-tied photovoltaic array under partial shading condition and its comparison with other configurations. Sol. Energy 133, 501–511. doi:10.1016/j.solener.2016.03.058
Nguyen, X. H., and Nguyen, M. P. (2015). Mathematical modeling of photovoltaic cell/module/arrays with tags in Matlab/Simulink. Environ. Syst. Res. 4 (1), 24. doi:10.1186/s40068-015-0047-9
Pendem, S. R., and Mikkili, S. (2018). Modeling, simulation and performance analysis of solar PV array configurations (Series, Series–Parallel and Honey-Comb) to extract maximum power under Partial Shading Conditions. Energy Rep. 4, 274–287. doi:10.1016/j.egyr.2018.03.003
Prasad, T. N., Devakirubakaran, S., Muthubalaji, S., Srinivasan, S., Bajaj, M., Zawbaa, H. M., et al. (2022). Power management in hybrid ANFIS PID based AC–DC microgrids with EHO based cost optimized droop control strategy. Energy Rep. 8, 15081–15094. doi:10.1016/j.egyr.2022.11.014
Prince Winston, D., Ganesan, K., Samithas, D., and Baladhanautham, C. B. (2020a). Experimental investigation on output power enhancement of partial shaded solar photovoltaic system. Energy Sources, Part A Recovery, Util. Environ. Eff. 17, 1–17. doi:10.1080/15567036.2020.1779872
Prince Winston, D., Kumaravel, S., Praveen Kumar, B., and Devakirubakaran, S. (2020b). Performance improvement of solar PV array topologies during various partial shading conditions. Sol. Energy 196, 228–242. doi:10.1016/j.solener.2019.12.007
Sagar, G., Pathak, D., Gaur, P., and Jain, V. (2020). A Su Do Ku puzzle based shade dispersion for maximum power enhancement of partially shaded hybrid bridge-link-total-cross-tied PV array. Sol. Energy 204, 161–180. doi:10.1016/j.solener.2020.04.054
Srinivasan, A., Devakirubakaran, S., and Meenakshi Sundaram, B. (2020). Mitigation of mismatch losses in solar PV system – two-step reconfiguration approach. Sol. Energy 206, 640–654. doi:10.1016/j.solener.2020.06.004
Srinivasan, A., Devakirubakaran, S., Sundaram, B. M., Balachandran, P. K., Cherukuri, S. K., Winston, D. P., et al. (2021). L-shape propagated array configuration with dynamic reconfiguration algorithm for enhancing energy conversion rate of partial shaded photovoltaic systems. IEEE Access 9, 97661–97674. doi:10.1109/ACCESS.2021.3094736
Thanikanti, S. B., Aljafari, B., and Colak, I. (2023). A dynamic mismatch loss mitigation algorithm with dual input dual output converter for solar PV systems. Sol. Energy Mater. Sol. Cells 251, 112163. doi:10.1016/j.solmat.2022.112163
Viebahn, P., Soukup, O., Samadi, S., Teubler, J., Wiesen, K., and Ritthoff, M. (2015). Assessing the need for critical minerals to shift the German energy system towards a high proportion of renewables. Renew. Sustain. Energy Rev. 49, 655–671. doi:10.1016/j.rser.2015.04.070
Wang, F., Zhuang, L., Cheng, S., Zhang, Y., and Cheng, S. (2024). Spatiotemporal variation and convergence analysis of China’s regional energy security. Renew. Sustain. Energy Rev. 189, 113923. doi:10.1016/j.rser.2023.113923
Yang, Y., Campana, P. E., and Yan, J. (2020). Potential of unsubsidized distributed solar PV to replace coal-fired power plants, and profits classification in Chinese cities. Renew. Sustain. Energy Rev. 131, 109967. doi:10.1016/j.rser.2020.109967
Keywords: photovoltaic effect, mismatch loss, compensation current, partial shading, reconfiguration, puzzle pattern
Citation: Aljafari B, Balachandran PK, Samithas D, Thanikanti SB and Nwulu NI (2024) Modeling and simulation of a Renzoku puzzle pattern-based PV array configuration for a partially shaded PV system. Front. Energy Res. 12:1335111. doi: 10.3389/fenrg.2024.1335111
Received: 08 November 2023; Accepted: 15 February 2024;
Published: 01 March 2024.
Edited by:
Sudhakar Kumarasamy, Universiti Malaysia Pahang, MalaysiaReviewed by:
Priya Ranjan Satpathy, Council of Scientific and Industrial Research (CSIR), IndiaSurender Reddy Salkuti, Woosong University, Republic of Korea
Copyright © 2024 Aljafari, Balachandran, Samithas, Thanikanti and Nwulu. This is an open-access article distributed under the terms of the Creative Commons Attribution License (CC BY). The use, distribution or reproduction in other forums is permitted, provided the original author(s) and the copyright owner(s) are credited and that the original publication in this journal is cited, in accordance with accepted academic practice. No use, distribution or reproduction is permitted which does not comply with these terms.
*Correspondence: Praveen Kumar Balachandran, cHJhdmVlbmJhbGEwMzhAZ21haWwuY29t; Devakirubakaran Samithas, a2lydWJhdGhhc0BnbWFpbC5jb20=