
95% of researchers rate our articles as excellent or good
Learn more about the work of our research integrity team to safeguard the quality of each article we publish.
Find out more
ORIGINAL RESEARCH article
Front. Energy Res. , 02 February 2024
Sec. Nuclear Energy
Volume 12 - 2024 | https://doi.org/10.3389/fenrg.2024.1334200
This article is part of the Research Topic Experimental and Simulation Research on Nuclear Reactor Thermal-Hydraulics, Volume II View all 9 articles
 Chuan Lu*
 Zhaohui Du
In fuel assemblies of pressurized water reactors (PWRs), mixing-vane spacer grids are extensively employed to array fuel rods and enhance inter- and intra-subchannel mixing. The turbulent flow downstream of spacer grids is essential knowledge to support the design of spacer grids and mixing vanes. As a high-fidelity approach for turbulence simulation, large eddy simulation (LES) results are assessed with the high-resolution flow field measured with particle image velocimetry (PIV). The LES results reveal a mixing vane effect on vortex structures and Reynolds stresses. The mechanism of vortex generation at the mixing vanes and the development downstream of the spacer grid are visualized by the Q-criterion. The distributions of the root mean square fluctuating velocity and Reynolds stresses decay rapidly downstream of the spacer grid. The secondary flow intensity downstream of the spacer grid predicted by LES is evaluated and follows an exponentially decaying law with distance from the spacer grid.
In pressurized water reactors (PWRs), fuel rod bundles are assembled into spacer grids in the core. In order to increase heat transfer, mixing vanes are fabricated on the spacer grid to produce an inter-subchannel crossflow and secondary flow within the subchannel. Furthermore, the disturbance of momentum and the thermal boundary layer on fuel rods enhances heat transfer from fuel rods to the coolant.
Several experimental investigations have been carried out by laser Doppler anemometry (LDA). Chang et al. (2008), Chang et al. (2014), and Han et al. (2009) employed LDA to measure the lateral flow downstream of the split-type mixing vane spacer grid and the swirl-type mixing vane spacer grid. They found that the secondary flow intensity downstream of the split-type mixing vane spacer grid was much larger than that downstream of the swirl-type mixing vane spacer grid. Thus, the split-type mixing vane spacer grid was chosen for an advanced fuel assembly. To study the mechanism of lateral turbulence generated by the spacer grid, particle image velocimetry (PIV) was applied in the measurement of the turbulent flow in a 5 × 5 rod bundle. Dominguez-Ontiveros et al. (2012) and Conner et al. (2013) applied PIV to measure the longitudinal flow in a 5 × 5 rod bundle using a spacer grid, and they used FEP tubes as rod bundles to match the refractive index of water. Nguyen and Hassan (2017) and Matozinhos et al. (2021) studied the turbulent length scales in the axial velocity field in a 5 × 5 rod bundle using a spacer grid. Qu et al. (2019a), Qu et al. (2019b), Qu et al. (2019c), Qu et al. (2021), Xiong et al. (2020b), and Qu et al. (2023) applied PIV to obtain the lateral flow in a 5 × 5 rod bundle using a spacer grid, and they investigated subchannel mixing models based on the experimental data.
However, experimental work is limited to specific measured locations. The computational fluid dynamics (CFD) methodology is powerful for capturing detailed flow fields in rod bundles. There have been several benchmark exercises to establish best practice guidelines and validate the CFD codes (Lee et al., 2014; Kang and Hassan, 2016; Mikuž and Tiselj, 2016). They suggested the Reynolds stress model (RSM) and large eddy simulation (LES) to simulate the turbulent flow in the rod bundle for time-averaged flow qualities and instantaneous characteristics. Busco and Hassan (2018) and Busco et al. (2019) employed LES to study the length scales and anisotropic turbulence in the rod buddle downstream of the spacer grid. Xiong et al. (2020a) and Wiltschko et al. (2021) concluded that LES is superior to RSM in the prediction of the flow field in a 5 × 5 rod bundle with split-type mixing vanes. Only one paper studied the mechanism of cross-flow generated by mixing vanes by hybrid simulation based on the LES and RNG k-epsilon models (Chang and Tavoularis, 2015).
Addad et al. (2015) applied direct numerical simulation to study the buoyancy-driven turbulent flow in a horizontal annular cavity at a Rayleigh number of 1.18 × 10⁹. Their predictions of temperature profiles were validated by experimental data. Kim et al. (2019) employed the LES results as a baseline to validate the RANS model to predict the temperature and heat transfer coefficient in randomly packed pebbles. Ali et al. (2022) used LES to simulate the heat transfer during baffle jetting in the rod bundle. With the validation of experimental data, the LES gives good predictions of flow and heat transfer results.
In this study, the turbulent flow in the rod bundle is simulated by LES and discussed in this paper. The mixing vane-induced vortex structures and their development downstream of the spacer grid are studied. The developments of the turbulent fluctuating velocity and Reynolds stress are discussed downstream of the space grid. The secondary flow intensity is evaluated and shows an exponential decaying trend after the spacer grid.
The commercial software package STAR CCM+ is used for the numerical simulations that are presented in this work. The LES is used for the numerical investigation of the flow field in the 5 × 5 rod bundle with a split-type mixing vane spacer grid. The LES calculates large-scale energy-containing eddies directly from the filtered Navier–Stokes equation, while small-scale eddies containing less kinetic energy are modeled using the sub-grid-scale (SGS) model. The filtered Navier–Stokes equations for mass and momentum are developed from the incompressible Navier–Stokes equations and are given as follows (Selvam et al., 2015):
The wall-adapting local eddy-viscosity (WALE) model is used as the SGS model [21].
where the model constant
The experimental data on PIV measurements in a 5 × 5 rod bundle (Qu et al., 2019a) with a bulk velocity of 1 m/s are used to validate numerical predictions.
Figure 1 shows the computational domain of the numerical investigation; the indices of the subchannel can be seen in the cross-sectional view (in Figure 1B). Upstream of the spacer grid, a length of 10 Dh (subchannel hydraulic diameter) is discretized, while downstream of the spacer grid, a length of 20 Dh is discretized (see Figure 1A).
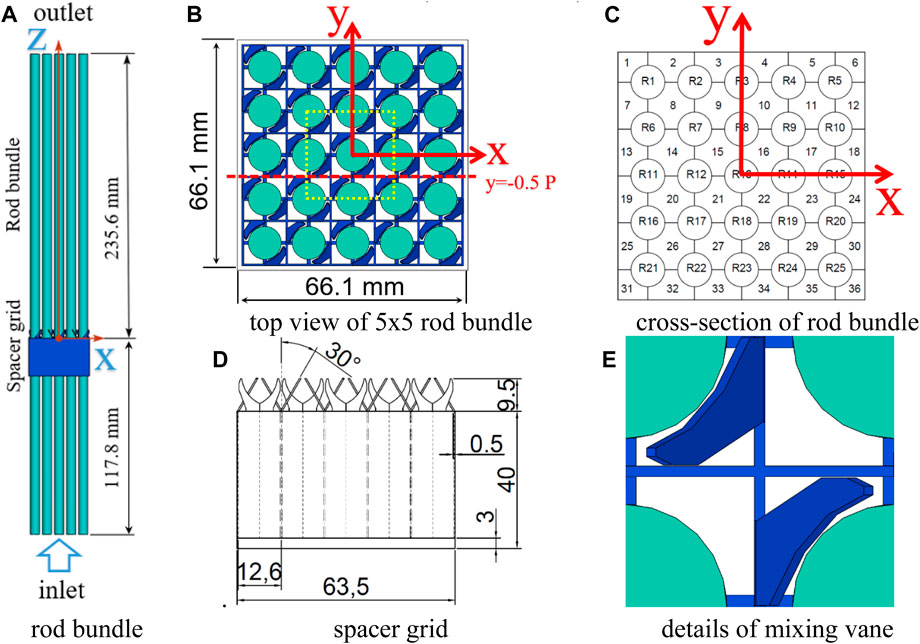
FIGURE 1. Scheme of the computational domain of a 5 × 5 rod bundle with the spacer grid. (A) computation domain, (B) cross section of rod bundle, (C) index of subchannels and rods, (D) spacer grid, (E) details of mixing vane.
A fully developed velocity profile of a bare rod bundle was set as the inlet boundary, so the relatively short length of 10 Dh is long enough. The wall boundaries are set to no slip walls, and the outlet boundary is a pressure outlet. The properties of the simulated coolant flow, including density
where y is the thickness of the first mesh near the wall, with the friction velocity
where
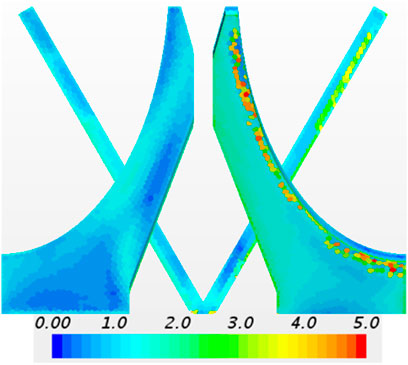
FIGURE 2. Non-dimensional wall distance
The energy-containing length scale
where
with the kinematic viscosity
In the present study, with
The simulated physical time is 2 s, which corresponds to 5.66 flow-through times. The LES was initialized with the velocity, pressure, and turbulence intensity fields generated by RSM. To validate LES, the time-averaged crossflow velocity and the root mean square of the fluctuating velocity are defined and compared with the experimental results (Qu et al., 2019a).
The simulated data within 1–2 s are investigated. As shown in Figure 3A, B, the time-averaged velocity U and V along y = −0.5 P at z = 1 Dh and 8 Dh are in reasonable agreement with the experimental data, exhibiting the same trends with an over-predicted magnitude. As shown in Figure 3C, D,
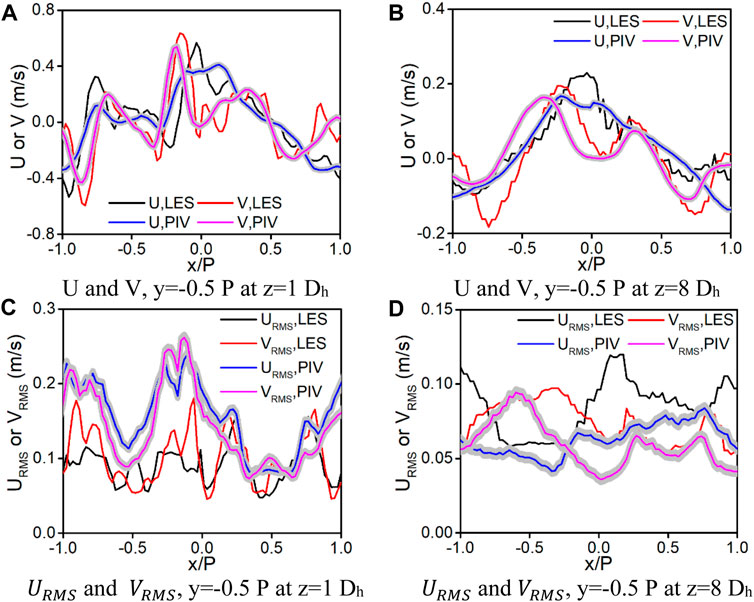
FIGURE 3. LES validations along y = −0.5 P at z = 1 Dh and 8 Dh.
The mixing vanes generate vortices, which are a key factor driving the subchannel crossflow. Therefore, the formation of the vortices, as well as their path through the rod bundle, is investigated. First, the formation of the vortices at the mixing vanes is illustrated. To identify a vortex in the flow, the Q-criterion can be used. The Q-criterion estimates the regions in the flow field that are dominated by rotation, as well as the regions dominated by strain and shear, and is calculated by (Chang and Tavoularis, 2015)
A positive Q-value indicates a region that is dominated by rotation, while a negative Q-value indicates a region that is dominated by strain and shear. By drawing iso-value surfaces with a certain positive value, vortex envelopes can be made visible. Figure 4 shows the iso-surface of
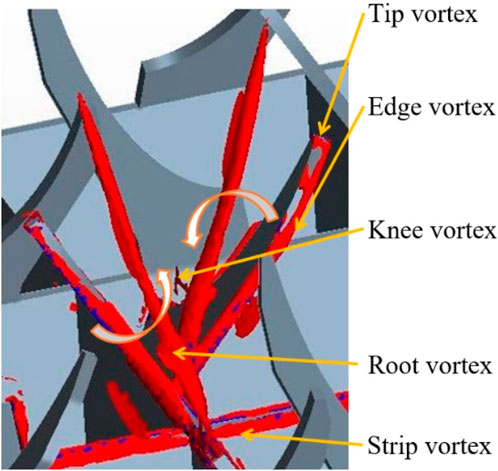
FIGURE 4. Envelope of vortices at mixing vanes, time-averaged within 1–2s.
Figure 5 shows the Q-criterion in subchannel No. 11. The regions with a high Q-value are indications of vortices. At z = 0.25 Dh, the two main vortices can be seen, located at the root edges of mixing vanes close to the subchannel center. The secondary vortices generated by the edges of mixing vanes in gaps can be seen. From z = 0.25 Dh to 1 Dh, the two main vortices rotate around the subchannel center in a clockwise direction. In addition, the rotating vortices are instantaneously temporal. Within 1 Dh, the secondary vortices formed at the sharp edges of the adjacent subchannels move into subchannel 11. At z = 0.75 Dh, the generation of the secondary vortices at the tips of the mixing vanes can be seen. On the way upstream, these secondary vortices move to the adjacent subchannel at the top and bottom. At z = 1.25 Dh, the secondary vortices induced by the top edges of the mixing vanes in subchannels 10 and 12 (refer to Figure 1B) enter subchannel 11. Furthermore, these vortices move toward the subchannel center, while the main vortices move toward the adjacent subchannels. There is still a little clockwise spinning in the path of the main vortices. The secondary vortices generated by the sharp edges move into the adjacent subchannels. At z = 2.75 Dh, the down main vortex has already moved into subchannel 15 and the top main vortex moves into subchannel 7. Moreover, the main vortices from subchannels 10 and 12 enter subchannel 11. The secondary vortices of the top edges of the mixing vanes in the adjacent subchannels decompose, while the main vortices from the adjacent subchannels move toward the subchannel center along a clockwise path close to the rods. Another important effect of heat transfer from the fuel rods to the coolant flow is the breaking up of the boundary layer around the fuel rods. Generally, in a pipe flow, the friction of the wall leads to a shear-dominated boundary layer near the walls. However, in Figure 5, the Q-criterion indicates regions with a high rotation close to rods. These are the regions where the boundary layer is broken up by flowing vortices.
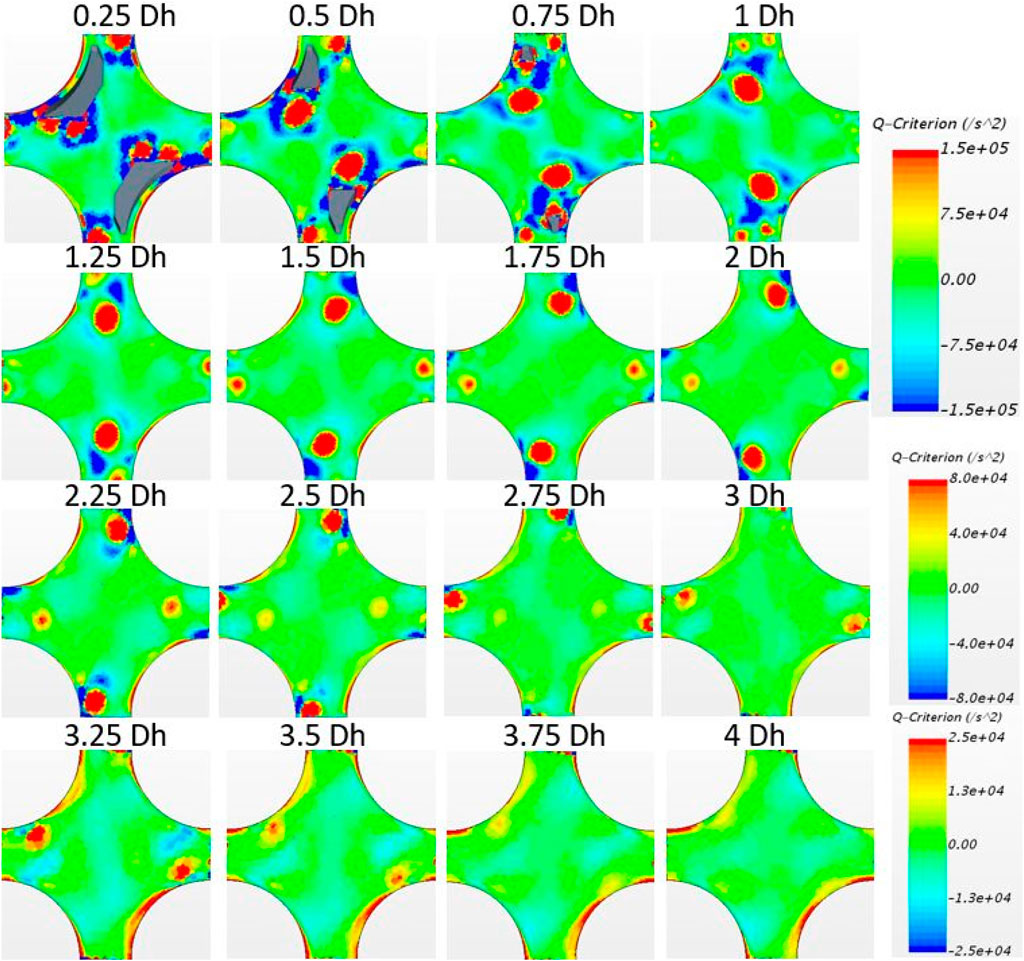
FIGURE 5. Q-criterion in subchannel No. 11, time-averaged within 1–2s.
Figure 6A shows the vector field of the crossflow velocity near the rod at the cross section at z = 1 Dh downstream of the spacer grid. Figure 6B shows the Q-criterion at the same location. Figure 6B shows a region of high Q-value in the boundary layer close to the rod (marked red). Figure 6A shows the reason for this effect. The vortex induces crossflow velocity in such a way that the boundary layer is very thin at this position. The wall-normal velocity gradient is very high at this location. Therefore, the heat transfer from the fuel rod into the coolant flow is enhanced at this location. The rest of the section of the rod wall is surrounded by a normal boundary layer, and there is no high wall-normal velocity gradient. In this part of the section of the wall, the Q-value is low, and therefore, the flow is shear-dominated. The cross-flow velocity and Q-criterion at z = 3.75 Dh are shown in Figure 6C, D, respectively. The regions of high Q-value in Figure 6D are marked in red, and the corresponding regions with a thin boundary layer are marked in red in Figure 6C. A region with a relatively thick boundary layer is marked in blue. Here, the Q-criterion has a small value.
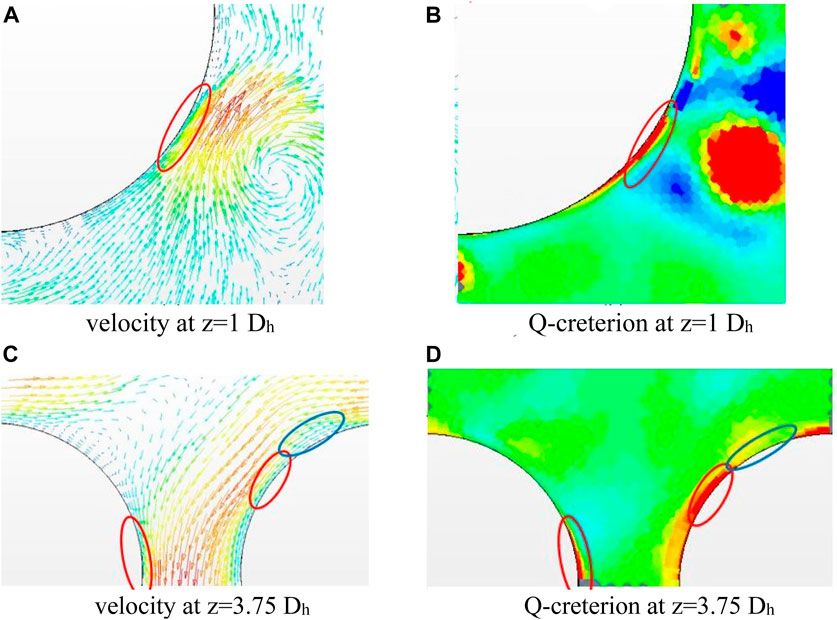
FIGURE 6. Velocity vectors and Q-criterion in subchannel No. 11, time-averaged within 1–2s. (A) velocity at z=1Dh, (B) Q-criterion at z=1Dh, (C) velocity at z=3.75Dh, (D) Q-criterion at z=3.75Dh.
Figure 7 shows
FIGURE 7.
FIGURE 8.
The lateral turbulence intensity can be calculated by
Figure 9 shows the lateral turbulence intensity at 1 Dh, 4 Dh, 8 Dh, and 16 Dh downstream of the spacer grid. At z = 1 Dh, the turbulence intensity has the maxima close to the rods, near the gaps of the subchannels. The high turbulence intensity is at the same locations where the velocity maxima are appearing due to the vortices. In the subchannel center, the turbulence intensity is very small. At z = 4 Dh, the maxima of the turbulence intensity are in the subchannel centers, while the magnitude of the maxima and the averaged turbulence intensity are smaller than those at the first cross section. The shape of the distribution of the turbulence intensity is very similar to the shape of the distribution of the vortices, as observed by the Q-criterion. It is obvious that the vortices are leading to a high turbulence intensity. At z = 8 Dh, the decay of the turbulence intensity becomes slower. The maxima are moving from the subchannel centers toward the rods, especially into the gaps in between the adjacent subchannels. The high turbulence intensity close to the fuel rods is enhancing heat transfer at the locations in the gaps. At z = 16 Dh, the highest TI is located close to the rods in the vertical gaps, while next to the rods in the horizontal gaps, the smallest values of the turbulence intensity can be found. Therefore, the heat transfer is enhanced by the turbulence in the vertical gaps but not in the horizontal gaps. The turbulence intensity follows an exponential decay rate within 20 Dh downstream of the spacer grid.

FIGURE 9. TI at z = 1 Dh (A), z = 4 Dh (B), z = 8 Dh (C), and z = 16 Dh (D), time-averaged within 1–2s.
The lateral Reynolds shear stress
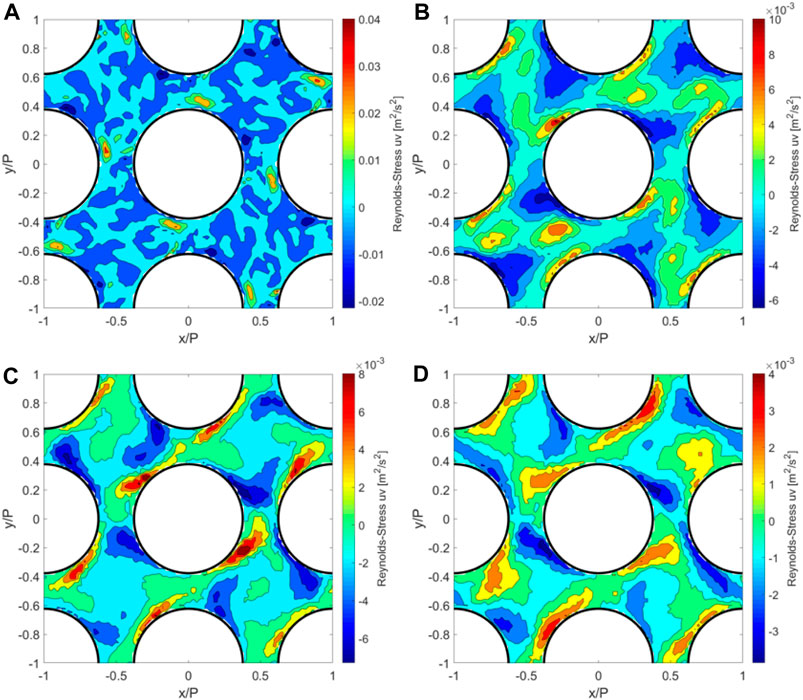
FIGURE 10.
One key parameter to evaluate the effect of the spacer grid on the fluid flow is the area-averaged secondary flow intensity (SFI). The SFI is the area-averaged ratio of the magnitude of the spanwise crossflow velocity components
In this equation, A represents the area of the cross section;
which is evaluated from the measured data from 1 Dh to 20 Dh downstream of the spacer grid in the experiment and LES. The coefficients of fitted SFI correlations are listed in Table 1, and the fitted SFI correlations are listed in Figure 11.
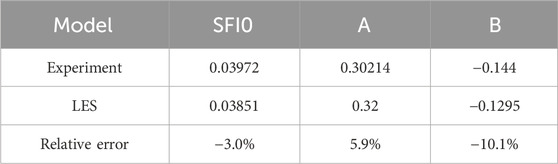
TABLE 1. Fitted exponential decay functions of SFI based on experimental and simulated data.
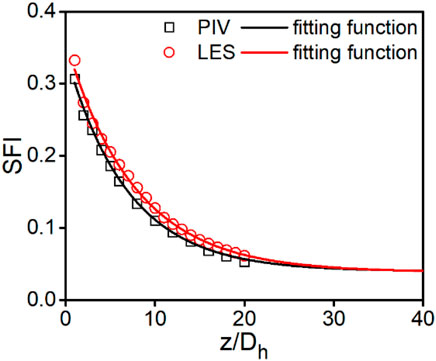
FIGURE 11. SFI downstream of the spacer grid.
In order to visualize the fully developed flow, far downstream of the spacer grid, the functions are plotted up to 40 Dh downstream of the spacer grid. It is important to be aware that drawing conclusions from extrapolated data is a challenge. Nevertheless, it can be assumed that the fitting function of the experiment gives a good approximation to the fully developed SFI0, as well as to the axial distance downstream of the spacer grid, where the flow is fully developed. The fully developed secondary flow intensity SFI0 is almost the same in the experiment and LES. Furthermore, the value of SFI0, according to both fitting functions, almost reached approximately 30 Dh downstream of the spacer grid. Hence, it can be concluded that the accuracy of the LES approach is satisfactory for the SFI.
The turbulent flow in a 5 × 5 rod bundle with a spacer grid was studied using the LES. The simulation results for the crossflow velocity and lateral Reynolds stresses were well-validated against previous experimental data. The investigation has shown that the presented simulation shows high accuracy for the velocity distribution in the whole investigated domain. The results of the velocity fluctuations and the lateral Reynolds shear stress have been proven to be accurate near the spacer grid and reasonable far downstream of the spacer grid. Based on the simulation, the vortices shed from mixing vanes and travel through subchannels and gaps within the first four hydraulic diameters downstream of the spacer grid. In addition, lateral velocity and Reynolds stresses decay in the exponential law with the distance from the spacer grid. LES can reach a high level of accuracy in the flow inside of a rod bundle with mixing vanes and can be used for future investigations.
The raw data supporting the conclusion of this article will be made available by the authors, without undue reservation.
CL: visualization, writing–original draft, and writing–review and editing. ZD: supervision and writing–review and editing.
The author(s) declare that no financial support was received for the research, authorship, and/or publication of this article.
The authors declare that the research was conducted in the absence of any commercial or financial relationships that could be construed as a potential conflict of interest.
All claims expressed in this article are solely those of the authors and do not necessarily represent those of their affiliated organizations, or those of the publisher, the editors, and the reviewers. Any product that may be evaluated in this article, or claim that may be made by its manufacturer, is not guaranteed or endorsed by the publisher.
Addad, Y., Gaitonde, U., Laurence, D., and Rolfo, S. (2008). Optimal unstructured meshing for large eddy simulations. Qual. Reliab. Large-Eddy Simulations 12, 93–103. doi:10.1007/978-1-4020-8578-9_8
Addad, Y., Zaidi, I., and Laurence, D. (2015). Quasi-DNS of natural convection flow in a cylindrical annuli with an optimal polyhedral mesh refinement. Comput. Fluids 118, 44–52. doi:10.1016/j.compfluid.2015.06.014
Ali, M., Alkaabi, A. K., Alameri, S. A., and Afgan, I. (2022). Thermal analysis of baffle jetting in fuel rod assembly. Phys. Fluids 34. doi:10.1063/5.0109255
Busco, G., and Hassan, Y. A. (2018). Space and energy-based turbulent scale-resolving simulations of flow in a 5 × 5 nuclear reactor core fuel assembly with a spacer grid. Int. J. Heat Fluid Flow 71, 420–441. doi:10.1016/j.ijheatfluidflow.2018.04.003
Busco, G., Merzari, E., and Hassan, Y. A. (2019). Invariant analysis of the Reynolds stress tensor for a nuclear fuel assembly with spacer grid and split type vanes. Int. J. Heat Fluid Flow 77, 144–156. doi:10.1016/j.ijheatfluidflow.2019.04.006
Chang, D., and Tavoularis, S. (2015). Hybrid simulations of the near field of a split-vane spacer grid in a rod bundle. Int. J. Heat Fluid Flow 51, 151–165. doi:10.1016/j.ijheatfluidflow.2014.07.005
Chang, S.-K., Kim, S., and Song, C.-H. (2014). Turbulent mixing in a rod bundle with vaned spacer grids: OECD/NEA–KAERI CFD benchmark exercise test. Nucl. Eng. Des. 279, 19–36. doi:10.1016/j.nucengdes.2014.05.013
Chang, S. K., Moon, S. K., Baek, W. P., and Choi, Y. D. (2008). Phenomenological investigations on the turbulent flow structures in a rod bundle array with mixing devices. Nucl. Eng. Des. 238, 600–609. doi:10.1016/j.nucengdes.2007.02.037
Conner, M. E., Hassan, Y. A., and Dominguez-Ontiveros, E. E. (2013). Hydraulic benchmark data for PWR mixing vane grid. Nucl. Eng. Des. 264, 97–102. doi:10.1016/j.nucengdes.2012.12.001
Dominguez-Ontiveros, E. E., Hassan, Y. A., Conner, M. E., and Karoutas, Z. (2012). Experimental benchmark data for PWR rod bundle with spacer-grids. Nucl. Eng. Des. 253, 396–405. doi:10.1016/j.nucengdes.2012.09.003
Han, S. Y., Seo, J. S., Park, M. S., and Choi, Y. D. (2009). Measurements of the flow characteristics of the lateral flow in the 6×6 rod bundles with Tandem Arrangement Vanes. Nucl. Eng. Des. 239, 2728–2736. doi:10.1016/j.nucengdes.2009.09.026
Kang, S. K., and Hassan, Y. A. (2016). Computational fluid dynamics (CFD) round robin benchmark for a pressurized water reactor (PWR) rod bundle. Nucl. Eng. Des. 301, 204–231. doi:10.1016/j.nucengdes.2016.03.007
Kim, S. G., Addad, Y., Liu, M., Lee, J. I., and Lee, Y. (2019). Computational investigation into heat transfer coefficients of randomly packed pebbles in flowing FLiBe. Int. J. Heat Mass Transf. 145, 118769. doi:10.1016/j.ijheatmasstransfer.2019.118769
Lee, J. R., Kim, J., and Song, C.-H. (2014). Synthesis of the turbulent mixing in a rod bundle with vaned spacer grids based on the OECD-KAERI CFD benchmark exercise. Nucl. Eng. Des. 279, 3–18. doi:10.1016/j.nucengdes.2014.03.008
Matozinhos, C. F., Tomaz, G. C. Q., Nguyen, T., and Hassan, Y. (2021). Experimental investigation of turbulent flow characteristics in cross-flow planes of a 5×5 rod bundle with a spacer grid. Int. J. Heat Fluid Flow 87, 108757. doi:10.1016/j.ijheatfluidflow.2020.108757
Mikuž, B., and Tiselj, I. (2016). Wall-resolved Large Eddy Simulation in grid-free 5 × 5 rod bundle of MATiS-H experiment. Nucl. Eng. Des. 298, 64–77. doi:10.1016/j.nucengdes.2015.12.021
Nguyen, T., and Hassan, Y. (2017). Stereoscopic particle image velocimetry measurements of flow in a rod bundle with a spacer grid and mixing vanes at a low Reynolds number. Int. J. Heat Fluid Flow 67, 202–219. doi:10.1016/j.ijheatfluidflow.2017.08.011
Qu, W., Wang, Z., Xiong, J., and Cheng, X. (2019a). Experimental study of cross flow and lateral pressure drop in a 5 × 5 rod bundle with mixing vane spacer grid. Nucl. Eng. Des. 353, 110209. doi:10.1016/j.nucengdes.2019.110209
Qu, W., Xie, H., Shen, D., Wang, Z., and Xiong, J. (2023). Experimental study of coherent structures downstream mixing vaned spacer grid of different inclination angles in a 5 × 5 rod bundle by TR-PIV. Ann. Nucl. Energy 181, 109516. doi:10.1016/j.anucene.2022.109516
Qu, W., Xiong, J., Chen, S., and Cheng, X. (2019b). High-fidelity PIV measurement of cross flow in 5 × 5 rod bundle with mixing vane grids. Nucl. Eng. Des. 344, 131–143. doi:10.1016/j.nucengdes.2019.01.021
Qu, W., Xiong, J., Chen, S., Qiu, Z., Deng, J., and Cheng, X. (2019c). PIV measurement of turbulent flow downstream of mixing vane spacer grid in 5×5 rod bundle. Ann. Nucl. Energy 132, 277–287. doi:10.1016/j.anucene.2019.04.016
Qu, W., Yao, W., Xiong, J., and Cheng, X. (2021). Experimental study of pressure loss in a 5 × 5–rod bundle with the mixing vane spacer grid. Front. Energy Res. 9. doi:10.3389/fenrg.2021.675494
Selvam, P. K., Kulenovic, R., and Laurien, E. (2015). Large eddy simulation on thermal mixing of fluids in a T-junction with conjugate heat transfer. Nucl. Eng. Des. 284, 238–246. doi:10.1016/j.nucengdes.2014.12.025
Wiltschko, F., Qu, W., and Xiong, J. (2021). Validation of RANS models and Large Eddy simulation for predicting crossflow induced by mixing vanes in rod bundle. Nucl. Eng. Technol. 53, 3625–3634. doi:10.1016/j.net.2021.05.034
Xiong, J., Lu, C., Qu, W., Yang, Y., and Cheng, X. (2020a). Assessment of RANS models in predicting mixing flow induced by split-type vanes in rod bundle. Nucl. Eng. Des. 363, 110615. doi:10.1016/j.nucengdes.2020.110615
Keywords: spacer grid, validation, large eddy simulation, lateral turbulence and subchannel mixing, rod bundle assembly
Citation: Lu C and Du Z (2024) Large eddy simulation of a turbulent flow in a 5 x 5 rod bundle with a mixing vane spacer grid. Front. Energy Res. 12:1334200. doi: 10.3389/fenrg.2024.1334200
Received: 06 November 2023; Accepted: 08 January 2024;
Published: 02 February 2024.
Edited by:
Longxiang Zhu, Chongqing University, ChinaReviewed by:
Fangyang Yuan, Jiangnan University, ChinaCopyright © 2024 Lu and Du. This is an open-access article distributed under the terms of the Creative Commons Attribution License (CC BY). The use, distribution or reproduction in other forums is permitted, provided the original author(s) and the copyright owner(s) are credited and that the original publication in this journal is cited, in accordance with accepted academic practice. No use, distribution or reproduction is permitted which does not comply with these terms.
*Correspondence: Chuan Lu, MjAzOTkwOThAcXEuY29t
Disclaimer: All claims expressed in this article are solely those of the authors and do not necessarily represent those of their affiliated organizations, or those of the publisher, the editors and the reviewers. Any product that may be evaluated in this article or claim that may be made by its manufacturer is not guaranteed or endorsed by the publisher.
Research integrity at Frontiers
Learn more about the work of our research integrity team to safeguard the quality of each article we publish.