 Enze Zhou
 Lei Wang
 Ruizeng Wei1
 You Zhou
95% of researchers rate our articles as excellent or good
Learn more about the work of our research integrity team to safeguard the quality of each article we publish.
Find out more
ORIGINAL RESEARCH article
Front. Energy Res. , 19 January 2024
Sec. Process and Energy Systems Engineering
Volume 12 - 2024 | https://doi.org/10.3389/fenrg.2024.1330782
This article is part of the Research Topic Advanced Technologies for Planning and Operation of Prosumer Energy Systems, volume III View all 32 articles
With the intensification of global climate change, the frequency of wildfires has markedly increased, presenting an urgent challenge in assessing tripping failures for power systems. This paper proposes an innovative method to evaluate the spatial wildfire-induced tripping risk of transmission lines based on a flame combustion model. Firstly, Bayes theory is employed to assess the spatial probability of wildfire occurrence. Subsequently, Wang Zhengfei’s flame combustion model is utilized to estimate the potential flame height of wildfires along the transmission corridor. Thirdly, the insulation breakdown risk of the transmission line is calculated based on the relative height difference between the flame and the transmission line. Finally, the spatial wildfire-induced tripping risk of the transmission line is then determined by combining the wildfire occurrence probability and the insulation breakdown risk. A case study conducted in Guizhou province, China validates the accuracy of the proposed model. Utilizing ArcGIS, the wildfire occurrence probability distribution in Guizhou is visualized to enhance the efficiency of operation and maintenance. The results indicate that over 80% of wildfire incidents occurred in areas with occurrence probabilities exceeding 50%.
Wildfires are on the rise globally due to abnormal climate patterns and traditional fire-usage practices in China. When wildfires encroach upon transmission lines, the risk of tripping increases significantly. This heightened risk is attributed to reduced air insulation between the ground and transmission lines, resulting from elevated temperatures, flame conductivity, and combustion by-products (West, 1979; Naido and Swift, 1993). A notable instance occurred during the 2018 Chinese New Year holiday when the Hunan Power Grid experienced five wildfire-induced tripping failures in just 7 days, causing widespread and severe power outages (T. Zhou et al., 2019). Additionally, on 5 February 2021, a wildfire along the transmission corridor of the 500 kV Laiwu line I in Guangxi province led to multiple tripping instances in quick succession. Consequently, wildfires have become a prominent cause of tripping failures in transmission lines, significantly impacting the safety and stability of power grids (Lu et al., 2016b). Furthermore, wildfires tend to occur during specific periods due to fire-related customs like moor burns and sacrificial offerings in China. Swift and effective response to these incidents poses a challenge for forestry managers and related utilities. To address this, the Fire Weather Index (FWI) was introduced in 1970 for quantitative assessment of wildfire occurrence risks in wildland areas, encompassing six components that consider fuel moisture and weather conditions (VAN et al., 1987; HOFFMANN et al., 2003; Niu et al., 2006). Subsequently, several wildfire-risk assessment methodologies have been established, such as Australia’s Forest Fire Danger Index (FFDI) (William et al., 2003) and Russia’s Nesterov Index (NI) (Sherstyukov, 2002). However, the existing indices have predominantly concentrated on assessing the risk of large-scale wildfires in forested areas, overlooking their specific impacts on transmission lines.
In 2016, the State Grid Corporation of China introduced a standard titled “Drawing Guidelines for Region Distribution Map of Wildfires Near Overhead Transmission Lines” (State Grid Corporation of China, 2016). This standard utilized the historical wildfire number index to characterize the influence of human activities on wildfire occurrences. Additionally, vegetation types were categorized, taking into account the impact of burning performance on the insulation of transmission lines (Lu et al., 2016a; Shi et al., 2018; Bian et al., 2021). While offering valuable insights, this standard overlooks the local meteorological and topographic conditions that play a crucial role in influencing vegetation distribution and burning performance. These conditions, consequently, have a significant impact on the real-world spread behavior of wildfires.
To mitigate these constraints, researchers have proposed data mining-based risk assessment models. These models encompass diverse factors: weather conditions, vegetation types, topography, and transmission line structural parameters. Yet, their effectiveness is curbed by sparse, low-quality historical trip failure data under real-world conditions.
(Dian et al., 2016) assessed early warning risks based on the spatial distance between wildfire and transmission line (Liu et al., 2021). introduced a tripping risk method, integrating an adjusted wildfire variation coefficient to gauge transmission line tripping probabilities (Wu et al., 2016). formulated a dynamic wildfire risk model, accounting for wildfire spread direction and speed concerning transmission lines. However, these models overlook the impact of wildfire behaviors on air gap insulation reduction. Wildfire ignition across varied surfaces leads to diverse flame heights and intensities, ultimately compromising transmission line insulation (You et al., 2011). Therefore, it is crucial to consider how distinct fire intensities in different geographic and weather contexts influence the risks associated with line trips.
This study presents an innovative model for assessing wildfire-induced tripping risk of power transmission lines. This model allows for the calculation of potential flame intensity upon the ignition of underlying surfaces. Subsequently, it comprehensively evaluates the impact of two distinct flame scenarios on air gap insulation, thereby facilitating the calculation of insulation breakdown risks. Additionally, the model integrates wildfire occurrence probabilities derived from a Naïve Bayes Network (NBN) to provide a comprehensive assessment of wildfire-induced tripping risks in transmission lines. Guizhou Province in Southwest China is chosen as the study area. A dataset containing 14 wildfire-related parameters is collected within the study area. This dataset enables the computation of wildfire probabilities and the assessment of wildfire-induced tripping risks. The resulting risk distribution is then mapped using ArcGIS to validate the efficacy and performance of the proposed method.
The wildfire-induced tripping risk of transmission line signifies the extent of harm inflicted by wildfire disasters on the operation of transmission lines. This assessment serves as a pivotal guide for devising measures aimed at forestalling wildfires within power grid systems (Castagna et al., 2021). The occurrence of wildfire-induced trips hinges upon two prerequisites. The first one is a wildfire incident occurring near a transmission line. The second is a breakdown occurred between line-to-ground or line-to-line, as the air insulation under the flame condition can no longer withstand the operating voltage of transmission line. Hence, the risk of wildfire-induced trips Rt involves a combination of the wildfire occurrence probability Pf and the insulation breakdown risk Rt_f of transmission line, as described by Eq 1.
The research framework is shown in Figure 1. In the first phase, the historical fire spot location and wildfire-related factors were collected to form a sample set. And the relief algorithm was used to evaluate the importance of wildfire-related factors. Subsequently, factors with the lowest importance were systematically eliminated. Following this, an optimal Naive Bayesian model was constructed to assess the probability of wildfire occurrence.

FIGURE 1. Framework of wildfire-induced tripping risk assessment.
In the second phase, meticulous consideration was given to the impact of flame intensity on the gap insulation of transmission line. The insulation breakdown risk was calculated based on distinct scenarios. The assessment of wildfire-induced tripping risk was then conducted by integrating this insulation breakdown risk with the probability of wildfire occurrence.
The ignition of wildfires hinge on the presence of fire sources and fuels. Studies have shown that more than 95% of wildfires are ignited by human activities, implying that regions with frequent human activities are more susceptible to both unintentional and deliberate human-induced ignitions (Millington et al., 2008). In this study, five factors including road distance, settlement distance, population density, Gross Domestic Product (GDP) and fire-spot density, are selected to describe the impact of human activities on wildfire occurrence.
The fuel conditions are characterized by the vegetation along the transmission corridors, including land-usage type, vegetation type, normalized difference vegetation index (NDVI) and fuel loads. Besides, both the meteorology and topography have an obvious influence on the vegetation flammability, thereby affecting the ignition and spread of wildfires. The relevant factors include precipitation, temperature, elevation, slope, and aspect (Dios et al., 2021).
Guizhou Province, located in the Southwest of China (24°37'- 29°13′N and 103°36'- 109°35′E), as the shown in Figure 2, spans an area of approximately 162,000 km2. Characterized by a subtropical monsoon climate, the region provides favorable conditions for the proliferation of dense vegetation, significantly elevating the likelihood of wildfire occurrence. Approximately 200 wildfire incidents were detected annually since 2011 in Guizhou Province, as depicted in Figure 3. Due to the frequent occurrence of wildfires in Guizhou Province and their substantial impact on the power grid, there is an urgent need to develop and implement effective wildfire prevention and control measures.
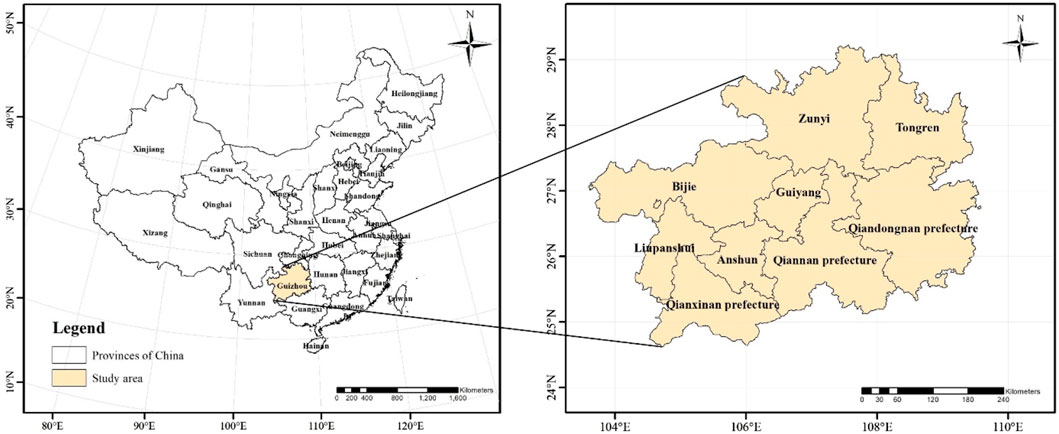
FIGURE 2. Location of the study area.
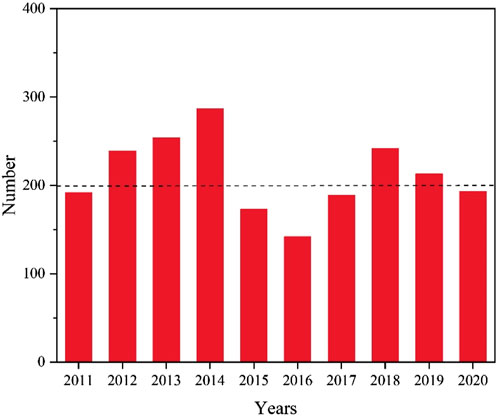
FIGURE 3. Wildfire incidence in Guizhou Province from 2011 to 2020.
The dataset of fourteen wildfire-related factors was collected for analyzing the occurrence probability distribution of wildfires in the study area. Most of the data were provided by the Resource and Environmental Science and Data Center of the Chinese Academy of Sciences (http://www.resdc.cn/Default.aspx). The information of wildfire incidents from 2010 to 2020 are provided by the China National Meteorological Center. As the general fire-usage habits in a region tend to remain relatively stable over time, the historical fire-spot density was selected to as a feature to reflect the cumulative fire patterns in the region. Specifically, one-third of the dataset from the wildfire incidents (early 2010–2014) was used to compute historical fire-spot density for each grid. And the remaining samples constituted a database for constructing the wildfire risk assessment model. Additionally, the laser point cloud data of transmission corridors is obtained from the China Southern Power Grid Company. The structural parameters of transmission lines, such as the average line-to-ground height, the line-to-line distance, and the line-to-tree height, are calculated based on the laser point cloud data to assess the insulation breakdown risk.
In cases of wildfires occurring within a transmission corridor, the degree of impact on the insulation of transmission lines is directly proportional to the proximity of the wildfire to the transmission line. According to DL/T 1620-2016, the wildfire risk for transmission lines can be evaluated at a range of 1 km (National Energy Administration of China, 2016). Therefore, the study area was subdivided into 1 km × 1 km grids. The data of wildfire-related factors is collected and preprocessed within these grids. For the data with a spatial resolution of larger than 1 km × 1 km, such as annual precipitation and temperature, the kriging method is employed for interpolation. After that, the data of wildfire-related factors are classified into four levels based on the quantile method. The classification standard of wildfire-related factors was listed in Table 1.
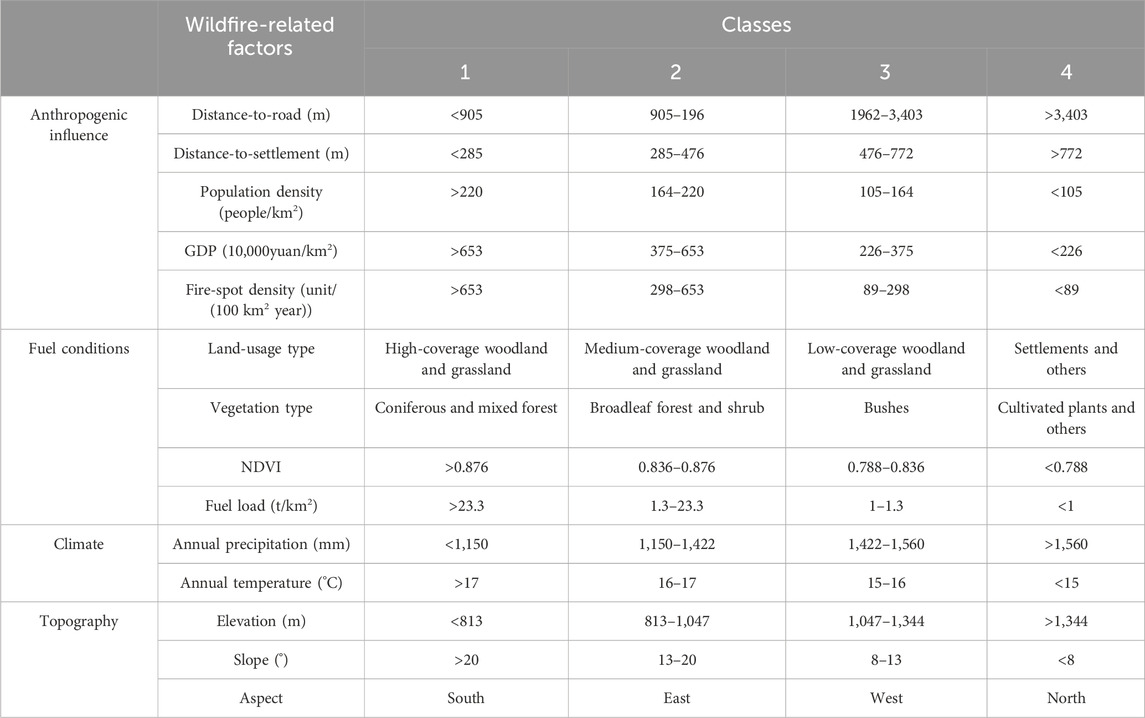
TABLE 1. Classification standards of wildfire-related factors.
The Bayes Network (BN) serves as a robust tool for risk assessment, providing an evaluation of hazard likelihood through statistical analysis. Notably, it offers enhanced interpretability compared to other data mining models. Consequently, a BN model was established to evaluate the potential occurrence of wildfires based on wildfire-related factors. This model is described as a graphical cause-and-effect representation, linking variables through conditional probabilities (Requejo et al., 2019).
The BN structure comprises two key components: a directed acyclic graph and conditional probability tables. The directed acyclic graph represents the probabilistic dependencies between pairs of wildfire-related factors or between these factors and wildfire incidence. It is noteworthy that taking into account correlations between factors elevates the computational complexity of the model. However, in certain application scenarios where there is weak correlation between factors or a limited number of factors, assuming independence among factors also allows the model to achieve acceptable performance. To address this, a conditional independence assumption is incorporated, simplifying the BN model into a Naïve Bayes Network (NBN), as illustrated in Figure 4.where, C is the class node, representing the class of fire or non-fire; Node denotes one of the wildfire-related factors. The conditional probability of C is estimated by Eq. 2.
where C1 is the class of wildfire; C2 is the class of non-wildfire.
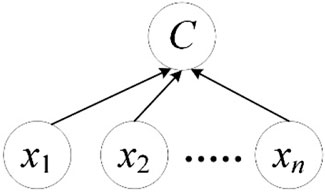
FIGURE 4. NBN structure.
Firstly, the grids experiencing wildfire incidents between 2015 and 2019 are used as wildfire samples. A corresponding set of grids, equating in number and situated beyond a 3 km radius from the fire-affected areas, is randomly chosen to serve as non-wildfire samples. Subsequently, the sample set is partitioned into a training set and a validation set, adhering to a ratio of 7:3. And the wildfire incidents occurring in 2020 are expressly retained to validate the predictive efficacy of the NBN model.
Secondly, the conditional probability tables of wildfire-related factors are calculated by the training set. To mitigate the redundant information, the Relief algorithm is used to rank the importance of wildfire-related factors. The NBN model is optimized by the heuristic search strategy, in which the least important factor is deleted one by one (Chen et al., 2021). During the optimization, a
where Pr and Pe represents the Recall and Precision obtained from the confusion matrix (Woznicki et al., 2019). The
The importance rank of wildfire-related factors is shown in Figure 5. The Distance-to-settlement, Vegetation type, Distance-to-road are the top three important factors affecting wildfire occurrence. The Vegetation type determines the flammability of combustibles, affecting the difficulty of wildfire ignition directly. The factors NDVI and fuel load serve as indicators of combustible quantities, predominantly influencing the spread of wildfires while exerting minimal influence on the likelihood of wildfire occurrence.
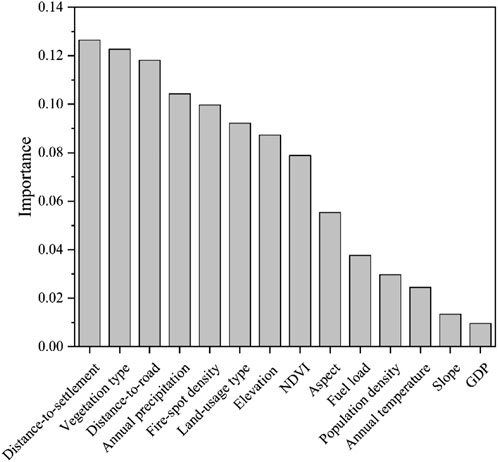
FIGURE 5. Importance rank of wildfire-related factors.
Considering the fact that more than 95% of wildfires are man-made, the factors representing human activities, such as distance to settlement and distance to road, are particularly important. The importance analysis of wildfire-related factors indicates that the area with abundant flammable plants and human activities is prone to ignition.
As the number of wildfire-related factors decreases from 14 to 8, there is a gradual increase in the
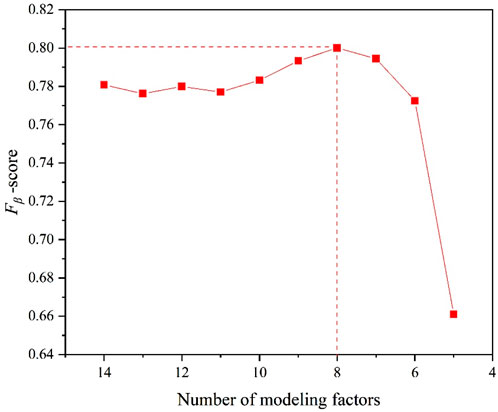
FIGURE 6.
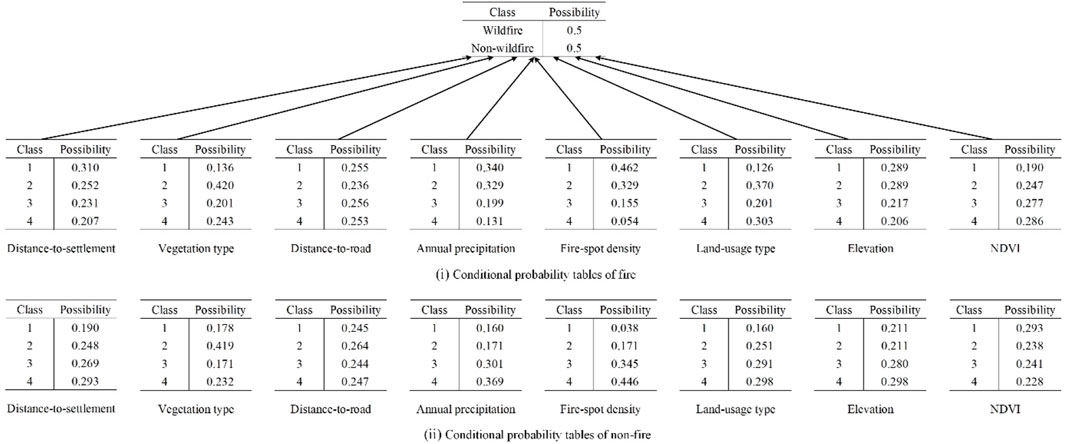
FIGURE 7. Conditional probability tables of optimized NBN model.
When a wildfire occurs in a transmission corridor, the reduction of air insulation can induce two kinds of tripping failures of transmission lines, namely, line-to-ground and line-to-line breakdowns. Thus, the insulation breakdown risk Rt_f is defined as the greater of the line-to-ground breakdown risk Rg and the line-to-line breakdown risk Rp, as shown in Eqs 4–6.
where U is the operating voltage of transmission line; Ug and Up represent the withstand voltage of the air gap of line-to-ground and of line-to-line under wildfire condition, respectively.
The impact of a flame on the reduction of air gap insulation is strongly related to the combustion strength (You et al., 2011). The combustion process engenders substantial charge carriers through thermal ionization and chemical dissociation, resulting in a high conductivity within the bulk of the flame. Once the flame bridges the entirety of the air gap in either line-to-ground or line-to-line, it is easy to further cause a breakdown, thereby instigating the tripping failure of the transmission line. Even in the cases where the air gap is not fully bridged by the flame, the insulation of the remaining gap would also be greatly reduced by the ash and high temperature in fume (Li et al., 2016). Therefore, the following two different scenarios are considered based on the combustion height of flame.
When the height of the flame surpasses that of the transmission line (Figure 8), the entirety of the insulation of both line-to-ground and line-to-line becomes bridged by the flame. Ignoring the insulation of alive trees, whose surface conductivity is generally higher than 0.1 S/m (H. Zhou et al., 2018), the insulations of transmission line are determined by the length of gap and the breakdown field strength of flame Ef.
where Hl is the minimum height of the transmission line; Ht is the maximum height of trees below the line; dl-t is the minimum length of air gap between transmission line and trees; dp is the minimum length of air gap between wires of the transmission line. According to the experimental breakdown results of long air gap under flame, Ef is taken as 35 kV/m (Fonseca et al., 1990).
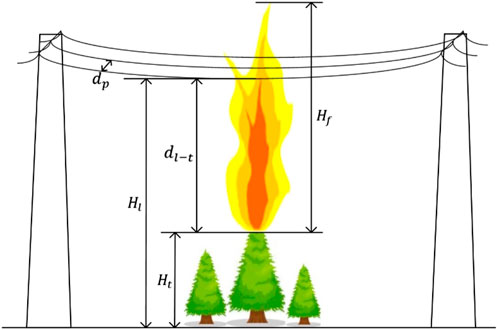
FIGURE 8. Flame bridges air gap between lines and trees.
When the height of flame is lower than that of the transmission line, the insulation gap for line-to-ground encompasses a segment occupied by flames and another by fumes, as shown in Figure 9. The withstand voltage of line-to-ground gap is then determined by
where Hf is the possible height of flame, which can be evaluated by the flame combustion model. And Es is the average breakdown field strength of fume, which can be obtained by the breakdown field strength amendment of long air gap.
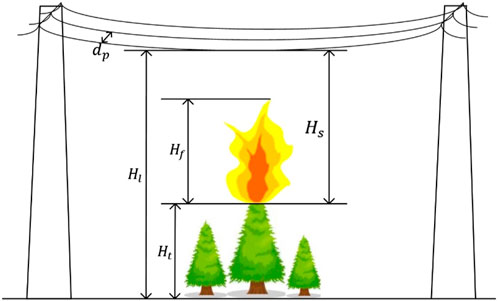
FIGURE 9. Flame partially bridges air gap between lines and trees.
In the most severe case, the air gaps between wires of transmission line are filled wrapped by the fume. Hence, the withstand voltage of line-to-line gap is approximated by
The process of wildfire spread is extremely complicated, depending on the condition of surface fuels and meteorological factors (Benali et al., 2016). Several flame combustion models have been established empirically or semi-empirically, such as McArthur’s model for grassland fires and forest fires in Australia (Noble et al., 1980) and Rothermel’s model for homogeneous and deceased vegetation (Pyne, 1984). Nonetheless, these models are either inadequate for the typical vegetation in Southern of China, or fall short in meeting accuracy criteria due to the requisite homogeneity in practical forest settings. Wang Zhengfei’s model, introduced in 1989, was semi-empirically derived through physical mechanics analysis and based on over 100 field experiments in China (Perry, 1998). Featuring adaptable input parameters, Wang Zhengfei’s model adeptly forecasts wildfire behaviors and finds extensive application in assessing wildfire risks in China.
As mentioned above, the height of flame Hf is an essential parameter that affects the breakdown risk of the air gap. In Wang Zhengfei’s model, the flame height can be estimated by
where I is the front-line intensity, which is the energy liberated in time and linear space (W·m-1s-1) during the combustion. The value of front-line intensity is determined by the calorific power q (kJ·kg-1) of the combustible material at the underlying surface, the fuel load W (kg·m-2) of the combustible material, and the propagating speed of the fire (m·s-1) (Byram, 1959; Perry, 1998).
where Kc is the fuel coefficient, which depends on the spatial distribution of fuel type, as listed in Table 2;
where
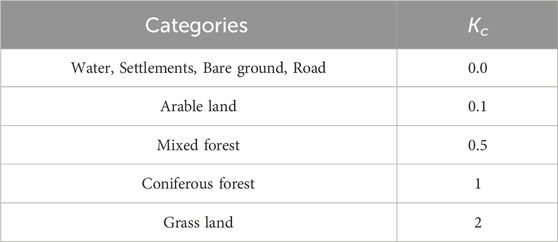
TABLE 2. Values of fuel coefficient (Sun et al., 2012).
R0 is a semi-empirical initial spread of wildfire in Wang zhengfei’s model. It is defined as the rate of fire spread through a homogeneous fuel field in the absence of wind and topography, and is formulated as (16). In this work, empirical coefficients
In summary, the possible height of flame can be estimated by
Even if the flame fails to bridge the gap, the fumes released from the combustion are highly likely to envelop the space around the wires of transmission lines. On one hand, the elevated temperature of the flame decreases the density and humidity of the air within the fume, facilitating the development of electron avalanches (Mphale et al., 2010; Sun et al., 2012). On the other hand, floating particles and ash from the fume drift into the high-electric-field area near the wires, further distorting the electric field distribution and instigating discharge. Hence, based on the adjustments in density and humidity, a particle coefficient Kp is introduced to modify the breakdown strength of air gap (Wang et al., 2011; Li et al., 2016).
where Es is the average breakdown strength of fume;
The triggering effect of ash particles on discharge depends on the type of burning vegetation. Experimental results show that the AC breakdown voltage of the air gap, influenced by the ashes and particles released by the combustion of thatch and fir branch, can reduce to approximately 40% of that observed under the standard atmosphere (Li et al., 2016). Therefore, the particle coefficient Kp is taken as 0.4.
The density coefficient
where m is the correction index, which is associated with electrode shape, gap length, voltage type, and other factor, and is simplified to 1; Pa is the ambient pressure, and Ta is the ambient temperature; Pf represent the changed atmospheric pressure above the flame. Assuming that the heating is a long-term process affecting the air above the flame, the local pressure remains essentially unchanged in open space, that is
where Hs is the height of the calculated position relative to the canopy. In the case of line-to-ground breakdown, the median height of the flame is considered, that is
The humidity coefficient of air is expressed as
where w is an exponent parameter, which is related to gap length, electrode shape, voltage type and other factor, and is simplified to 1; k depends on the voltage type and is determined by the ratio of absolute humidity h to the air density
To determine the standard breakdown field strength Ea, two different breakdown mechanisms are concerned. For short distance, the breakdown of the air gap is governed by the propagation of streamer. The breakdown field strength Ea is regarded as nearly independent of the gap length, and is assigned a value of 241.39 kV/m. As the gap distance increases, the electric field around the transmission line creates conditions for the inception and propagation of a continuous leader, which exhibits significantly higher conductivity compared to the streamer (Gallimberti, 1979). For air gaps exceeding 4 m, the Rizk semi-empirical model (Rizk, 1989a; Rizk, 1989b) is employed to determine the breakdown strength, as expressed in Eq 24.
where ds is the gap length. In summary, the average breakdown strength of fume Es is expressed as
The spatial distributions of factors are shown in Figure 10. The elevation in Guizhou Province gradually increases from east to west, accompanied by a corresponding rise in precipitation from west to east due to elevation and topography. Predominantly, the area features moderate grassland and woodland, with settlements concentrated in the eastern and northern regions. Consequently, vegetation in the east and north is characterized by cultivated plants and bushes, while the west and south boast significant woodland. The southwest region of Guizhou Province experiences a heightened frequency of wildfires, contrasting with fewer occurrences in the eastern and northern areas. The province’s population centers predominantly lie in the north, contrary to historical fire density. This may be attributed to densely populated cities in the north, making it challenging for fires to escalate into large-scale incidents, as they are promptly detected and artificially extinguished. This underscores the need for increased focus on wildfire prevention and control in the southwest. The intricate nature of the distribution of factors related to wildfires makes it challenging to evaluate the risk of wildfires in specific regions through simplistic regional statistical methods.
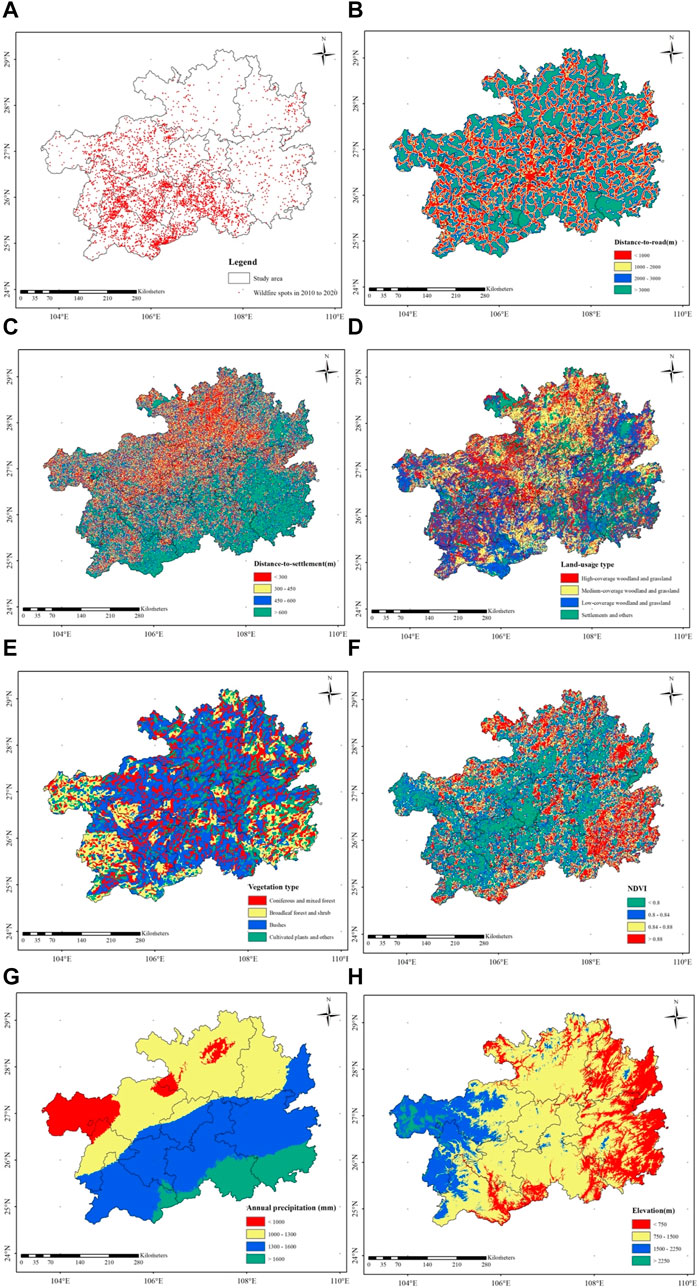
FIGURE 10. Spatial distributions of factors in the study area. (A) Wildfire spots in 2010 to 2020; (B) Distance-to-road; (C) Distance-to-settlement; (D) Land-usage type; (E) Vegetation; (F) NDVI; (G) Annual precipitation; (H) Elevation.
The established NBN model was used to calculate the wildfire occurrence probabilities across all grids within the study area. And the results were spatially visualized using ArcGIS 10.5 software with ArcMap module function. During the process of drawing the map, the wildfire occurrence probability is divided into four intervals of (0, 0.25], (0.25,0.5], (0.5,0.75] and (0.75, 1]. And the grids are given different shades of gray from light to dark depending on the intervals, as shown in Figure 11. Regions exhibiting higher probability of wildfire occurrence are primarily concentrated in the southwest zone of Guizhou province. These areas feature a pronounced abundance of fuel loads, thereby providing favorable conditions for ignition. Conversely, the central and northern parts of Guizhou consist predominantly of urban areas characterized by high population density and relatively low vegetation coverage. Consequently, the likelihood of large-scale or prolonged fires is diminished in these areas, resulting in lower probabilities of wildfire occurrences.
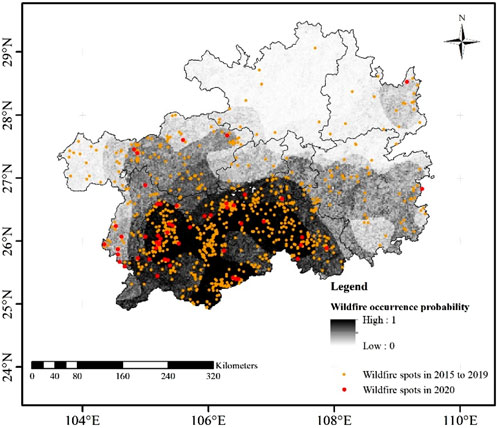
FIGURE 11. Wildfire occurrence probability in the study area.
To verify the model’s applicability, the wildfire incidents spanning the years 2015–2020 were superimposed in the wildfire occurrence probability map. Specifically, 80.77% of the wildfires occurred in areas with a high probability of wildfire incidence (50%), underscoring the high precision and predictive capability of the NBN model in forecasting wildfire events.
Subsequently, based on the laser point cloud data, the insulation breakdown risks for all transmission line sections above 110 kV in the Guizhou Power Grid were computed. Multiplying these risks by the occurrence probability of wildfires yielded the final wildfire-related tripping risks for the transmission line sections. For visual representation, the risk values were categorized into four levels, each denoted by distinct colors as outlined in Table 3. The wildfire-related tripping risk levels in the Guizhou Power Grid were distributed as follows: 42.73%, 20.36%, 21.35%, and 15.56% respectively (see Figure 12). This signifies that the proposed method adeptly discriminates the wildfire risk distribution along transmission corridors.
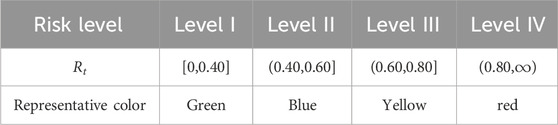
TABLE 3. The grading standard of risk levels.
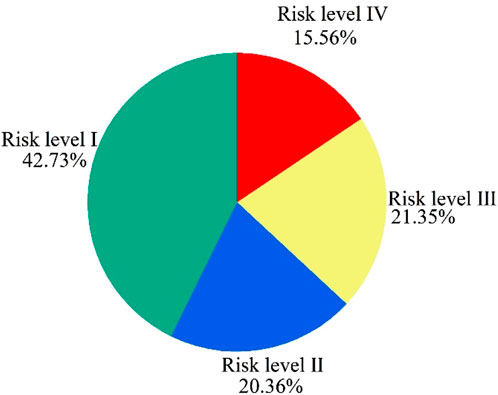
FIGURE 12. Risk level percentage of transmission line section.
To further illustrate the method’s efficacy, the 220 kV Yanwan line is taken as an illustrative case study. This transmission line spans from north to south, traversing the provincial capital city and its adjacent counties, comprising a total of 68 transmission towers. The distribution of risk levels among line sections is as follows: 17.91% for Level I, 38.81% for Level II, 34.33% for Level III, and 8.95% for Level IV (Figure 13). Specifically, line sections associated with the 10th-13th towers and the 26th-29th towers are identified as having a risk level IV. For line sections categorized as risk levels III and IV, it is imperative for the power supply bureau to enhance patrols and monitoring in the vicinity, mitigating the potential impact of wildfires and averting tripping failures.
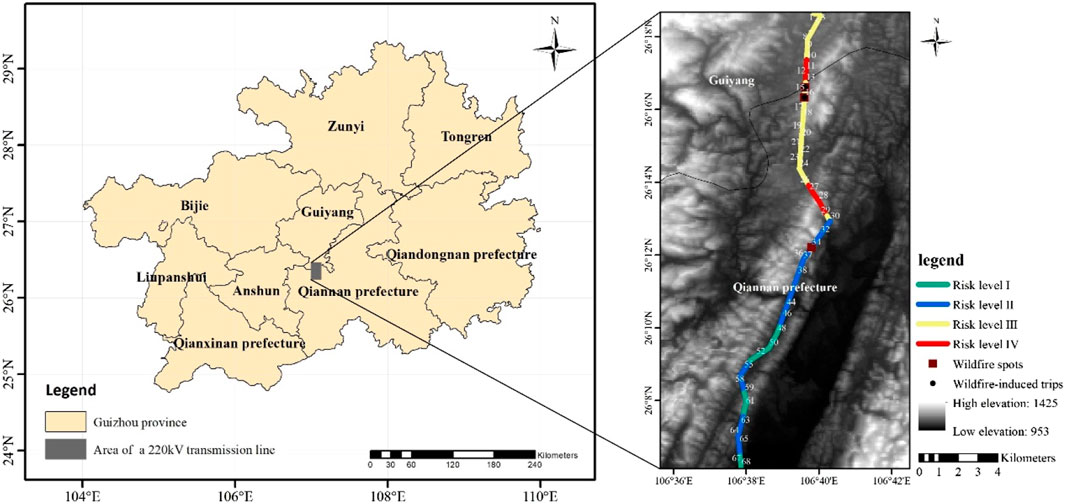
FIGURE 13. The location and risk level distribution of a 220 kV Yanwan line.
In the spring of 2020, two wildfire incidences transpired within the transmission corridor of the Yanwan line. One of them is monitored around 9:00 a.m. on February 28th within the line section encompassing the 34th-35th towers. Prompt intervention by the relevant departments led to its extinguishment by approximately 11:00 a.m. An assessment based on the probability distribution map of wildfire occurrences revealed a remarkably high probability of 97.89% for this specific line section. But the transmission line continued normal operation during the wildfire due to the underlying surface predominantly covered by grass, possessing a low fuel load of 1.25 t/hm2. When ignited, the grass generated a maximum flame height of merely 0.43 m, causing minimal impact on the insulation of the transmission line. Consequently, the risk evaluation attributed a wildfire-induced tripping risk of 0.43, categorizing it as a level II risk within this line section.
Subsequently, at 14:00 p.m. on April 15th, another wildfire emerged within the transmission corridor, this time between the 14th and the 15th tower. Within a span of 2 h, the wildfire swiftly spread to the 16th tower, leading to a tripping failure of transmission line. The intensity of the blaze hindered successful reclosing, resulting in a partial power outage that inflicted substantial economic losses upon the Guizhou power grid. Investigation revealed the proliferation of oil-bearing coniferous forests beneath the transmission lines in these sections, with a canopy height of 15 m, leaving a minimal gap distance of 8 m from the transmission line. The wildfire-induced tripping risk was assessed at 0.65, thereby classifying it as a risk level III.
The actual consequences of the above two wildfire accidents coincided with wildfire-induced tripping risk of the corresponding line sections, indicating a good applicability of the proposed method. Currently, the model has successfully developed software and integrated into the Southern Power Grid Wildfire Monitoring and Early Warning Center. This software performs automatic annual updates to the distribution map, detailing the occurrence probability of wildfires in each province and the associated tripping risk for transmission lines. It serves as a guide for local power grid operation and maintenance departments, directing heightened inspection efforts in areas prone to wildfires and specific line sections with elevated tripping risk. For the fire-spots monitored by satellites in real-time, this software provides the hazard level of the fire-spot on the transmission line. This information aids grid operation and maintenance departments in making informed decisions, including options for firefighting measures or the preemptive shutdown of transmission lines.
This paper introduces an innovative method for evaluating the risk of wildfire-induced tripping on transmission lines. The methodology comprises two key components: wildfire occurrence probability and insulation breakdown risk. In the first segment, a NBN model, coupled with extensive remote sensing data, is employed to rapidly estimate the likelihood of wildfire occurrence across each grid. By utilizing eight optimized wildfire-related factors, the model achieves a prediction accuracy of 80.77%. The ArcGIS software facilitates the visualization of wildfire probabilities, aiding relevant departments in swiftly identifying high-incidence areas. The second part focuses on assessing the insulation tripping risk of transmission lines. Leveraging Wang Zhengfei’s combustion model, the flame height in the transmission corridor during a wildfire event is determined. The insulation of the transmission line is classified into two scenarios—Flame bridges entirety of air gap and Flame bridges part of air gap—based on the flame height. Through the refinement of the air breakdown model with flame parameters, the insulation breakdown risk of transmission lines is promptly assessed. This method provides a physical basis for wildfire-induced tripping risk assessment of transmission lines. Application in the Guizhou power grid demonstrates the model’s robust applicability, offering valuable support for decision-making in grid about wildfire prevention and control.
The original contributions presented in the study are included in the article/Supplementary materials, further inquiries can be directed to the corresponding author.
EZ: Data curation, Investigation, Methodology, Resources, Software, Writing–original draft. LW: Investigation, Methodology, Validation, Writing–original draft. RW: Methodology, Software, Writing–review and editing. SL: Conceptualization, Methodology, Visualization, Writing–original draft. YZ: Data curation, Funding acquisition, Validation, Writing–original draft.
The author(s) declare financial support was received for the research, authorship, and/or publication of this article. We thank China Southern Power Grid Corporation Science and technology projects GDKJXM20222559. The authors also thank the National Natural Science Foundation of China for supporting this research under Contract Nos 52177015 and 51607012.
Authors EZ, LW, RW, SL, and YZ were employed by Electric Power Research Institute of Guangdong Power Grid Co., Ltd.
All claims expressed in this article are solely those of the authors and do not necessarily represent those of their affiliated organizations, or those of the publisher, the editors and the reviewers. Any product that may be evaluated in this article, or claim that may be made by its manufacturer, is not guaranteed or endorsed by the publisher.
Benali, A., Ervilha, A. R., Sá, A. C. L., Fernandes, P. M., Pinto, R. M., Trigo, R. M., et al. (2016). Deciphering the impact of uncertainty on the accuracy of large wildfire spread simulations. Sci. Total Environ. 569, 73–85. doi:10.1016/j.scitotenv.2016.06.112
Bian, H., Zhang, J., Li, R., Zhao, H., Wang, X., and Bai, Y. (2021). Risk analysis of tripping accidents of power grid caused by typical natural hazards based on FTA-BN model. Nat. Hazards 106, 1771–1795. doi:10.1007/s11069-021-04510-5
Castagna, J., Senatore, A., Bencardino, M., D'Amore, F., Sprovieri, F., Pirrone, N., et al. (2021). Multiscale assessment of the impact on air quality of an intense wildfire season in southern Italy. Sci. Total Environ. 761, 143271. doi:10.1016/j.scitotenv.2020.143271
Chen, W., Zhou, Y., Zhou, E., Xiang, Z., and Lu, J. (2021). Wildfire risk assessment of transmission-line corridors based on Naïve Bayes network and remote sensing data. Sensors 21 (2), 634. doi:10.3390/s21020634
Dian, S., Cheng, P., Ye, Q., Wu, J., Luo, R., Wang, C., et al. (2016). Integrating wildfires propagation prediction into early warning of electrical transmission line outages. IEEE Access 7, 27586–27603. doi:10.1109/access.2019.2894141
Dios, V., Hedo, J., Camprubí, À. C., Thapa, P., Martínez del Castillo, E., Martínez de Aragón, J., et al. (2021). Climate change induced declines in fuel moisture may turn currently fire-free Pyrenean mountain forests into fire-prone ecosystems. Sci. Total Environ. 797, 149104. doi:10.1016/j.scitotenv.2021.149104
Fonseca, J. R., Tan, A. L., Silva, R. P., Monassi, V., Assuncao, L., Junqueira, W., et al. (1990). Effects of agricultural fires on the performance of overhead transmission lines. IEEE Trans. Power Deliv. 5, 687–694. doi:10.1109/61.53071
Gallimberti, I. (1979). The mechanism of the long spark formation. J. De. Phys. 7 (C7), C7-C193–C7-250. doi:10.1051/jphyscol:19797440
Heskestad, G. (1998). Dynamics of the fire plume. Math. Phys. Eng. Sci. 356 (1748), 2815–2833. doi:10.1098/rsta.1998.0299
Hoffmann, W., Schroeder, W., and Robert, B. J. (2003). Regional feedbacks among fire,climate,and tropical deforestation. J. Geophys. Re-search:Atmospheres 108 (D23). doi:10.1029/2003JD003494
Li, P., Huang, D., Ruan, J., Wei, H., Qin, Z., Long, M., et al. (2016). Influence of forest fire particles on the breakdown characteristics of air gap. IEEE Trans. Dielectr. Electr. Insulation 23, 1974–1984. doi:10.1109/tdei.2016.7556469
Liu, Y., Li, B., Wu, C., Chen, B., and Zhou, T. (2021). Risk warning technology for the whole process of overhead transmission line trip caused by wildfire. Nat. Hazards 107 (1), 195–212. doi:10.1007/s11069-021-04579-y
Lu, J., Guo, J., Yang, L., Feng, T., and Zhang, J. (2016a). Research and application of fire forecasting model for electric transmission lines incorporating meteorological data and human activities. Math. Problems Eng. 2016, 1–10. doi:10.1155/2016/9828676
Lu, J., Zhou, T., Wu, C., Li, B., Tan, Y., and Zhu, Y. (2016b). Fault statistics and analysis of 220 kV and above power transmission line in province-level power grid. High. Volt. Eng. 42 (01), 200–207. doi:10.13336/j.1003-6520.hve.2016.01.026
Millington, J., Romero-Calcerrada, R., Wainwright, J., and Perry, G. (2008). An agent-based model of mediterranean agricultural land-use/cover change for examining wildfire risk. J. Artif. Soc. Soc. Simul. 11 (4). doi:10.1016/j.insmatheco.2008.05.013
Mphale, K. M., Heron, M., Ketlhwaafetse, R., Letsholathebe, D., and Casey, R. (2010). Interferometric measurement of ionization in a grassfire. Meteorology Atmos. Phys. 106 (3), 191–203. doi:10.1007/s00703-010-0061-4
Naido, P., and Swift, D. A. (1993). “Large particle initiated breakdown of an atmospheric air gap: relating to AC power line faults caused by sugar cane fires,” in 8th international symposium on high voltage engineering (Yokohama, Japan: Japanese Electrotechnical Committee), 81–84.
National Energy Administration of China (2016). D/LT 1620—2016 Technical guide for wild fire risk forecast for overhead transmission lines. Beijing, China: China Electric Power Press.
Niu, R., Zhai, P. M., and Sun, M. (2006). Review of forest fire danger meteorological index and its construction method. Mete-orological Mon. 32 (12), 3–9. doi:10.3969/j.issn.1000-0526.2006.12.001
Noble, I. R., Gill, A. M., and Bary, G. A. V. (1980). McArthur's fire-danger meters expressed as equations. Austral Ecol. 5 (2), 201–203. doi:10.1111/j.1442-9993.1980.tb01243.x
Perry, G. L. W. (1998). Current approaches to modelling the spread of wildland fire: a review. Prog. Phys. Geogr. Environ. 22 (2), 222–245. doi:10.1177/030913339802200204
Pyne, S. J. (1984). Introduction to wildland fire. Fire management in the United States. Hoboken, USA: John Wiley and Sons.
Requejo, C. D., Giné, G. R., and Pérez, F. A. (2019). Bayesian network modelling of hierarchical composite indicators. Sci. Total Environ. 668, 936–946. doi:10.1016/j.scitotenv.2019.02.282
Rizk, F. A. M. (1989a). A model for switching impulse leader inception and breakdown of long air-gaps. IEEE Trans. Power Deliv. 4, 596–606. doi:10.1109/61.19251
Rizk, F. A. M. (1989b). Switching impulse strength of air insulation: leader inception criterion. IEEE Trans. Power Deliv. 4, 2187–2195. doi:10.1109/61.35646
Sherstyukov, B. (2002). “Index of forest fire,” in Yearbook of weather, climate and ecology of moscow (Moscow: Moscow State Univ Publ).
Shi, S., Yao, C., Wang, S., and Han, W. (2018). A model design for risk assessment of line tripping caused by wildfires. Sensors 18 (6), 1941. doi:10.3390/s18061941
State Grid Corporation of China (2016). Q/GDW 11643—2016 Drawing guidelines for region distribution map of wildfires near overhead transmission lines. Beijing, China: China Electric Power Press.
Sun, T., Zhang, L., Chen, W., Tang, X., and Qin, Q. (2012). Mountains forest fire spread simulator based on geo-cellular automaton combined with Wang zhengfei velocity model. IEEE J. Sel. Top. Appl. Earth Observations Remote Sens. 6 (4), 1971–1987. doi:10.1109/jstars.2012.2231956
Van, W., and Forest, P. (1987). “Development and structure of the Canadian forest fireweather index system,” in Canadian forestry service forestry technical report (Canada: Canadian Forestry Service).
Wang, J., Yang, Y., Cui, D., Lei, M., Zhang, X., Wang, Q., et al. (2011). GB/T 16927.1-2011, High-voltage test techniques - Part 1: general definitions and test requirements. Beijing, China: China Standard Press.
West, H. J. (1979). “Fire induced flashover of EHV transmission lines,” in IEEE power apparatus and systems winter meeting (New York: IEEE), 1142.
William, A. H., Wilfrid, S., and Robert, B. J. (2003). Regional feedbacks among fire, climate, and tropical deforestation. J. Geophys. Res. 108 (D23). doi:10.1029/2003jd003494
Woznicki, S. A., Baynes, J., Panlasigui, S., Mehaffey, M., and Neale, A. (2019). Development of a spatially complete floodplain map of the conterminous United States using random forest. Sci. Total Environ. 647, 942–953. doi:10.1016/j.scitotenv.2018.07.353
Wu, Y., Xue, Y., Lu, J., Xie, Y., Xu, D., Li, W., et al. (2016). Space-time impact of forest fire on power grid fault probability. Automation Electr. Power Syst. 40 (03), 14–20. doi:10.7500/AEPS20151110015
You, F., Chen, H., Zhang, L., Zhang, Y., Zhou, J., and Zhu, J. (2011). Experimental study on flashover of high-voltage transmission lines induced by wood crib fire. Proc. CSEE 31 (34), 192–197. doi:10.13334/j.0258-8013.pcsee.2011.34.021
Zhou, H., Sun, L., Yang, Y., Liu, C., Liu, T., Xie, P., et al. (2018). Reduction of electric field strength by two species of trees under power transmission lines. J. For. Res. 29, 1415–1422. doi:10.1007/s11676-017-0541-1
Keywords: wildfire occurrence probability, flame height, insulation breakdown risk, risk level, risk distribution
Citation: Zhou E, Wang L, Wei R, Liu S and Zhou Y (2024) A flame combustion model-based wildfire-induced tripping risk assessment approach of transmission lines. Front. Energy Res. 12:1330782. doi: 10.3389/fenrg.2024.1330782
Received: 31 October 2023; Accepted: 10 January 2024;
Published: 19 January 2024.
Edited by:
Yonghui Liu, Hong Kong Polytechnic University, Hong Kong SAR, ChinaReviewed by:
Haitao Zhang, Xi’an Jiaotong University, ChinaCopyright © 2024 Zhou, Wang, Wei, Liu and Zhou. This is an open-access article distributed under the terms of the Creative Commons Attribution License (CC BY). The use, distribution or reproduction in other forums is permitted, provided the original author(s) and the copyright owner(s) are credited and that the original publication in this journal is cited, in accordance with accepted academic practice. No use, distribution or reproduction is permitted which does not comply with these terms.
*Correspondence: Enze Zhou, emhvdV9ka3lAMTYzLmNvbQ==
Disclaimer: All claims expressed in this article are solely those of the authors and do not necessarily represent those of their affiliated organizations, or those of the publisher, the editors and the reviewers. Any product that may be evaluated in this article or claim that may be made by its manufacturer is not guaranteed or endorsed by the publisher.
Research integrity at Frontiers
Learn more about the work of our research integrity team to safeguard the quality of each article we publish.