 Yang Wei1
 Zhengwei Chang
- 1State Grid Sichuan Electric Power Research Institute, Chengdu, China
- 2State Grid Sichuan Electric Power Company, Chengdu, China
- 3Sichuan Provincial Construction Engineering Fire and Survey Design Technology Center, Chengdu, China
With the rapid development of urbanization in China, urban energy consumption increases rapidly, leading to energy shortages and environmental pollution, of which building operational energy consumption carbon emissions (BECCE) account for a large proportion. It has a vital impact on global warming and urban green and sustainable development. Chengdu city in Sichuan Province is taken as the research area in this paper. First, basic information and power data on four types of single buildings, including large-sized buildings, small- and medium-sized buildings, government agencies, and residential buildings, are collected. Second, the characteristics of the four types of buildings are extracted, and the calculation model of BECCE (“electricity-carbon” model) based on particle swarm optimization algorithm–support vector machine (PSO–SVM) is constructed, and the model is trained and verified using the method of five-fold cross-validation. Then, according to the mean absolute error (MAE), root mean square error (RMSE), and R2 evaluation indicators, the constructed “electricity-carbon” model is compared and evaluated. Finally, the generalization ability of the “electricity-carbon” model is verified. The research results show that (1) the “electricity-carbon” model constructed in this paper has a high accuracy rate, and the fitting ability of the PSO–SVM model is significantly better than that of the support vector regression (SVR) model; (2) in the testing stage, the fitting situation of large buildings is the best, and MAE, RMSE, and R2 are 858.7, 1108.6, and 0.91, respectively; and (3) the spatial distribution map of regional BECCE can be quickly obtained using the “electricity-carbon” model constructed in this paper. The “electricity-carbon” model constructed in this paper can provide a scientific reference for building emission reduction.
1 Introduction
With the deepening of urbanization, carbon emissions in the construction sector also increase (Ahmed et al., 2020; Zhao et al., 2022). According to the United Nations Environmental Program and IEA, (2017) and the United Nations Intergovernmental Panel on Climate Change (IPCC), 40% of the total energy use is consumed by the building sector, which accounts for a third of energy-related carbon emissions (IPCC, 2014, europa. eu). In 2018, 9.7 Gt CO2 was emitted from the energy use of buildings in their entire life cycle, accounting for 39% of the total global energy-related CO2 emissions. In addition, the current rapid economic development will further lead to a sharp consumption of energy and a large amount of CO2 emissions in the future. In this context, greenhouse gas emission reduction targets have been proposed by many countries. China’s goal is to achieve a carbon peak in 2030, achieve carbon neutrality in 2060, and finally achieve net-zero CO2 emissions (Wei, 2015; Michael et al., 2016; Mallapaty, 2020).
In the whole life cycle of buildings, building operational energy consumption carbon emissions (BECCE) account for 70% of the carbon emissions, and because the energy consumption of buildings is still increasing, this value is expected to continue to rise (Energy Information Administration, 2020). In order to adjust building energy conservation and emission reduction policies in a timely manner, the rapid and accurate calculation of BECCE has gradually attracted people’s attention (Sztubecka et al., 2020). Nowadays, the methods for estimating BECCE can be divided into two categories: “bottom-up” and “top-down” (Zhao et al., 2021), as it is difficult to extract relevant structural characteristics and detailed energy consumption data from a single building. Therefore, most of the previous studies used the “top-down” method to estimate BECCE (Liu et al., 2020; Zhao et al., 2021), but the data collected by this method have a time lag, and BECCE can only be estimated with a certain error, making it difficult to quickly and accurately measure BECCE. So far, there is no universally accepted real-time calculation method for BECCE, which has gradually become an area of exploration for scholars today.
Electricity is the main energy consumed in the building operation phase (Roeck et al., 2020) because its consumption data are real-time data with a short release time lag and small statistical errors, and it has been gradually applied to research related to carbon emission calculations in Han (2022). In recent years, with the rapid development of artificial intelligence in the field of building carbon emissions, for example, Moraliyage et al. (2022) constructed a repeatable and transparent method for building energy-saving estimation, which uses artificial intelligence (AI) algorithms to improve the performance of the measurement and validation (M&V) protocol. It has been demonstrated to provide a robust and explainable framework for the M&V protocol aimed at achieving net-zero carbon emissions. In the same year, an explainable artificial intelligence model was proposed, which successfully predicted energy use and greenhouse gas emissions of residential buildings and identified the most influential variables as urban form, building geometry, total building area, and natural gas (Zhang et al., 2023). As a highly robust machine learning method, support vector machine (SVM) can solve nonlinear problems well (Seyedzadeh et al., 2020) and is widely used in building energy performance and greenhouse gas emissions. In the SVM model, the selection of the penalty and kernel functions has a great influence on its generalization ability and prediction accuracy. Considering that the particle swarm optimization (PSO) algorithm has the advantages of simple structure and fast convergence, it can be used to optimize the parameters in the SVM (Eseye et al., 2017; Tang et al., 2018; Cuong-Le et al., 2021). To solve the classification prediction problem, Liang et al. (2023) used PSO–SVM to predict low-index media outbursts to improve coal mining efficiency, with a high prediction accuracy of about 90%. Zhang et al. (2023) accurately identified faults in wind turbine power converters using PSO–SVM, and the accuracy of test samples was as high as 98%. Huang et al. (2023) used the PSO–SVM model to solve the fault prediction problem of relay protection equipment, and the results showed that the prediction accuracy of the model for three different devices was at least 91%. At the same time, it was also extensively used in regression problems. Sandeep et al. (2023) compared the superiority of PSO–SVM, SVM, backpropagation neural network (BPNN), and other models in monthly flood flow prediction. Liu et al. (2023) studied the mechanical behavior of carbonate gravel using a mixed PSO–SVM model instead of a large-scale test method, and the results showed the relatively high accuracy of the model.
Based on the above literature, this paper mainly contributes to the following two aspects: (1) obtaining real-time energy consumption data for building operations poses challenges due to inherent delays. Similarly, measuring the BECCE of individual buildings in real time using the carbon emission factor method is complex. Taking into account the unique advantages of easy access and real-time power big data, the carbon emission characteristics of four types of buildings combined with the physical characteristics of buildings are hereby described. (2) The non-linear mapping relationship between power big data, building physical characteristics, and BECCE of a single building was established by the machine learning method, and the “electron-carbon” model was constructed to achieve rapid and accurate BECCE calculation. In this paper, a total of 2,526 individual buildings in Chengdu, including large public buildings, small- and medium-sized public buildings, government offices, and residential buildings, were taken as research objects, and a BECCE rapid measurement method (“electron-carbon “model) based on PSO–SVM was constructed. The structure of this paper is as follows: Section 1 outlines the advantages of power big data and machine learning methods for BECCE measurement; Section 2 mainly collects the power data and building form data (building floor and building area) of 2,526 buildings in Chengdu, Sichuan Province, and discusses the characteristics of different types of buildings; Section 3 constructs the “electricity-carbon” model based on PSO–SVM; Section 4 draws the research conclusion. Then, the discussion and conclusion are presented in Section 5 and Section 6, respectively.
2 Research framework construction
Based on the perspective of building emission reduction, this paper proposes an accurate and rapid BECCE measurement method for real-time detection of carbon emissions during building operation. First, the traditional method (carbon emission factor method) is adopted to calculate the building carbon emissions according to the carbon emission coefficient (Eggleston et al., 2006). Second, a building carbon emission measurement index system is constructed from two aspects of power data and building characteristics, and an “electricity-carbon model” is established by combining machine learning methods. Finally, BECCE is calculated according to the “electricity-carbon” model, and the model results are analyzed. The research framework is shown in Figure 1. The specific steps are as follows:
(1) The traditional method is used to measure carbon emissions. The consumption of five energy sources (coal, natural gas, liquefied petroleum gas, artificial gas, and electricity) in Chengdu’s large buildings, small- and medium-sized public buildings, government agencies, and residential buildings is collected, and based on the carbon emission coefficient of each energy source, the BECCE of each building are calculated.
(2) An “electricity-carbon” model is constructed based on PSO–SVM. The three influencing factors of building electricity consumption, building area, and building floor are extracted as indicators; these indicators are combined with the PSO–SVM algorithm to establish the “electricity-carbon” model; a training set and a verification set are constructed; and the model is evaluated according to the evaluation indicators.
(3) The generalization ability of the “electricity-carbon” model is verified. Based on the building sample data in the test set, the “electricity-carbon” model is used to measure carbon emissions and compared with the actual data to verify the effectiveness of the “electricity-carbon” model.
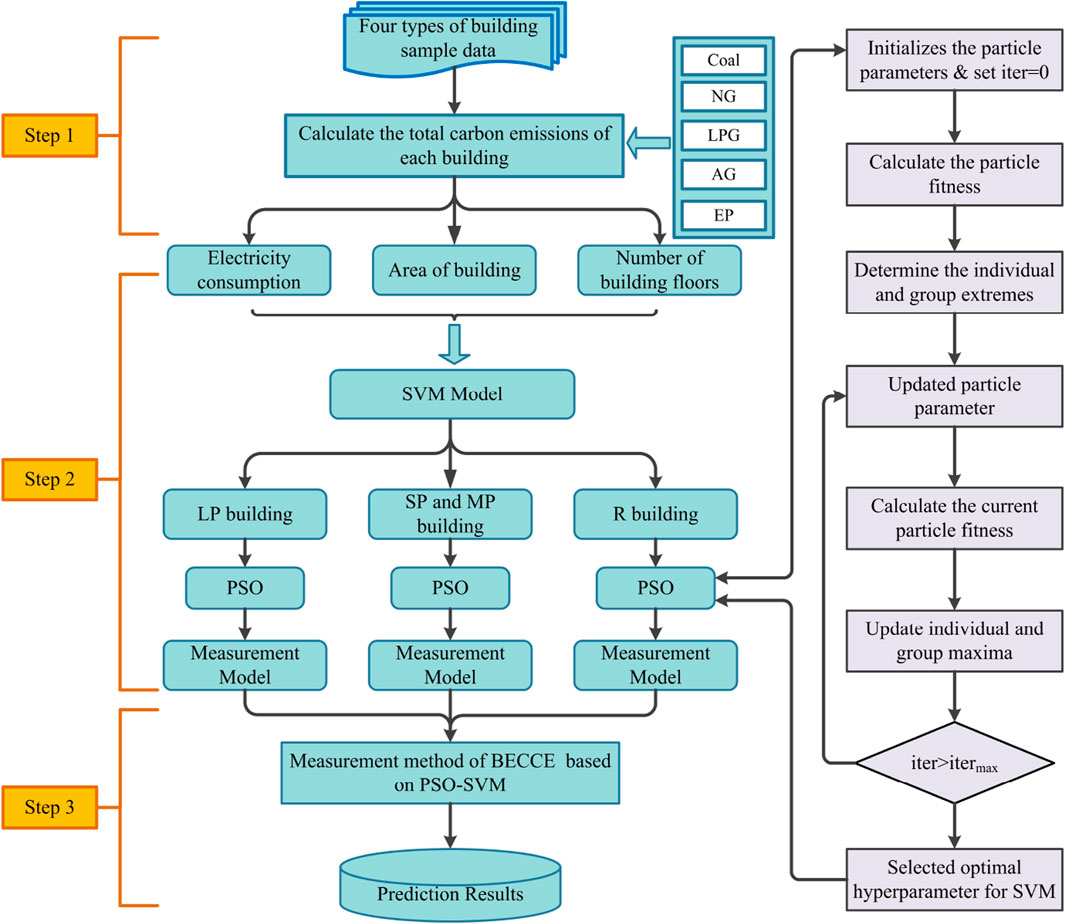
Figure 1. Research framework.
2.1 Study area
Chengdu (102°54'∼104°53′E, 30°05'∼31°26′N) is the capital of Sichuan Province and the political and economic core of southwest China (Figure 2). With a total area of 12121 × 104 square kilometers and a resident population of 21.192 million, its GDP exceeded 273.8 billion U.S. dollars in 2020. Since the 1980s, Chengdu’s urbanization has accelerated. The urban population has increased from 8,225,400 in 1980 to 20.947 million in 2020, while the built-up area has expanded from 60 square kilometers to 977.12 square kilometers in 2021. Building energy consumption is mainly electricity, natural gas, and liquefied petroleum gas. Chengdu’s climate is warm and humid. Since the 1980s, the climate in Chengdu has shown a trend of increasing temperature and drying (Oleson et al., 2013). This indicates that the greenhouse effect in Chengdu has been more obvious. The increase in CO2 emissions in Chengdu is expected to cause more serious climate problems due to the city’s dense population and the increase in the number of buildings. Therefore, it is necessary to make real-time carbon emissions in the building operation stage transparent to reasonably implement the building emission reduction policy. It is of great significance to study the BECCE of the rapid measurement method of regional buildings.
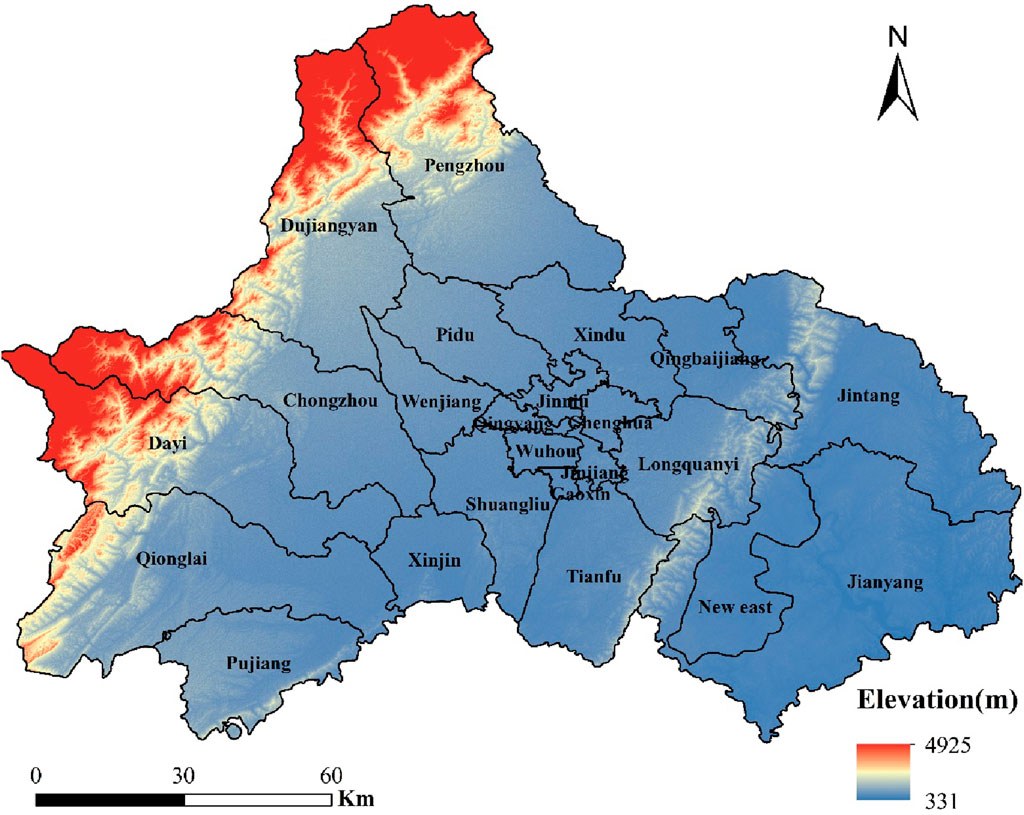
Figure 2. Geographical distribution of Chengdu.
Considering the actual distribution of the four types of buildings in Chengdu, a total of 2,526 building samples were hereby collected from 23 residential areas, including 199 large buildings, 969 small- and medium-sized public buildings, 374 government organs, and 984 residential buildings. Each sample included the building name, address, administrative division, consumption of five types of energy in 2021, floor area, and number of floors. The detailed statistics are shown in Table 1.
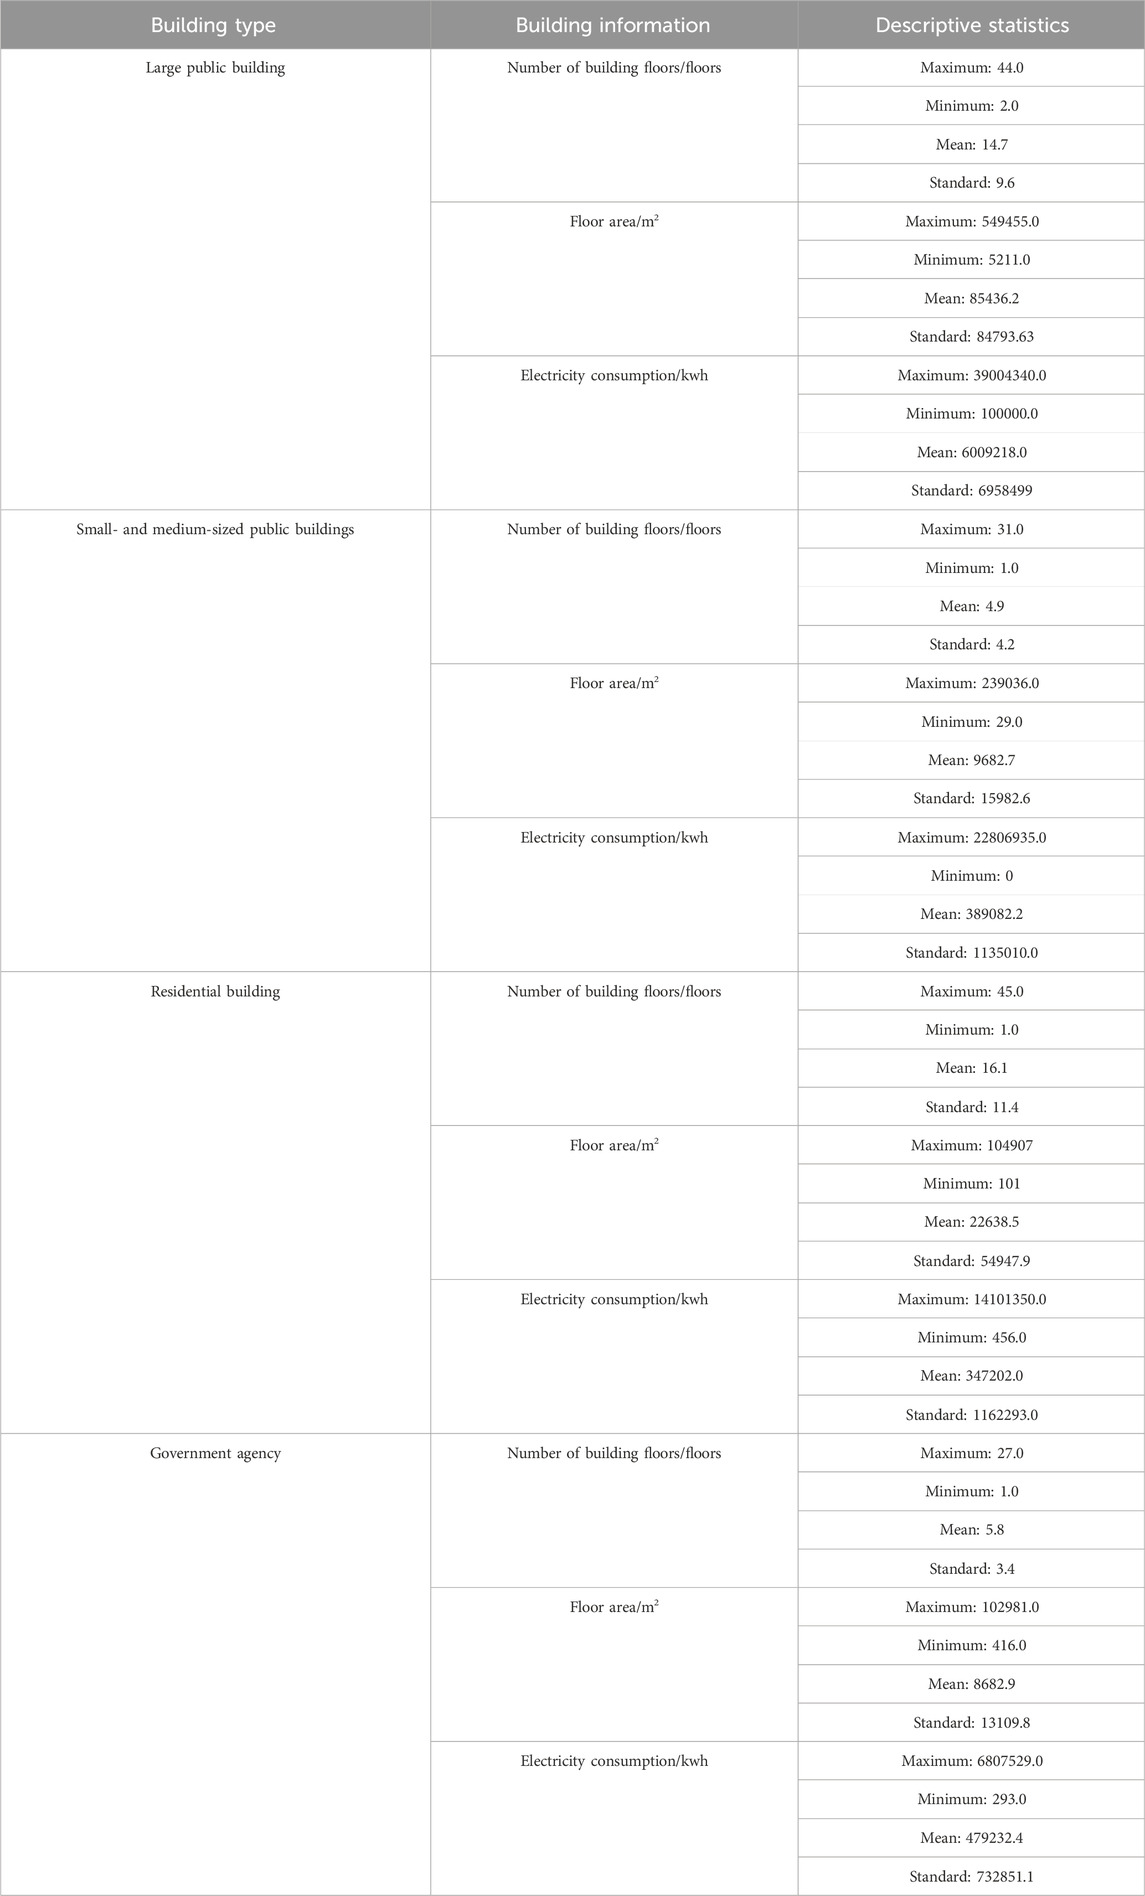
Table 1. Statistical description of building features.
2.2 Calculating district-level building operational energy consumption carbon emissions from different sources
First, BECCE of four types of large buildings, small- and medium-sized buildings, state organ buildings, and residential buildings in each district of Chengdu are calculated according to the IPCC National Greenhouse Gas Inventory guidelines. Given that there is no central heating in Sichuan and the total carbon sink of building green space is small, the calculation formula for the carbon emissions of a specific building in Sichuan within a period of operation (not considering the full life cycle of the operation stage) is as follows:
where
In China, BECCE are mainly produced from primary energy, heating power, and electric power sources (Department of Energy Statistics, 2016). In this paper, five energy sources, including coal, natural gas, liquefied petroleum gas, artificial gas, and electricity, are selected to calculate BECCE in buildings based on the use of the energy structure system in Chengdu. The composition of BECCE can be expressed as follows:
where
The carbon emissions generated by energy use in buildings are calculated as follows:
where
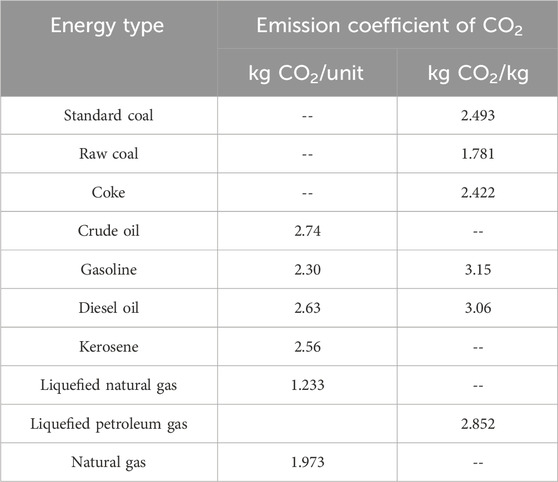
Table 2. Carbon emission coefficient of fossil energy consumption.
The carbon emission coefficient of electric energy is related to the fossil energy used in local mainstream power generation. The carbon emission coefficient of electric energy obtained by different energy types in different regions is also different (Table 3). For example, the carbon emissions of coal-fired power plants using fuel are much higher than those of hydroelectric power plants. According to different energy structures in different regions, the power carbon emission coefficient adopts the average carbon emission factor of the regional power grid published by the state in 2012 (which has not been updated since 2012), as shown in Table 2 (Bai, 2019). The research area in this paper is Chengdu (Sichuan province), and 0.5257 is selected as the carbon emission factor of electric energy.
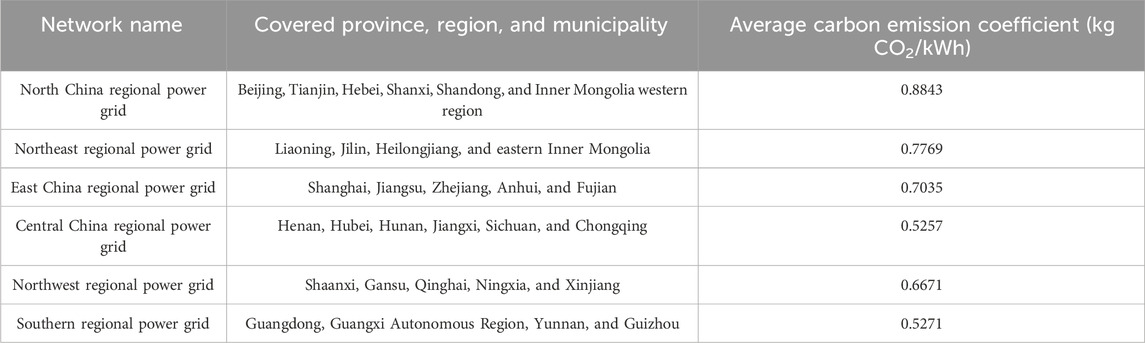
Table 3. Average carbon emission coefficients of the regional power grid in China.
2.3 Selection of predictors for building operational energy consumption carbon emissions
The plane distribution of four different types of buildings in the city was drawn based on a total of 2,526 individual building samples collected in Chengdu, including 23 districts. Figure 3 presents the number of building types in the five major individual building sample collection areas. Jinniu District, as the main central city of Chengdu, has a relatively uniform distribution of large public buildings, small- and medium-sized public buildings, residential buildings, and government offices, thereby making the sample of all types of buildings in this paper more balanced. Compared with Jinniu District, the sampling balance of the other four districts was poor, especially for large public buildings. Given that the energy consumption data of large buildings in the operation stage of the surrounding urban areas were relatively difficult to calculate, there were only four large public buildings in Dujiangyan District and one in Qingbaijiang District.
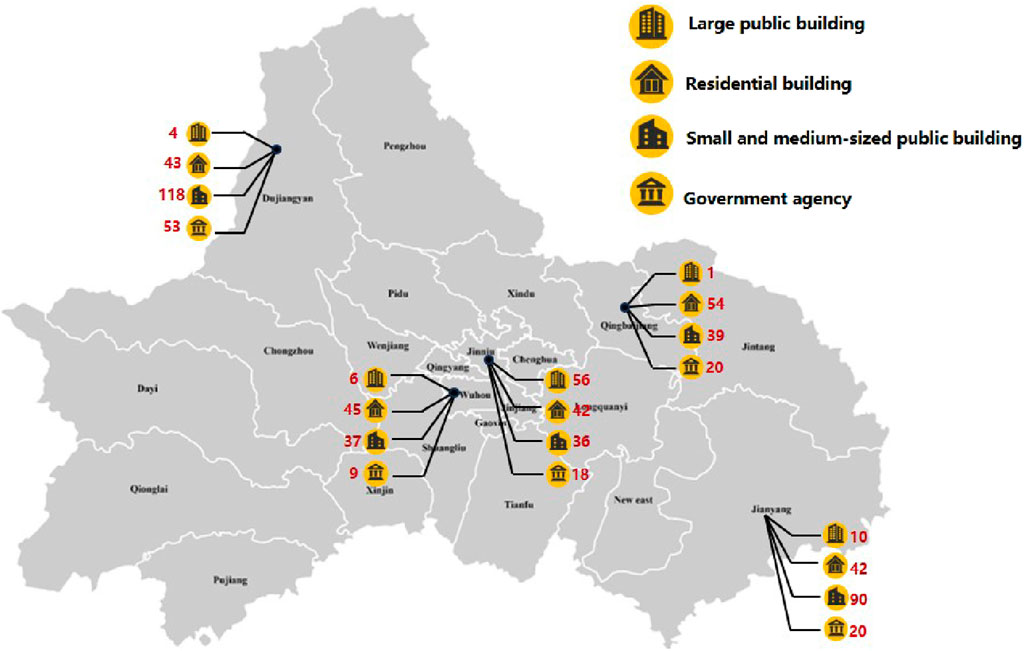
Figure 3. Distribution of individual building samples in Chengdu.
Considering the actual distribution of the four types of buildings in Chengdu, a total of 2,526 samples of various types of buildings in 23 districts are collected in this paper, including 199 large buildings, 969 small- and medium-sized public buildings, 374 state agencies, and 984 residential buildings. Each sample includes the building name, address, administrative division, and the consumption of five kinds of energy in 2021 as well as the building area and the number of floors. The total electricity consumption data and carbon emissions of 2,526 buildings are shown in Figure 4.
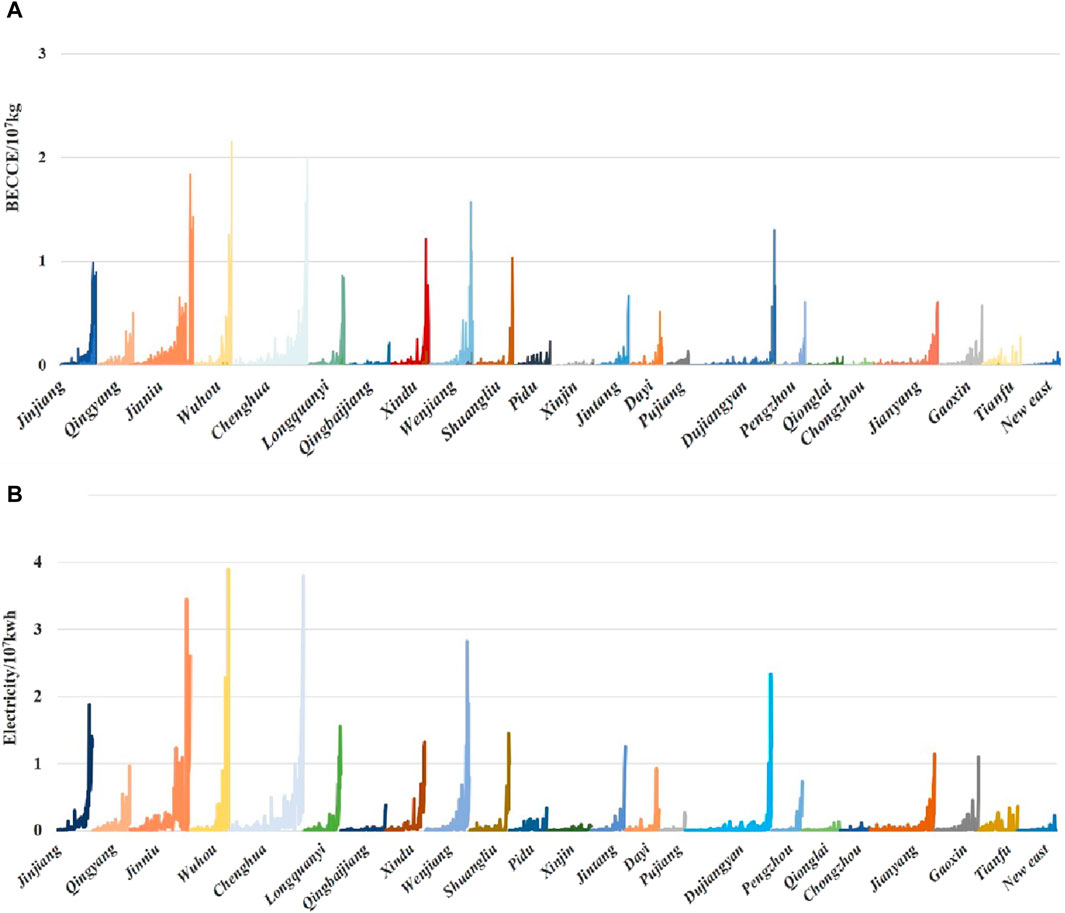
Figure 4. BECCE and power data of buildings in 23 districts of Chengdu. (A) Building operational energy consumption carbon emissions; (B) Electricity consumption.
It can be seen from Figure 3 that the trends of carbon emissions and electricity consumption of each building are basically the same. It can be observed that there is a significant relationship between building electricity consumption and carbon emissions. Among them, Jinniu District, Wuhou District, Chenghua District, Wenjiang District and Dujiangyan generally exhibit high carbon emissions, and the corresponding electricity consumption is also relatively high. Then, according to the carbon emissions of the five energy sources, the carbon emission proportion data of each energy source of the four types of buildings are plotted using a stacked column chart, and Figure 5 is obtained.
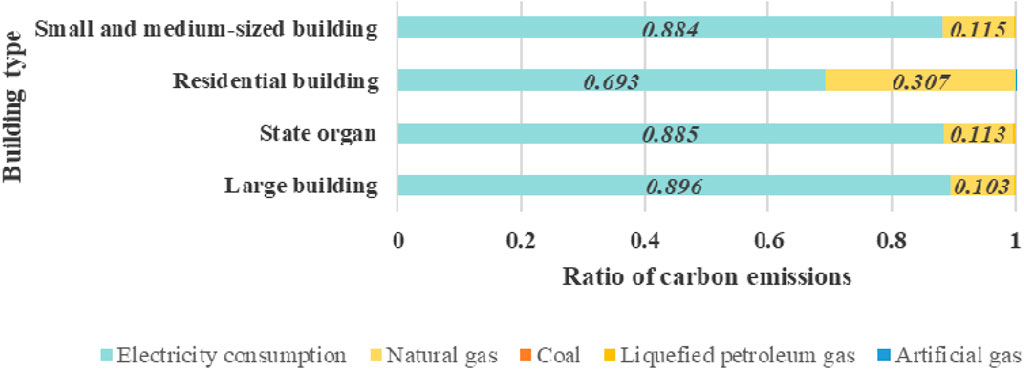
Figure 5. Structure of energy carbon emissions of four types of buildings.
It can be seen from Figure 5 that in addition to the carbon emissions generated by electricity consumption in residential buildings accounting for 69.3%, the carbon emissions generated by electricity consumption in large buildings, small- and medium-sized buildings, and state agencies accounted for 89.6%, 88.4%, and 88.5%, respectively, which are significantly greater than 80%. Except for natural gas, the proportions of coal, liquefied petroleum gas, and artificial gas are relatively low for the other four energy sources. By analyzing the stacked histograms of the four types of building carbon emissions, it can be found that most of the BECCE in Chengdu come from CO2 from electricity and natural gas use.
It can be seen from Figure 4 that the degree of electrification of various buildings in Chengdu is relatively high during the operation phase, but the carbon emissions of other energy sources, such as natural gas, still occupy a certain proportion. It is time-consuming and labor-intensive to conduct real-time and accurate statistics on consumption, so the carbon emissions of buildings cannot be quickly calculated. In order to achieve fast and accurate calculation of BECCE of different types of buildings, according to Figure 3, it can be seen that there is a significant correlation between electricity consumption and BECCE. This paper is based on the power data of Chengdu’s building operation phase, taking into account the different building shapes of different building types, extracting building power data, effective area, and building floors, and a total of three indicators as characteristic variables. The BECCE of the calculation model of different building types based on machine learning is constructed, the complex mapping relationship between building power consumption, building area, building floors, and BECCE during this period is obtained, and the fast and accurate calculation of BECCE through power data is realized.
3 Methods
3.1 Support vector machine
The PSO–SVM model has been widely used in the field of carbon emission prediction due to its excellent fitting ability (Li, 2020; AlKheder and Almusalam, 2022), such as in sewage treatment plants (Szeląg et al., 2023), building carbon emissions (Mao et al., 2019; Gao et al., 2023), transportation industry (Li et al., 2022), and other related CO2 emissions, and has achieved a relatively significant effect.
SVM is a novel small-sample learning method. The specific steps are as follows:
Assuming that the training set consists of N data samples, the regression model associated with SVM can be described as follows:
where
where c represents the positive parameter used to control the empirical error and
3.2 Particle swarm optimization algorithm–support vector machine
Given the impact of the optimal penalty parameter c, kernel function parameter g, and kernel function
where
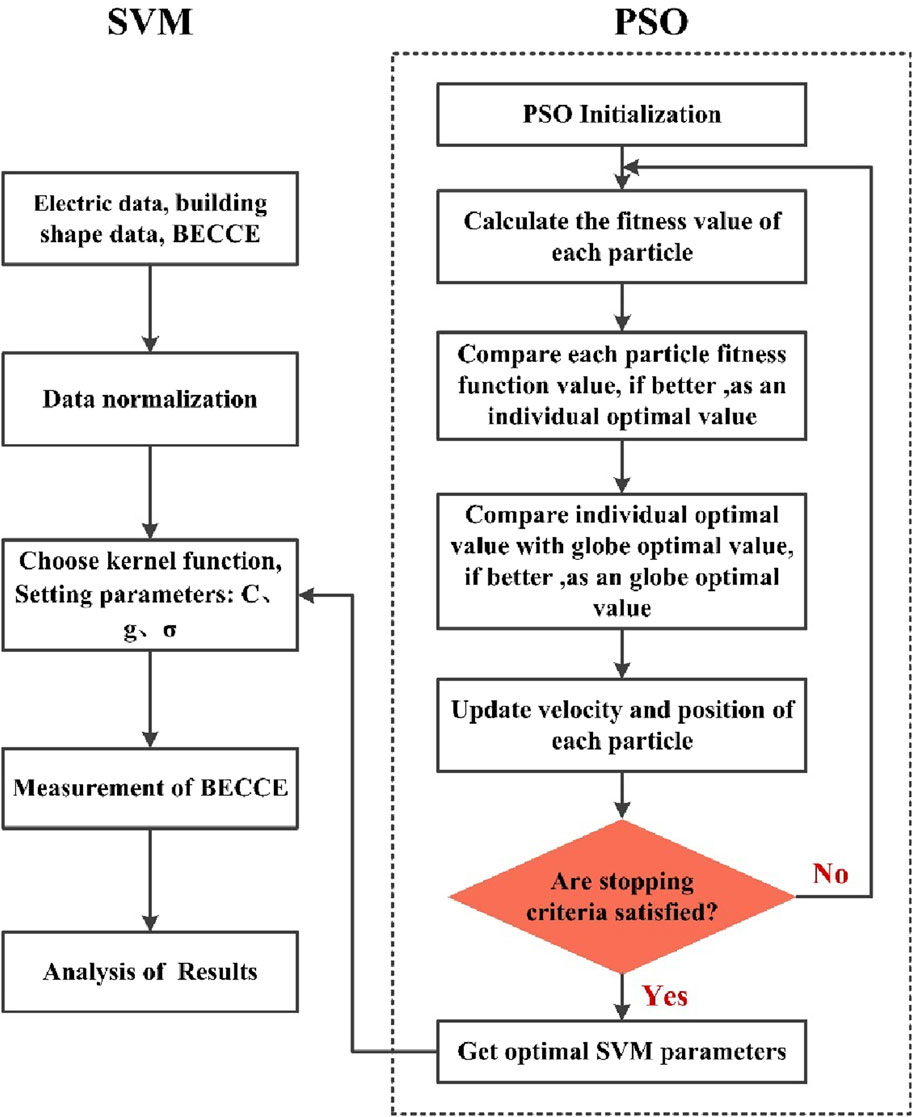
Figure 6. Measurement model of BECCE based on PSO–SVM.
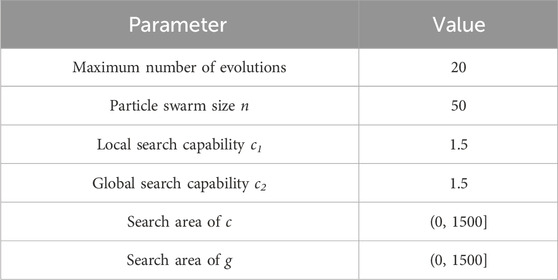
Table 4. PSO parameter settings.
3.3 Evaluation of model performance
Evaluation of model performance is also very important as part of the test of model usability. When judging the degree of model prediction, at least one statistical error indicator and one goodness-of-fit measure should be applied (Nourani et al., 2019). In this study, MAE, RMSE, and R2 were thus used to evaluate the model performance. Among them, MAE can quantify the difference between the expected and observed values, especially ignoring the negative effect. The error of the RMSE measurement model was analyzed in quantitative prediction; R2 quantified the correlation or collinearity between the expected and actual values. MSE is used as the fitness function of PSO. The specific calculation formula is shown in Table 5.
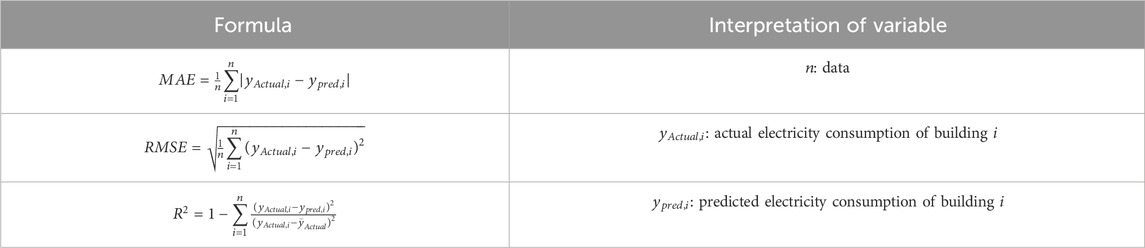
Table 5. Specific model evaluation.
4 Results
4.1 Building volume characteristics of different types of buildings
Due to differences in building types, building shapes (building floor and building area) are inevitably different, which will naturally lead to differences in carbon emissions. In order to improve the accuracy of measurement of building carbon emissions, a more targeted measurement of building carbon emissions is carried out, and the relationship between building shapes and total emissions of four types of buildings is studied. The quadrilateral method is adopted to conduct statistical analysis on the boxplot of building floors, building areas, and carbon emissions of large buildings, government agencies, residential buildings, and small- and medium-sized buildings, as shown in Figure 7.
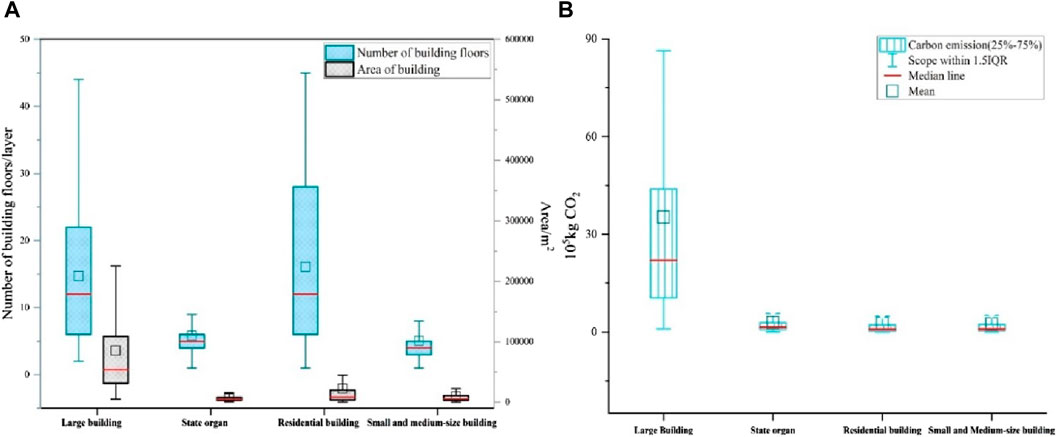
Figure 7. Analysis of the shape and carbon emission characteristics of four types of buildings: (A) boxplot of architectural forms of four kinds of buildings and (B) boxplot of BECCE for four types of buildings.
As shown in Figure 7A, for building floors, the maximum number of floors in large and residential buildings is basically the same. Meanwhile, according to the positions of the lower quartile and median line as well as the upper quartile, large and residential buildings are concentrated on the 6–11th floor, but the floor distribution of residential buildings is more discrete, while the distribution of government agencies and small- and medium-sized buildings is concentrated. For the building area, the large building area is significantly larger than the three types of buildings, mainly distributed between 31258 m2 and 108927 m2. For the other three types of buildings, the residential building area is relatively large. In Figure 7B, it can be clearly seen that the carbon emissions of large buildings are significantly higher than those of the other three types of buildings, while there is no significant difference in the carbon emissions of government agencies, residential buildings, and small- and medium-sized buildings.
Compared with Figures 7A, B, the number of floors and floor area of large buildings, government agencies, and small- and medium-sized buildings can clearly reflect the change in carbon emissions of these three types of buildings. For residential buildings, there is no significant relationship between the building floor and carbon emissions. At the same time, it can be further seen that government agencies and small- and medium-sized buildings have similar architectural shapes, and their structure of energy carbon emissions is basically the same as shown in Figure 5. In this paper, government agencies are included in small- and medium-sized buildings for research.
In order to avoid the generality and inaccuracy of using the same model to predict the carbon emissions of buildings, this paper establishes different “electricity-carbon” models for large and residential buildings. For government agencies and small- and medium-sized buildings, the same “electricity-carbon” model can be established.
4.2 Measurement of building operational energy consumption carbon emissions of different types of buildings based on particle swarm optimization algorithm–support vector machine
Before the BECCE calculation model is established, there are big differences in the digital scale among the three parameters of building floor, building area, and electricity consumption. Therefore, this paper first carries out normalization processing on the dataset to eliminate the impact of dimension and avoid the problem of low accuracy in model construction.
4.2.1 Optimization process
In order to ensure the overall effect of the model, the PSO algorithm is used to find the optimal values of three hyperparameters, such as kernel functions, g and c. In the stage of model training, five-fold cross-validation is used to train and verify the model. A total of 80% of the data in the dataset is used as the model training hyperparameter, and the remaining 20% is used as the verification set to verify the model performance. Finally, the PSO algorithm selects the optimal hyperparameter set according to the effect of the verification set. The dataset partitioning process of the five-fold cross-validation is shown in Figure 8.
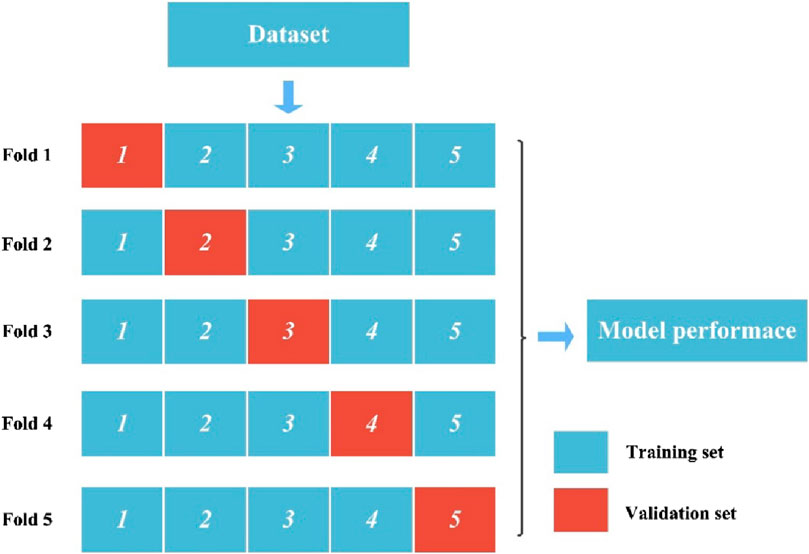
Figure 8. Data division process of five-fold cross-validation.
In the process of PSO hyperparameter optimization, this paper takes the MSE of the verification set as the standard to save the optimal model. The hyperparameter optimization process of the “electricity-carbon” model of three types of buildings, namely, large buildings, residential buildings, and small- and medium-sized buildings, is shown in Figure 9. In the calculation model of large buildings, when the evolution reaches the 14th generation, the fitness function decreases to the minimum, and the model reaches the best state. The combination of hyperparameters of kernel functions, c and g is (linear kernel function, 690.0, 803.2). In the calculation model of small- and medium-sized buildings, the combination of hyperparameters is (linear kernel function, 715.6, 910.6) when the evolution reaches the 13th generation. In the calculation model of residential buildings, the combination of hyperparameters is (polynomial kernel function, 402.4, 588.3) when it evolves to 12 generations.
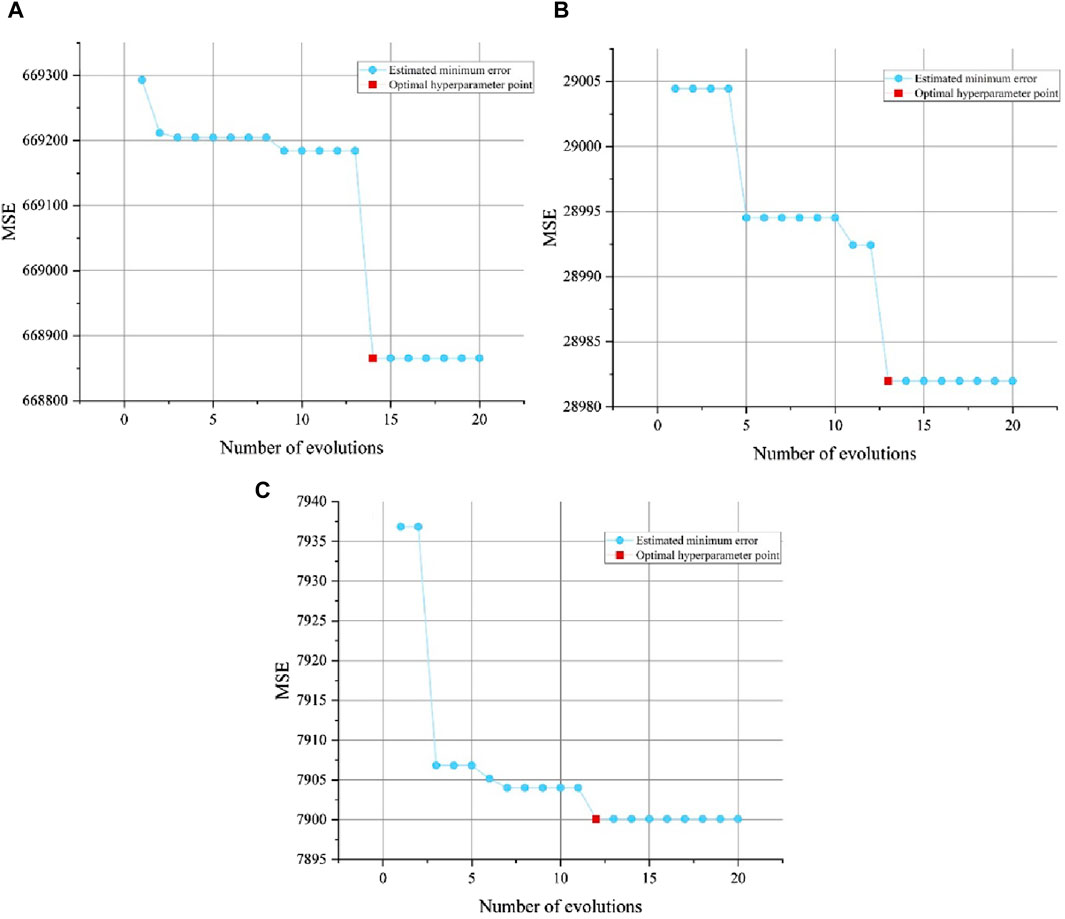
Figure 9. Iterative process of optimal parameters of the model: (A) large buildings; (B) government agencies and small- and medium-sized buildings; and (C) residential buildings.
4.2.2 Performance comparison of support vector regression and particle swarm optimization algorithm–support vector machine models
According to the optimal “electricity-carbon” model of large buildings, small- and medium-sized buildings, and residential buildings, the fitting between the predicted results of their respective verification sets and the actual observed values is visualized, as shown in Figure 10. Then, according to MAE, MSE, R2, and the other three model evaluation indexes, PSO–SVM is compared with support vector regression (SVR) without parameter optimization to verify the reliability of the model.
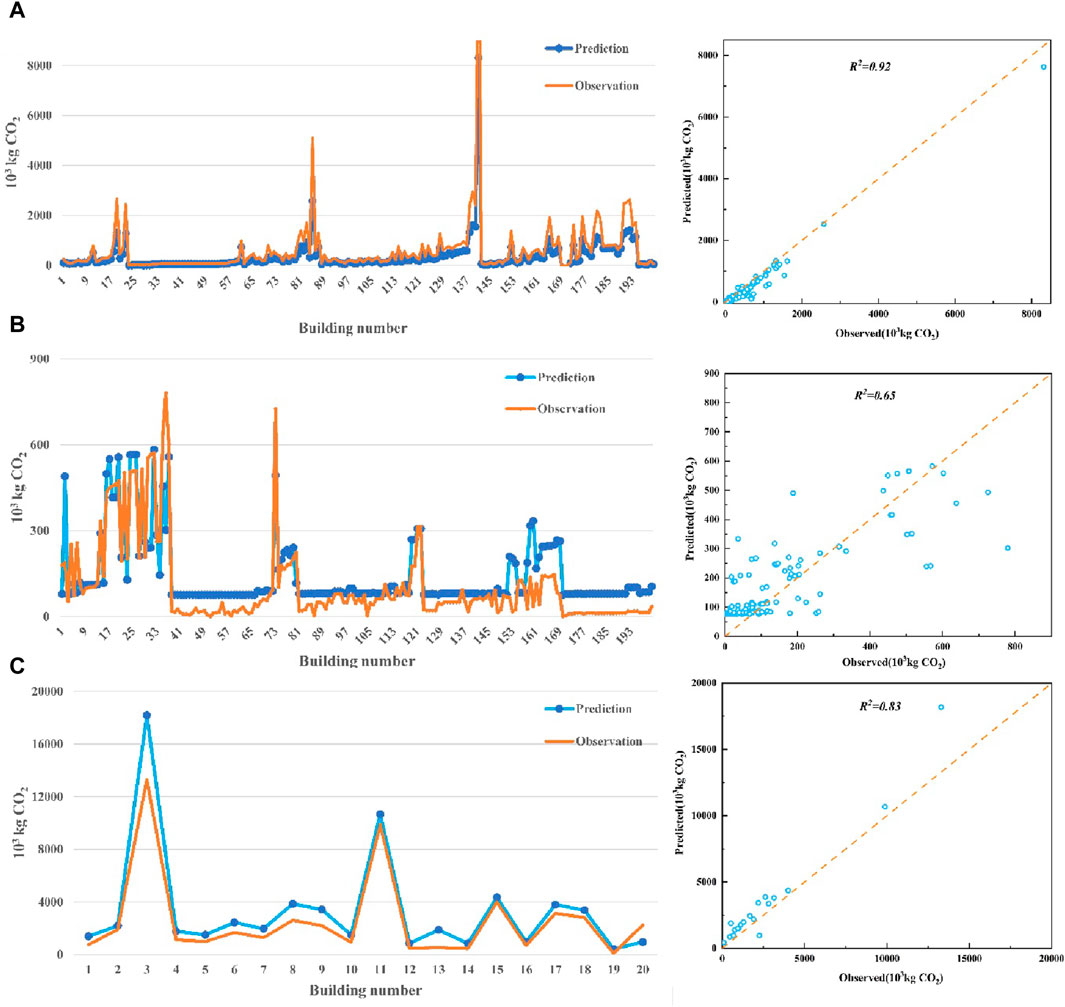
Figure 10. Verification results of the “electricity-carbon” model for four types of buildings: (A) government agencies and small- and medium-sized buildings; (B) residential buildings; and (C) large buildings.
Figure 10 shows that the “electricity-carbon” model has a good effect on the BECCE measurement of small- and medium-sized buildings. The measured value of BECCE is basically consistent with the actual observed value, and R2 = 0.92 also indicates that there is a significant correlation between the predicted and actual observed data. The model also has a good prediction effect on large buildings, and the trend of the line graph between the predicted and actual observed values is basically the same. The prediction effect of the model for residential buildings is relatively poor, R2 = 0.65. It can be seen from Figure 5; Figure 7 that the actual situation of residential buildings is relatively complex, and it is difficult to make a good prediction. However, it can be seen from Figure 8 that the measured values of the “electricity-carbon” model are roughly consistent with the trend of the actual observed values. The evaluation results of the performance indexes of the PSO–SVM and SVR models are shown in Table 6.
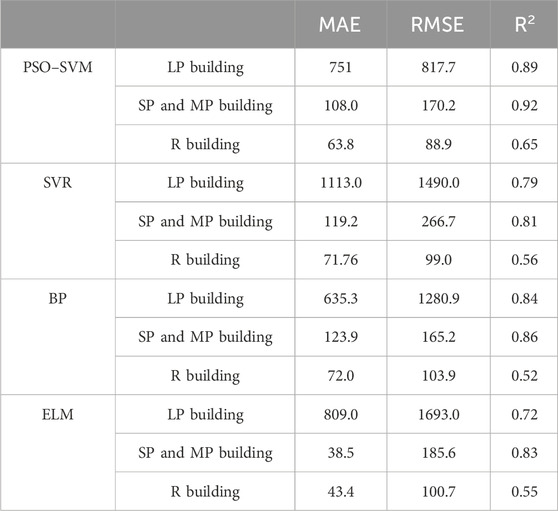
Table 6. Model performance evaluation results.
In this paper, the performance of the PSO–SVM model was compared with that of SVR, BP, and ELM, and the index evaluation results of the four models are shown in Table 6. Table 6 demonstrates PSO optimization as an essential part of model performance improvement. After PSO optimization, two indicators, MAE and RMSE, were significantly reduced compared to their values before optimization, and R2 of each type of building was increased by 0.1 on average. This indicated a significant improvement in the correlation between the measured BECCE and actual values. At the same time, compared with BP and ELM, the PSO–SVM model was found to have the advantages of small-sample learning, thereby being furnished with better fitting ability and thus being more suitable for constructing the “electricity-carbon” model.
4.3 Rapid measurement of building operational energy consumption carbon emissions with different types of buildings
According to the optimal hyperparameter of the three models determined in Section 4.2.1, the “electricity-carbon” model of large buildings, small- and medium-sized buildings, and residential buildings is constructed, respectively. By comparing the SVR model without optimization, PSO–SVM shows good model performance, but the model generalization ability is still difficult to determine. In order to test whether the “electricity-carbon” model can calculate BECCE quickly and accurately, this paper re-extracts the data of various types of buildings, including 21 large buildings, 100 small- and medium-sized buildings, and 100 residential buildings. The above data are input into the constructed “electricity-carbon” model to measure BECCE, and the measured and actual values are compared, as shown in Figure 11.
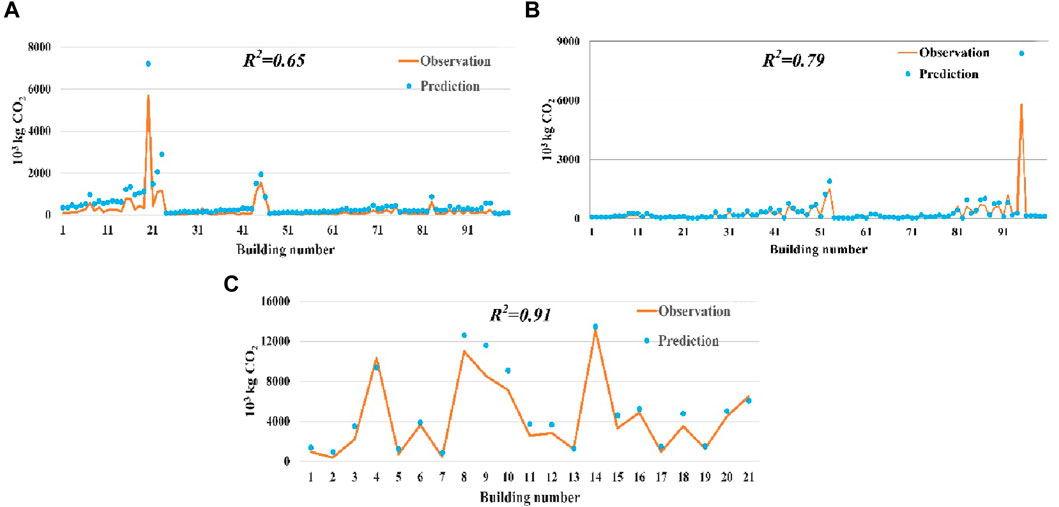
Figure 11. Measurement results of BECCE for four types of buildings: (A) government agencies and small- and medium-sized buildings; (B) residential buildings; and (C) large buildings.
Figure 11 clearly shows the distribution area between the measured and actual values, which can help judge whether the measured result is close to the actual result. According to Figures 11A-C, the distribution area between the measured and actual values is basically consistent. Second, the R2 values of the estimated and real values of small- and medium-sized buildings, residential buildings, and large buildings are 0.65, 0.79, and 0.91, respectively, indicating that the “electricity-carbon” model has good generalization ability.
As can be seen from Table 7, according to MAE and RMSE evaluation results and the analysis of Figure 10, the error of calculation results is also within an acceptable range, so it is feasible.
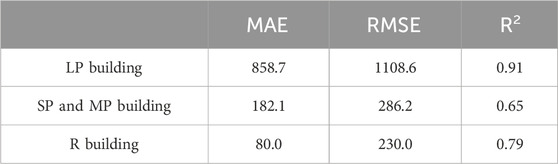
Table 7. Evaluation results of generalization ability.
4.4 Spatial distribution of building operational energy consumption carbon emissions
The calculation results of the “electricity-carbon” model are imported into ArcGIS software to generate the BECCE spatial distribution map, as shown in Figure 12. The central area of Chengdu (Pidu District, Wenjiang District, Chenghua District, Jinniu District, and Wuhou District) has a high carbon emission of buildings, while the surrounding areas have relatively low carbon emissions. Many large shopping malls, office buildings, and other large buildings are located in downtown Chengdu, which may result in BECCE being relatively concentrated in the central part of Chengdu, indicating that the “electricity-carbon” model has a certain reliability in the rapid measurement of BECCE results.
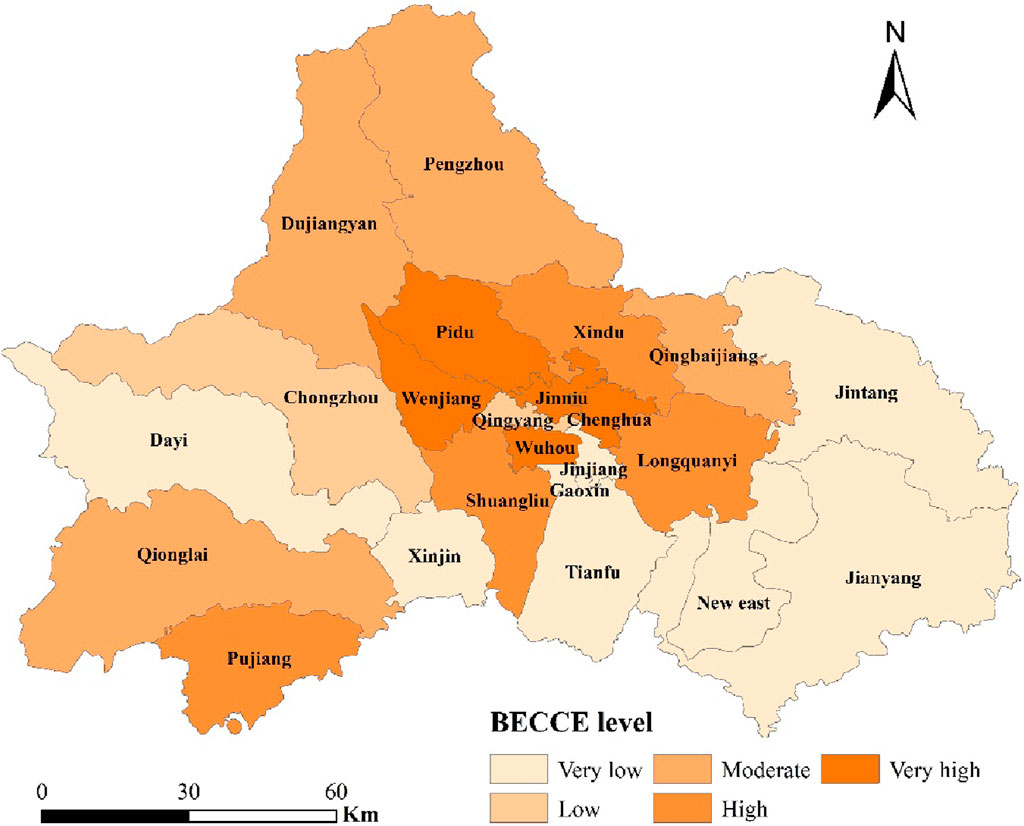
Figure 12. Spatial distribution map of BECCE in Chengdu.
5 Discussion
The rapid development of urbanization in China is accompanied by massive energy consumption, leading to massive emissions of greenhouse gases, among which BECCE accounts for 70% of the carbon emissions in the whole life cycle of buildings (Fenner et al., 2018), which is very important for global warming and sustainable urban development. BECCE’s accurate calculation as the basis of building energy conservation and emission reduction has attracted more and more attention. In 2013, the State Council issued ten measures in the Action Plan for the Prevention and Control of Air Pollution, and the energy consumption structure in the building operation stage gradually became the key to the control of air pollution in China (Li, 2016; Hu et al., 2022). To this end, a series of “coal to gas” and “coal to electricity” policies implemented in China have contributed to the reduction in air pollutants from building operations (Chen and Chen, 2019). Against such a favorable background, the concept of the “electricity-carbon” model is proposed in this paper. This model can measure the carbon emissions of individual buildings quickly and efficiently through electricity data. Taking 2,526 buildings in Chengdu as the research object, the BECCE calculation model was constructed for large public buildings, small- and medium-sized public buildings, government agencies, and residential buildings, respectively, and satisfactory results were obtained. However, in the research process, it was found that the calculation results of the “electron-carbon” model for three types of buildings, including large public buildings, small- and medium-sized public buildings, and government agencies, presented little difference from the actual results, while the BECCE calculation results for residential buildings were relatively poor. The energy carbon emission structure of various buildings (Figure 3) revealed that the energy carbon emission structure of residential buildings during the operation was relatively complex, in which carbon emissions generated by electricity accounted for only 69.3% and carbon emissions generated by natural gas were as high as 30.7%, which might have a certain impact on the performance of the “electricity-carbon” model (Huang et al., 2024). However, the “14th Five-Year Plan” Building Energy Conservation and Green Building Development Plan was issued, which could further promote the implementation of building energy replacement action, improve the degree of building electrification, and monitor the carbon emissions of single buildings through power data to be more effective. This could also improve the problem of poor measurement accuracy in the “electricity-carbon” model for single buildings. It also demonstrated the good popularization prospects of the “electricity-carbon” model.
In the research process, the carbon emission factors used in this paper had limitations in time, causing certain differences in the carbon emission measurement results. Therefore, further attempts will be made to extract the latest updated carbon emission factor database of relevant departments to improve the universality of the application of the “electricity-carbon” model. At the same time, there were relatively few architectural form features extracted in this paper, and the depiction of single buildings was relatively poor, which exerted a certain impact on the final calculation results. In order to further improve the accuracy of the “electricity-carbon” model, more abundant architectural form indicators will be extracted in the future. Finally, the “electricity-carbon” model proposed in this paper is more suitable for buildings with a high degree of electrification. However, with the gradual improvement of future electrification projects and the construction of new building power systems, the “electricity-carbon” model holds better application space in the future.
6 Conclusion
The rapid development of urbanization in China has further promoted a large amount of energy consumption in the building industry, resulting in a large amount of greenhouse gases, among which carbon emissions in the building operation stage account for the main proportion. Accurate measurement of carbon emissions in the operation stage of a single building has a crucial impact on the green and sustainable development of a city. In this paper, based on the research of 2,526 buildings in Chengdu, including large buildings, small- and medium-sized public buildings, government institutions, and residential buildings, this paper proposes a BECCE rapid measurement model (“electricity-carbon “model) for single buildings based on electricity consumption and building physical characteristics and draws specific conclusions.
According to the statistical comparison between the electricity consumption of 2,526 buildings of various types in Chengdu and their BECCE, there is a significant relationship between the electricity consumption of buildings and their BECCE. Combined with the carbon emission structure of various buildings, the electric-carbon emission ratio of public buildings, small- and medium-sized buildings, government agencies, and residential buildings is 0.90, 0.88, 0.89, and 0.69, respectively. Except for residential buildings, the carbon emission structure of other buildings is basically the same.
Combined with the building shapes and carbon emission structure analysis of all kinds of buildings, the characteristics of government agencies and small- and medium-sized buildings are similar in all aspects, so the two types of buildings can be studied as a whole. In this paper, using building electricity consumption, building floor, and building area as the index system, combined with the PSO–SVM algorithm, the “electricity-carbon” model for large buildings, government agencies, small- and medium-sized buildings, and residential buildings was put forward and compared with the unoptimized SVR model. MAE (751, 108.0, and 63.8), RMSE (817.7, 170.2, and 88.9), and R2 (0.89, 0.92, and 0.65) of the PSO–SVM model were significantly better than those of SVR (1113, 119.2, 71.76), RMSE (1490, 266.7, 99.0), and R2 (0.79, 0.81, 0.56), indicating that PSO–SVM is more reliable and more accurate. To verify the generalization ability of the model, data on various types of buildings were collected: 21 large buildings, 100 small- and medium-sized buildings, and 100 residential buildings, and the data were input into the “electricity-carbon” model. The R2 values between the estimated and actual values of large buildings, small- and medium-sized buildings, and residential buildings are 0.91, 0.65, and 0.79, respectively.
All the above conclusions show that the “electricity-carbon” model proposed in this paper has certain validity. However, the “electricity-carbon” model proposed in this paper is relatively poor in the calculation of residential buildings, indicating that the model is more suitable for buildings with a high degree of electrification. With the gradual improvement in future electrification projects, the “electricity-carbon” model has a large application space in the future and good prospects for popularization.
Data availability statement
The raw data supporting the conclusion of this article will be made available by the authors, without undue reservation.
Author contributions
YW: conceptualization, data curation, and writing–original draft. ZC: conceptualization, investigation, and writing–original draft. PH: data curation, methodology, and writing–original draft. HL: formal analysis, methodology, and writing–original draft. FL: conceptualization, project administration, and writing–original draft. YC: formal analysis, project administration, and writing–original draft.
Funding
The author(s) declare that financial support was received for the research, authorship, and/or publication of this article. This work was sponsored by the Sponsored by Natural Science Foundation of Sichuan, China (2023NSFSC1987).
Conflict of interest
Authors ZC and FL was employed by State Grid Sichuan Electric Power Company.
The remaining authors declare that the research was conducted in the absence of any commercial or financial relationships that could be construed as a potential conflict of interest.
Publisher’s note
All claims expressed in this article are solely those of the authors and do not necessarily represent those of their affiliated organizations, or those of the publisher, the editors, and the reviewers. Any product that may be evaluated in this article, or claim that may be made by its manufacturer, is not guaranteed or endorsed by the publisher.
References
Ahmed, A. K., Ahmad, M. I., and Yusup, Y. (2020). Issues. Impacts, and mitigations of carbon dioxide emissions in the building sector. Sustainability 12 (18), 7427. doi:10.3390/su12187427
AlKheder, S., and Almusalam, A. (2022). Forecasting of carbon dioxide emissions from power plants in Kuwait using United States Environmental Protection Agency, Intergovernmental panel on climate change, and machine learning methods. Renew. Energy Int. J. 191, 819–827. doi:10.1016/j.renene.2022.04.023
Bai, L. H. (2019). Research on the whole life cycle carbon emission prediction model of public buildings. Doctoral dissertation. Tianjin University. (In Chinese). doi:10.27356/d.cnki.gtjdu.2019.004755
Chen, H., and Chen, W. Y. (2019). Potential impact of shifting coal to gas and electricity for building sectors in 28 major northern cities of China. Appl. Energy. 236, 1049–1061. doi:10.1016/j.apenergy.2018.12.051
Cuong-Le, T., Nghia-Nguyen, T., Khatir, S., Trong-Nguyen, P., Mirjalili, S., and Nguyen, K. D. (2021). An efficient approach for damage identification based on improved machine learning using pso-svm. Eng. Comput. 38, 3069–3084. doi:10.1007/s00366-021-01299-6
Department of Energy Statistics (2016). National bureau of statistics, people’s Republic of China. China energy statistical Yearbook 2016. Beijing, China: China Statistics Press. (stats.gov.cn).
Eggleston, H., Buendia, L., Miwa, K., Ngara, T., and Tanabe, K. (2006). 2006 IPCC Guidelines for national Greenhouse gas inventories; IPCC national greenhouse gas inventories, 1–20. Programme: Washington, DC, USA.
Energy Information Administration (2020). GlobalABC roadmap for buildings and construction 2020–2050. Washington, DC, USA: Federal Ministry of Economic Affairs and Energy.
Eseye, A. T., Zhang, J., and Zheng, D. (2017). Short-term photovoltaic solar power forecasting using a hybrid wavelet-pso-svm model based on scada and meteorological information. Renew. Energy 118 (APR), 357–367. doi:10.1016/j.renene.2017.11.011
Fenner, A. E., Kibert, C. J., Woo, J., Morque, S., Razkenari, H., Hakim, M., et al. (2018). The carbon footprint of buildings: A review of methodologies and applications. Renewable and Sustainable Energy Reviews 94, 1142–1152.
Gao, H., Wang, X. K., Wu, K., Zheng, Y. R., Wang, Q. Z., Shi, W., et al. (2023). A review of building carbon emission accounting and prediction models. Buildings 13, 1617. doi:10.3390/buildings13071617
Han, L. Y. (2022). Carbon emission Measurement based on high-frequency power data: a case study of Qinghai Province. Technol. Mark. 29, 41–43. (In Chinese). doi:10.3969/j.issn.1006-8554.2022.09.012
Hu, S., Zhang, Y., Yang, Z. Y., Yan, D., and Jiang, Y. (2022). Challenges and opportunities for carbon neutrality in China's building sector-Modelling and data. Build. Simulat. 15, 1899–1921. doi:10.1007/s12273-022-0912-1
Huang, R. G., Zhang, X. C., and Liu, K. H. (2024). Assessment of operational carbon emissions for residential buildings comparing different machine learning approaches: a study of 34 cities in China. Build. Environ. 250, 111176. doi:10.1016/j.buildenv.2024.111176
Huang, Y. M., Luo, J. H., Ma, Z. G., Bing, T., Keqi, Z., and Jianyong, Z. (2023). On combined PSO-SVM models in fault prediction of relay protection equipment. Circuits Syst. Signal Process 42, 875–891. doi:10.1007/s00034-022-02056-w
IPCC (2014). “Climate change 2014 mitigation of climate change (fifth report),” in AR5 climate change (Mitigation of Climate Change — IPCC). Available at: https://www.ipcc.ch/report/ar5/wg3/
Kennedy, J., and Eberhart, R. (1995). . “Particle swarm optimization,” in Proceeding of ICNN’95-international Conference on Neural Networks IEEE, 1942–1948.
Li, J. (2016). Energy performance heterogeneity in China's buildings sector: a data-driven investigation. Renew. Sustain. Energy Rev. 58, 1587–1600. doi:10.1016/j.rser.2015.12.326
Li, X. D., Ren, A., and Li, Q. (2022). Exploring patterns of transportation-related CO2 emissions using machine learning methods. Sustainability 14, 4588. doi:10.3390/su14084588
Li, Y. (2020). Forecasting Chinese carbon emissions based on a novel time series prediction method. Energy Sci. Eng. 8 (7), 2274–2285. doi:10.1002/ese3.662
Liang, Y., Mao, S., Zheng, M., Li, Q., Li, X., Li, J., et al. (2023). Study on the prediction of low-index coal and gas outburst based on PSO-SVM. Energies 16 (16), 5990. doi:10.3390/en16165990
Liu, Q. B., Li, S., Yin, J. S., Li, T. T., and Han, M. L. (2023). Simulation of mechanical behavior of carbonate gravel with hybrid PSO–SVR algorithm. Mar. Georesources Geotechnol. 41 (4), 446–459. doi:10.1080/1064119x.2022.2057261
Liu, Z., Ciais, P., Deng, Z., Lei, R., Davis, S. J., Feng, S., et al. (2020). Author Correction: near-real-time monitoring of global CO2 emissions reveals the effects of the COVID-19 pandemic. Nat. Commun. 11, 6292–6312. doi:10.1038/s41467-020-20254-5
Mallapaty, S. (2020). How China could be carbon neutral by mid-century. Nature 586, 482–483. doi:10.1038/d41586-020-02927-9
Mao, X. K., Wang, L. X., Li, J. W., Quan, X. L., and Wu, T. Y. (2019). Comparison of regression models for estimation of carbon emissions during building’s lifecycle using designing factors: a case study of residential buildings in Tianjin, China. Energy and Build. 204, 109519. N.PAG. doi:10.1016/j.enbuild.2019.109519
Roeck, M., Saade, M. R. M., Balouktsi, M., Rasmussen, F. N., Birgisdottir, H., Frischknecht, R., et al. (2020). Embodied ghg emissions of buildings - the hidden challenge for effective climate change mitigation. Appl. Energy 258 (Jan.15), 1–12. doi:10.1016/j.apenergy.2019.114107
Michael, A. M. N., Wei, F., Stephane de la Rue du, C., Nina, Z. K., Jing, K., and Nan, Z. (2016). Energy efficiency outlook in China’s urban buildings sector through 2030. Energy Policy 97, 532–539. doi:10.1016/j.enpol.2016.07.033
Moraliyage, H., Dahanayake, S., De Silva, D., Mills, N., Rathnayaka, P., Nguyen, S., et al. (2022). A robust artificial intelligence approach with explainability for measurement and verification of energy efficient infrastructure for net zero carbon emissions. Sensors 22 (23), 9503. doi:10.3390/s22239503
Nourani, V., Elkiran, G., and Abdullahi, J. (2019). Multi-station artificial intelligence based ensemble modeling of reference evapotranspiration using pan evaporation measurements. J. Hydrol. 577, 123958. doi:10.1016/j.jhydrol.2019.123958
Oleson, K. W., Monaghan, A., Wilhelmi, O., Barlage, M., Brunsell, N., Feddema, J., et al. (2013). Interactions between urbanization, heat stress, and climate change. Clim. Change 129 (3), 525–541. doi:10.1007/s10584-013-0936-8
Sandeep, S., Abinash, S., and Agnihotri, A. (2023). Prediction of flood discharge using hybrid PSO-SVM algorithm in barak river basin. MethodsX 10, 102060. doi:10.1016/j.mex.2023.102060
Seyedzadeh, A., Maroufpoor, S., Maroufpoor, E., Shiri, J., Bozorg-Haddad, O., and Gavazi, F. (2020). Artificial intelligence approach to estimate discharge of drip tape irrigation based on temperature and pressure. Agric. Water Manag. 228, 105905. doi:10.1016/j.agwat.2019.105905
Szeląg, B., Zaborowska, E., and Mąkinia, J. (2023). An algorithm for selecting a machine learning method for predicting nitrous oxide emissions in municipal wastewater treatment plants. J. Water Process Eng. 54, 103939. doi:10.1016/j.jwpe.2023.103939
Sztubecka, M., Skiba, M., Mrówczyńska, M., and Bazan-Krzywoszańska, A. (2020). An innovative decision support system to improve the energy efficiency of buildings in urban areas. Remote Sens. 12 (2), 259. doi:10.3390/rs12020259
Tang, X., Xie, X., Fan, B., and Sun, Y. (2018). A fault-tolerant flow measuring method based on PSO-SVM with transit-time multipath ultrasonic gas flowmeters. IEEE Trans. Instrum. Meas. 67, 992–1005. doi:10.1109/tim.2018.2795298
United Nations Environmental Program (UNEP) and IEA. (2017). Global status report 2017. Content has moved. Energy (europa.eu).
Wei, S. (2015). Enhanced actions on climate change: China’s intended nationally determined contributions.
Zhang, H., Guo, X., and Zhang, P. (2023). Improved PSO-SVM-Based fault diagnosis algorithm for wind power converter. IEEE Trans. Industry Appl., 3341059. doi:10.1109/SPIES55999.2022.10082014
Zhang, Y., Teoh, B. L., Wu, M. Z., Chen, J. Y., and Zhang, L. M. (2023). Data-driven estimation of building energy consumption and GHG emissions using explainable artificial intelligence. Energy 262, 125468. doi:10.1016/j.energy.2022.125468
Zhao, M., Wang, S., Kang, W. B., Li, Y., and Meng, X. Z. (2022). A review of carbon emission accounting in the building sector. HVAC 11, 13–22. (In Chinese). doi:10.19991/j.hvac1971.2022.11.02
Keywords: electric big data, single buildings, building operational energy consumption carbon emissions, “electricity-carbon” model, particle swarm optimization–support vector machine
Citation: Wei Y, Chang Z, Hu P, Liu H, Li F and Chen Y (2024) Rapid carbon emission measurement during the building operation phase based on PSO–SVM: electric big data perspective. Front. Energy Res. 12:1329942. doi: 10.3389/fenrg.2024.1329942
Received: 30 October 2023; Accepted: 29 March 2024;
Published: 25 April 2024.
Edited by:
Maria Alzira Pimenta Dinis, Fernando Pessoa University, PortugalReviewed by:
Junqi Wang, Southeast University, ChinaAbinash Sahoo, Odisha University of Technology and Research, India
Copyright © 2024 Wei, Chang, Hu, Liu, Li and Chen. This is an open-access article distributed under the terms of the Creative Commons Attribution License (CC BY). The use, distribution or reproduction in other forums is permitted, provided the original author(s) and the copyright owner(s) are credited and that the original publication in this journal is cited, in accordance with accepted academic practice. No use, distribution or reproduction is permitted which does not comply with these terms.
*Correspondence: Zhengwei Chang, Y2hhbmd6dzExM0AxNjMuY29t