 Jichao Ye
 Xinwei Hu
- State Grid Zhejiang Electric Power Co., Ltd., Lishui Power Supply Company, Lishui, Zhejiang, China
In response to China’s goal of “carbon peak and carbon neutrality”, a large number of new energy sources are connected to the power grid, and Chinese cities are also accelerating the construction of new power systems led by new energy. Taking Lishui City as an example, this paper constructs a low-carbon emission reduction evaluation system to evaluate the carbon reduction effectiveness of the new power system. This paper first introduces the basic technical characteristics of the new power system, and introduces in detail the key technologies involved in the construction of the new power system in Lishui. Then, the projects implemented by Lishui City in promoting the new power system and the current achievements were briefly summarized. After that, a new electric carbon traceability model of Lishui power system was constructed to carry out carbon traceability and carbon tracking for the municipal power grid. Finally, a low-carbon emission reduction evaluation system was constructed, and a number of evaluation indicators were proposed to evaluate the carbon reduction effectiveness of Lishui’s new power system, and the zero-carbon evaluation index was calculated through the historical data of Lishui, and the results showed that the new power system in Lishui City achieved remarkable results in carbon reduction and emission reduction.
1 Introduction
As problems such as extreme weather, environmental pollution and energy consumption intensify around the world, carbon emissions have increasingly become the key to restricting the development of countries. The Paris Agreement adopted at the Paris Climate Change Conference in December 2015, setting a long-term goal of limiting the rise in global average temperature to 2°C in the 21st century (Xiao et al., 2021). In recent years, many countries in the world have gradually adopted carbon emission control as a national strategy.
At present, China is promoting the development of clean and low-carbonisation in many aspects such as source network, load and storage. On the power generation side, the new power system needs to have the characteristics of low-carbon and clean energy production technology (Lin and Yang, 2022). Literature (Yan et al., 2024) investigates the optimal allocation of renewable energy microgrids such as wind, light and hydrogen, which can increase the share of clean energy. Literature (Li P. et al, 2022) investigates a continuous time distribution algorithm for solving the grid economic dispatch problem for planning hydroelectric networks. Literature (Duan et al., 2023) proposes a distributed optimisation algorithm for hybrid microgrids that takes into account the environmental impact of pollutant emissions from conventional generators. Literature (Shirkhani et al., 2023) reviews different decentralised control methods for microgrids and looks at the future of renewable energy development in the grid.
On the grid side, the new power system needs to have the technical characteristics of safe and efficient energy network (Zhong et al., 2021). Literature (Li S. et al, 2022) proposes a fast and accurate method of calculating the breaking voltage based on Taylor’s technique of unfolding, which can get the value of the system node voltage in a short period of time. Literature (Wang et al., 2023) proposes a new SSCI (subsynchronous control interaction) identification method, which can monitor the SSCI of new energy systems in real time and improve the safety and stability of renewable energy systems. (Cao et al., 2022). proposes a watershed-electricity nexus model to unlock the flexibility of watershed networks (WSNs) for supporting the operation of power distribution networks (PDNs) under rainy climates. (Li et al., 2023). proposes a coordinated restoration method is presented for the renewable energy-integrated multi-energy distribution system (MDS) with several coupling points to coordinate the preparation and load recovery stages after the extreme event.
On the user side, the new power system needs to have flexible and efficient energy utilization technology characteristics, (Zhong et al., 2022). Literature (Lyu et al., 2024) analyses vehicle data from three cities in China and the results of the study showed that electric vehicles can significantly reduce carbon emissions. Literature (Xu et al., 2021) proposes a closed model for oil and gas recovery that can significantly reduce oil and gas leakage and environmental pollution. Literature (Hou et al., 2017) proposes a grid-based framework for regulating the operation of plug-in electric vehicle (PEV) aggregators to increase the revenue of the aggregator and reduce the charging cost for PEV users. Literature (Lei et al., 2023) proposes an end-to-end adaptive lightweight defect detection model for the model detection of defects in collectors of new energy trams, which contributes to the safe development of new energy trams. Aiming at multi-energy hybrid microgrids for ships, literature (Li et al., 2020) proposes an optimal coordination method for energy scheduling and voyage scheduling. Using social network analysis (SNA), literature (Hu et al., 2024) analyses the structural characteristics of China’s new energy charging station innovation association network of patent data since 2007 from the perspectives of provinces, municipalities, and patent applicants, and discusses policy recommendations for further expanding technological innovation in charging stations to promote the development of the new energy vehicle industry.
On the energy storage side, the new power system needs to have cost-effective energy storage technology characteristics (Liu, 2022); Literature (Fan and Zhou, 2023) investigates the optimal configuration of home wind energy storage systems. In addition, digital technology is a key technology to support the construction of new power systems (Xie et al., 2023). Digital technology includes modern information technology, advanced sensing technology, artificial intelligence and big data technology, supporting the construction of a new power system with intelligent operation control and operation management, digital twin panoramic display and intelligent interaction (Gao et al., 2023). Literature (Liu et al., 2021) proposes a Magnetic Induction (MI)-assisted Wireless Power Underground Sensor Network (MI-WPUSN) for real-time monitoring of the underground environment. However, the traceability of carbon emissions from new power systems and the evaluation of their contribution to the environmental aspects are currently under-researched.
Currently, research on low-carbon evaluation systems in China is still in its early stages. Literature (Liu, 2021) emphasizes that when considering the zero-carbonization of urban clusters, the development of new energy systems with zero-carbon characteristics should be prioritized. Literature (Lei et al., 2022) establishes a carbon-neutral evaluation framework for assessing carbon emissions levels in rural energy systems. Furthermore, literature (Pei, 2021) identifies five typical types of nearly zero-carbon demonstration areas and proposes six principles for constructing an evaluation system for zero-carbon demonstration zones. Literature (Luo et al., 2024) proposes a composite model of Multi-Universe Quantum Harmony Search-Dynamic Fuzzy System Ensemble (MUQHS-DMFSE)" for carbon emission prediction and applies the Data Envelopment Analysis (DEA) method to study the development of low carbon economy. Literature (Shang and Luo, 2021) adopts the Tapio decoupling model to explore the decoupling relationship between carbon dioxide and drivers, divides the drivers of carbon footprint into four main indicators, namely, city scale, economic development, social system, and technological advancement, from a system perspective, and analyses the linkage between the carbon footprint and these four indicators by taking Xi’an City as an example. Most of these studies focus on conducting low-carbon evaluations for specific areas or zones, and many of them are still in the conceptual and planning stages. In contrast, this paper aims to develop a comprehensive evaluation system for the entire new power system construction in Lishui City, focusing on its low-carbonization efforts.
The remaining structure of the paper is as follows: in the second part, an overview is provided of the techniques and project implementations used in the development of a new power system in Lishui City. Next, the third part conducts a carbon emission analysis using an electric-carbon perception tracing model for the transformed power system in Lishui City. Subsequently, the fourth part introduces multiple carbon reduction evaluation indicators and establishes a low-carbon emission reduction evaluation system. This system is then applied with the carbon emission data obtained from the electric-carbon tracing model to analyze and assess the effectiveness of carbon reduction measures implemented in the projects and the new power system in Lishui City. Finally, the fifth part concludes the paper.
2 Technical analysis of lishui engineering and carbon reduction effectiveness
Lishui City has carried out many projects to build a new power system, and these projects have generally followed the following four technical approaches: releasing the potential of clean energy development and promoting the clean energy production; building a diversified and integrated high-resilience power grid and promoting efficient energy allocation; tapping into the low-carbon energy potential of society to promote end-consumer electrification; improving load scale response capability and promoting flexible network-load interaction.
2.1 The release of clean energy development vitality and promotion of clean energy production
Expand clean energy production, increase the clean substitution of coal and oil such as renewable electricity and biomass natural gas, and achieve 100% local consumption of clean energy. In view of the randomness, volatility and low inertia characteristics of new energy power generation such as wind and solar and the consequent challenges of system peak shaving and anti-disturbance ability, research on the prediction and aggregation regulation of clean energy such as wind, light and water, and the adaptability of high-proportion clean energy access are carried out, so as to provide a data basis for low-carbon optimal dispatching, solve problems such as random fluctuations in wind and solar output, and uncontrollable reactive power output of small hydropower, and pilot the construction of a new power system power grid dispatching optimization project to ensure that clean energy is “visible”. Promote the safe, clean and efficient development of regional energy.
For clean energy production, the main consideration is to add clean energy to the source side of Lishui City to meet load demand. In this regard, Lishui has carried out two major projects: large-scale green power resource development and clean energy collection station.
According to the data provided by Lishui City, as of December 2022, a total of 2,064 new grid-connected users have been added to the large-scale green power development project, 475.21 MW has been added, the cumulative power generation of new green power resources has been 1.42 billion kWh, 193 green power trading users have been aggregated, the cumulative transaction electricity has been 15.158 million kWh, the cumulative revenue for users has increased by 988,900 RMB, and the cumulative carbon reduction and emission reduction has been 1.0689 million tons.
The total scale of access resources of the clean energy collection station project is 137MW, the annual power generation of clean energy is 210 million kWh, the electrochemical energy storage capacity is 6.9MW, saving 50 million RMB of investment in the power grid and reducing carbon emissions by 159,200 tons.
2.2 The construction of a diversified and integrated high-elasticity power grid and the promotion of efficient energy utilization configuration
Adhere to the “strong-intelligent-highly flexible” construction path, build distributed pumping and storage, virtual pumping and storage, and add energy storage forms with cross-temporal and spatial flexibility such as electrochemical energy storage, hydrogen energy storage, and air energy storage, and form a one million kilowatt-level generalized energy storage resource pool. Carry out research on generalized cloud energy storage under various forms of energy storage, pilot the construction of clean energy collection station projects, near-zero carbon demonstration projects of water-hydrogen biomass, and multi-time scale generalized energy storage resource pool projects, to solve the problems of power supply guarantee caused by extreme heat and no wind, late peak without light, and dry water in winter, as well as the problem of small hydropower, wind power, and photovoltaic rushing out of the channel. Carry out research on the friendly interactive multi-level collaborative dispatch mode of source-grid-load-storage, pilot the construction of 100% pan-micro-grid demonstration projects for green electricity, and “worry-free” resilient power grid projects with mountainous characteristics, ensure that clean energy is “delivered”, realize the coordinated optimization of source-grid-load carbon storage and electricity, and ensure the safe, economical and low-carbon operation of the power grid.
For the efficient allocation of energy use, it is mainly considered to add flexible resources in Lishui City to improve Lishui’s ability to solve the inequality between power supply and demand. In this regard, Lishui mainly carried out projects such as generalized energy storage resource pool and user-side flexibility resource aggregation and regulation.
According to the data provided by Lishui City, in the multi-time scale generalized energy storage resource pool project, the adjustable capacity of generalized energy storage resources is 1729MW, which increases the new energy consumption space by 218 million kWh/year, increases the new energy transmission capacity by 400 MW during the noon period, and saves 500 million RMB in power grid investment. The average annual carbon reduction and emission reduction is 165,100 tons; 967 users of demand response agreements in the large-scale flexible resource aggregation and control project on the user side, the cumulative amount of demand response electricity subsidies is 21.83 million RMB, the number of air conditioning flexible sensing households is 258, the maximum adjustable load of air conditioning load is 45,000 kW, and 13,045 users participating in load management are 13,045 households/time.
2.3 The exploration of social low-carbon energy potential and the promotion of end-use consumption electrification
Promote the transformation of traditional energy-consuming enterprises into “one low and three high” enterprises, and expand large-scale electric energy substitution in industrial production, transportation, residential energy consumption and other fields. Increase the application of electric heating, electric pressurization and auxiliary electric power in the industrial field. Accelerate the promotion of electric vehicles, electric heavy trucks, etc. in the transportation field. Accelerate the electrification of residential energy use, build zero-carbon buildings, and create zero-carbon communities and all-electric villages. Carry out research and promotion and application of emerging key technologies for electric energy substitution, pilot the construction of large-scale green power resource development projects, ensure that clean energy is “well used”, lead the transformation and upgrading of energy consumption, build a green and low-carbon energy consumption system, and achieve 100% zero carbon emissions in new energy consumption.
For the electrification of end-consumption consumption, the main consideration is to reduce inefficient and high-carbon primary energy use on the user side as much as possible, so as to help reduce the overall carbon emissions of Lishui City. In this regard, Lishui has mainly carried out the near-zero carbon demonstration project of hydrocarbon biomass and other projects to promote electrification.
According to the data provided by Lishui City, the cumulative hydrogen production capacity of the near-zero carbon demonstration project of water-hydrogen biomass is 484.75 kg, the cumulative hydrogen consumption is 449.08 kg, the cumulative natural gas output is 1119.5 Nm3, the cumulative hydrogenation capacity is 92.1 kg, the electrification of transportation is 1809.77 kWh, and the electrification of domestic consumption is 3189.93 kWh.
2.4 The enhancement of load scale response capacity and the promotion of flexible interaction of grid load
Build an operation model of prefecture-level load aggregators, awaken the sleepy adjustable load resources on the customer side, focus on full load aggregation and demand response, connect the smart power platform and demand response platform, focus on industry, hotel, and commercial Universe, establish load aggregation groups such as air conditioning, electric vehicles, and industry, and build a one million kilowatt-level load-side demand response resource pool. Carry out technical research on large-scale resource aggregation and interactive regulation, pilot the construction of user-side large-scale flexible resource aggregation and regulation projects, energy big data centers, solve problems such as wide distribution of flexible resources, difficulty in output regulation, and disorderly energy use, ensure the “supply and live” of clean energy, realize load participation in network-wide interaction, alleviate problems such as insufficient system capacity during peak hours, and improve the resilience and stability of the power grid.
For the flexibility of grid-load interaction, the allocation of source-load flexible resources by the dispatching department is mainly considered, so that the local power generation curve and the power consumption curve are more matched. In this regard, Lishui has carried out projects such as the optimization of grid dispatching of new power systems and 100% pan-micro-grid green power.
According to the data provided by Lishui City, the total regulated resources of the green power 100% pan-microgrid demonstration project are 52.35MW, the annual average green power supply rate is 68.27%, the flexible resource allocation is 0.50MW, the annual average carbon dioxide emission reduction is 106,400 tons, and the new energy support capacity is increased by 58.36MW; the new power system power grid dispatching optimization project has built a wind, solar and water carbon storage intelligent dispatching platform, which is connected to 899 hydrological stations in the whole region. It has established a global zero-carbon virtual power plant, carried out 6.00 zero-carbon peak shaving on holidays, and participated in the normalization of peak shaving in summer in 2022, with a maximum regulation capacity of 760,000 kW.
In addition, Lishui has also carried out the “rain or shine” resilient power grid project with mountain characteristics. The number of monitoring devices increased to 1057, the operation rate reached 98.14%, the online rate reached 98.48%, the cumulative capacity increased by 10 lines, the average load rate increased by 4.75%, the maximum load ratio increased by 25.90%, and the capacity increased by 15.00%. In December 2022, the power supply of Lishui City can be considered to reach 99.9824%, and the average power outage time of households is 1.54 h, with a year-on-year voltage drop of 35.83%.
3 Electric carbon sensing traceability model
This chapter begins by introducing the theory of carbon flow, followed by the construction of an electric-carbon tracing model. Finally, this model is applied to conduct carbon tracing and carbon emission analysis of the transformed new power system in Lishui City.
3.1 An overview of the electric carbon sensing traceability model
Literature (Zhou et al., 2012) introduced the initial framework of carbon flow theory, defining and describing several key concepts in the methodology. Literature (Zhou et al., 2012b) established a comprehensive theory and calculation method for carbon flow analysis in power systems, quantitatively analyzing the distribution characteristics and mechanisms of carbon flow within the power grid. Additionally, literature (Cheng et al., 2018) extended the carbon emission flow theory to the integrated energy system, establishing a carbon emission analysis model for the integrated energy system, revealing the fundamental characteristics and patterns of carbon emission flow within the energy network. The electric carbon sensing traceability model in Figure 1 is a carbon emission traceability model based on the carbon emission flow of the power system.
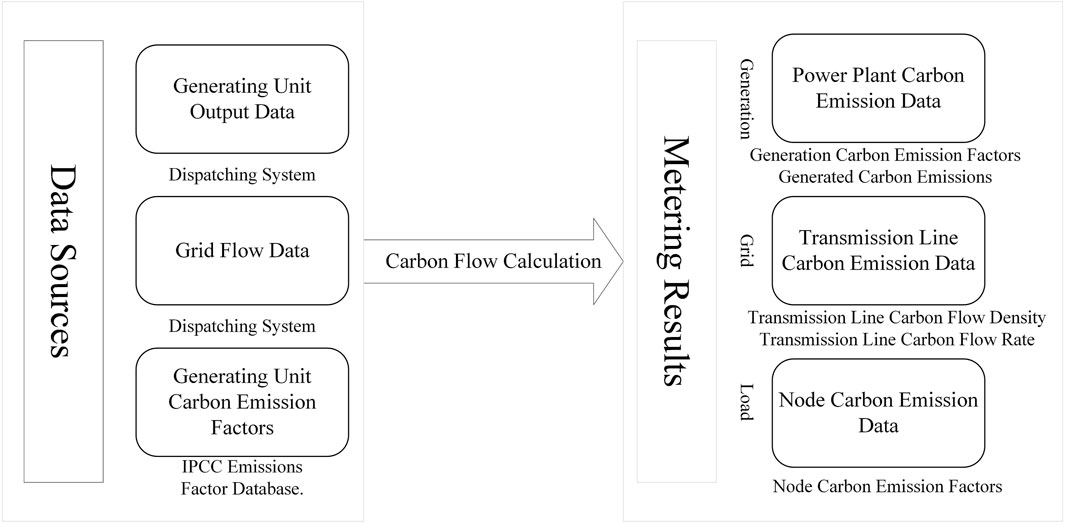
Figure 1. Electricity carbon traceability.
The carbon emission stream of the power system is a virtual network flow that is dependent on the presence of power flows and is used to characterize the carbon emissions that maintain the current flow of any one of the roads in the power system (Wang et al., 2022). It can be considered that the carbon emission flow starts from the power plant, enters the power system as the power grid power of the power plant is on-grid, follows the current flow in the system, flows in the power grid, and finally flows into the consumer terminal on the user side. On the surface, carbon emissions enter the atmosphere through power plants, but in reality, carbon emissions are consumed by electricity users through carbon streams.
3.2 Electricity carbon traceability calculation
The construction process of the electric carbon traceability model: First, the power flow analysis is carried out, and the active power, reactive power, voltage and phase angle of all nodes are calculated by calculation. Then, the carbon potential of each node of the system is calculated, and according to the nature of the carbon emission stream, when the carbon potential of a node is known, for all branches that flow from the node active current, the carbon flow density of these branches is equal to the carbon potential of the node. The nodal carbon potential and branch carbon flow density change with the flow in the system. Think of it as the real-time carbon emission factor of a line at a certain moment (Zhang, 2022).
3.2.1 Branch power flow distribution matrix
Assuming the system has N nodes, among which K nodes have generator injection, and M nodes have loads, the following new concepts will be introduced to facilitate the illustration and calculation of the electric carbon tracing model. First clarify several concepts.
It is a square matrix of order N, denoted by
If there is a branch between node i and node j (i, j = 1, 2, … , N), and the positive active current flow from node i to node j through this branch is p, then
3.2.2 Power injection distribution matrix
It is a matrix of order K×N and is denoted by
If the k-th (k = 1,2, … ,K) generator set is connected to node j, and the active current flow injected into node j from the k-th node containing generators is p, then
3.2.3 Load distribution matrix
It is a matrix of order M×N and is denoted by
If node j is the m (m = 1, 2, … , M) node with a load and the active load is p, then
3.2.4 Nodal active power flux matrix
It is an N-order diagonal matrix, denoted by
For node i, let
where
If
where
Eq. 2 shows that when the matrix
3.2.5 Carbon emission intensity vector
Different generator sets have different carbon emission characteristics, which are known conditions in carbon flow calculation, and can form the carbon emission intensity vector of the generator set of the system. If the carbon emission intensity of the k-th (k = 1, 2, … , K) generator set is
3.2.6 Nodal carbon intensity vector
The primary calculation target of the carbon emission stream of the power system is the carbon potential of all nodes. If the carbon potential of the i-th (i = 1,2, … ,N) node is
Combined with the above, from the definition of node carbon potential, the carbon potential
where
As shown in Eq 5, the carbon potential of node i is determined by the carbon emission flow generated by the generator set connected to the node and the carbon emission flow from other nodes into the node. The meaning of the right numerator and denominator of the equal sign is node i, respectively, and is contributed by the carbon emission flow and flow of the above two types of nodes. Depending on the nature of the carbon stream, the density of the branch carbon flow
where
According to the definition of the nodal active flux matrix, we get:
It can be obtained from Eqs 6, 7:
Since the matrix
After sorting, the carbon potential calculation formula for all nodes of the system is:
After calculating the node carbon potential vector, the carbon flow rate of each branch of the system can be further obtained. Thus, the branch carbon emission flow rate distribution matrix is defined as an N-th order square matrix, which is denoted by
The element definition of the tributary carbon flow rate distribution matrix is similar to the tributary power flow distribution matrix. If there is a branch between node i and node j (i, j = 1,2, … , N), and the positive carbon flow rate from node i to node j through this branch is R, then
From above:
In addition, after calculating the node carbon potential vector, the carbon emission intensity of electricity consumption of the node load is equal to the carbon potential of the node. Combined with the load distribution matrix, the carbon flow rate corresponding to all loads can be obtained, and the physical meaning is the carbon emission generated by the power generation side per unit time of the load of the supply node. For the m-th (m = 1, 2, … , M) node with load, the carbon flow rate corresponding to the load is
As can be seen from the above:
The overall calculation flow chart is shown in Figure 2.
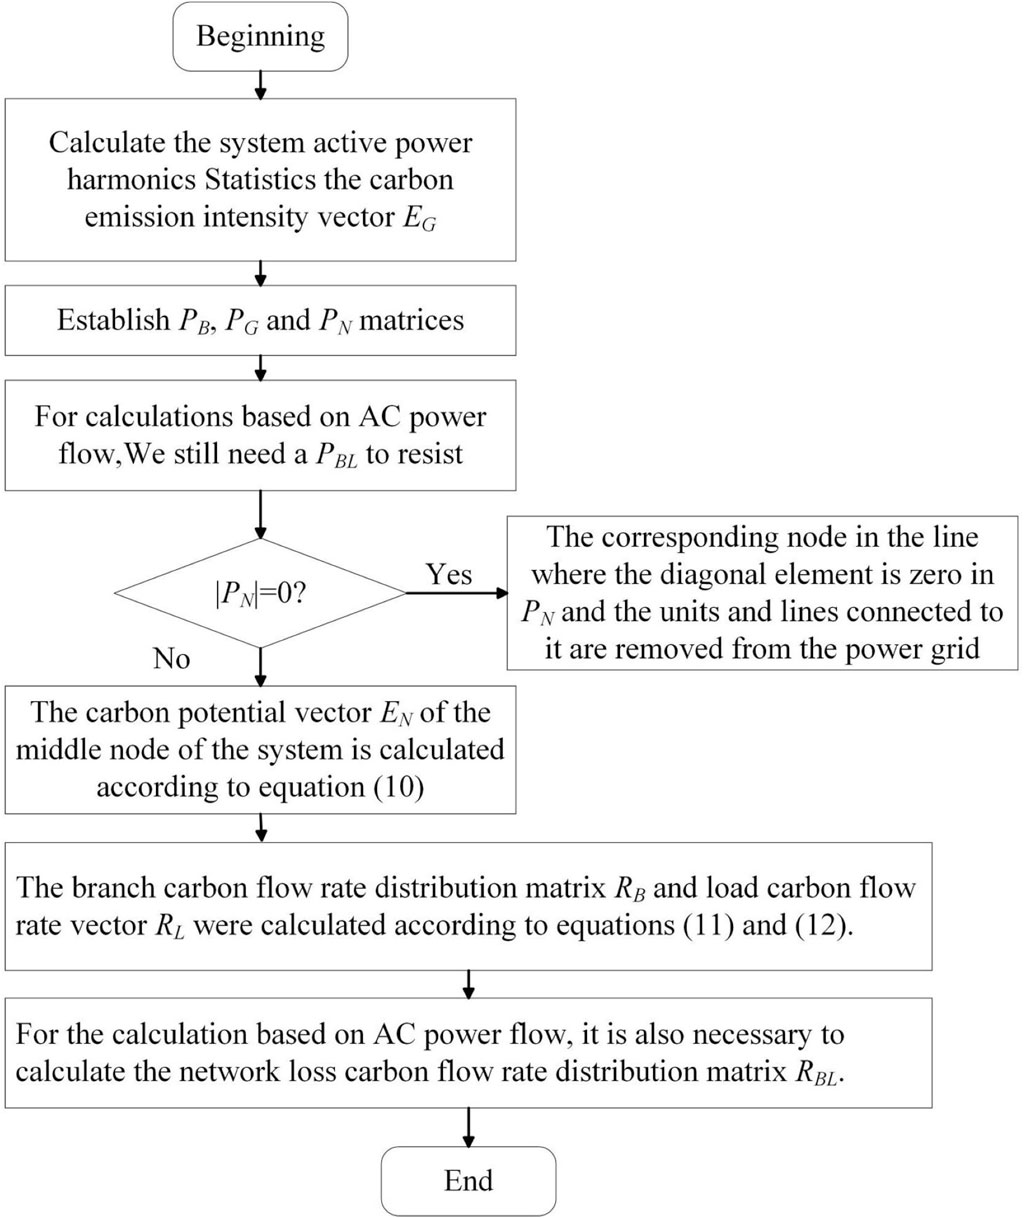
Figure 2. Electricity Carbon Traceability Model Calculation Process.
3.3 Electricity carbon traceability analysis of Lishui
Figure 3 is the node diagram of the Lishui power system. Table 1 presents partial carbon flow data of the power grid in Lishui City. According to the all carbon flow data from Lishui City, it is evident that the city’s power system gathers data at 5-min intervals, the real-time carbon emission factor of each line in Lishui City can be obtained every 5 minutes. The results of the statistical analysis by row are shown in Figure 4. From the perspective of each route, there are always 1273 lines with a typical intraday carbon emission factor of zero. The real-time carbon emission factor for the 207 lines fluctuates between zero and other values. The carbon emission factor of the 60 lines is not zero at any time. The average typical intraday real-time carbon emission factor in row 210001093 and column 240000874 is the largest, which is 0.7093.
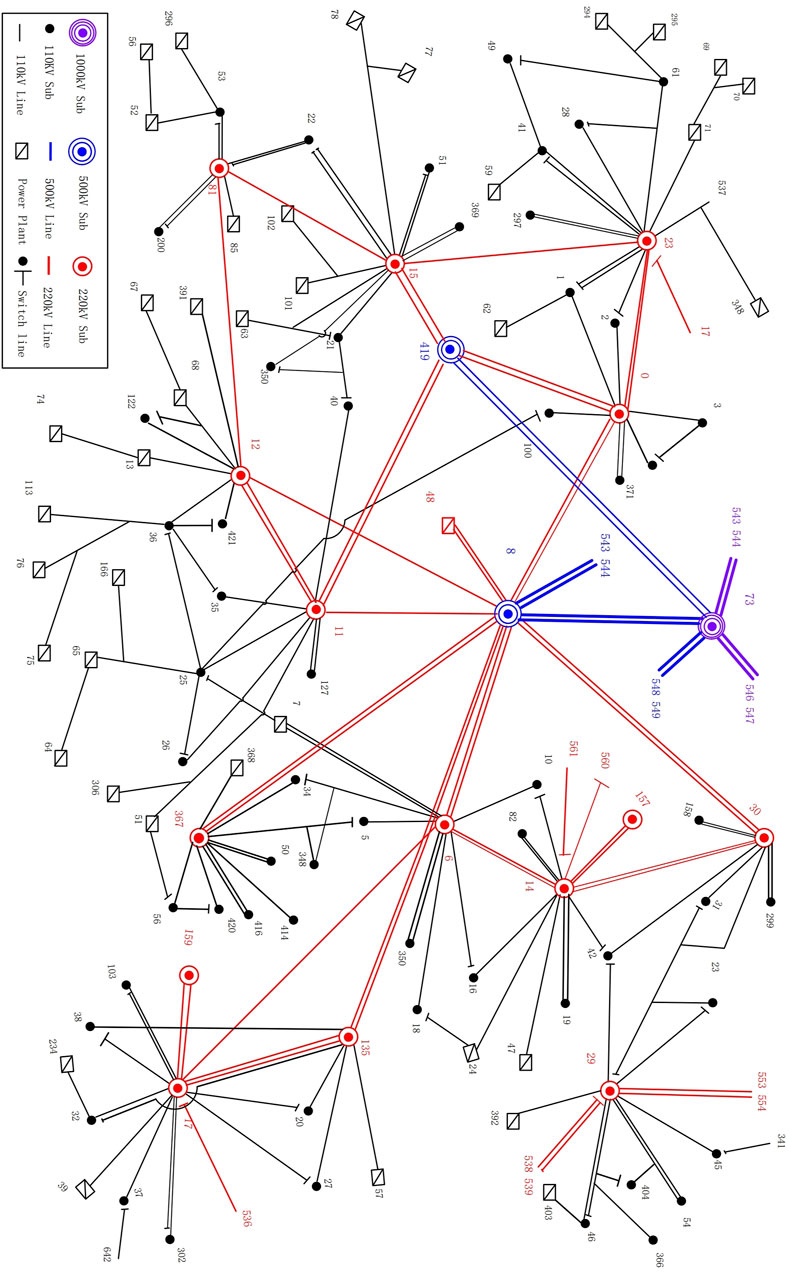
Figure 3. Node diagram of the Lishui power system.
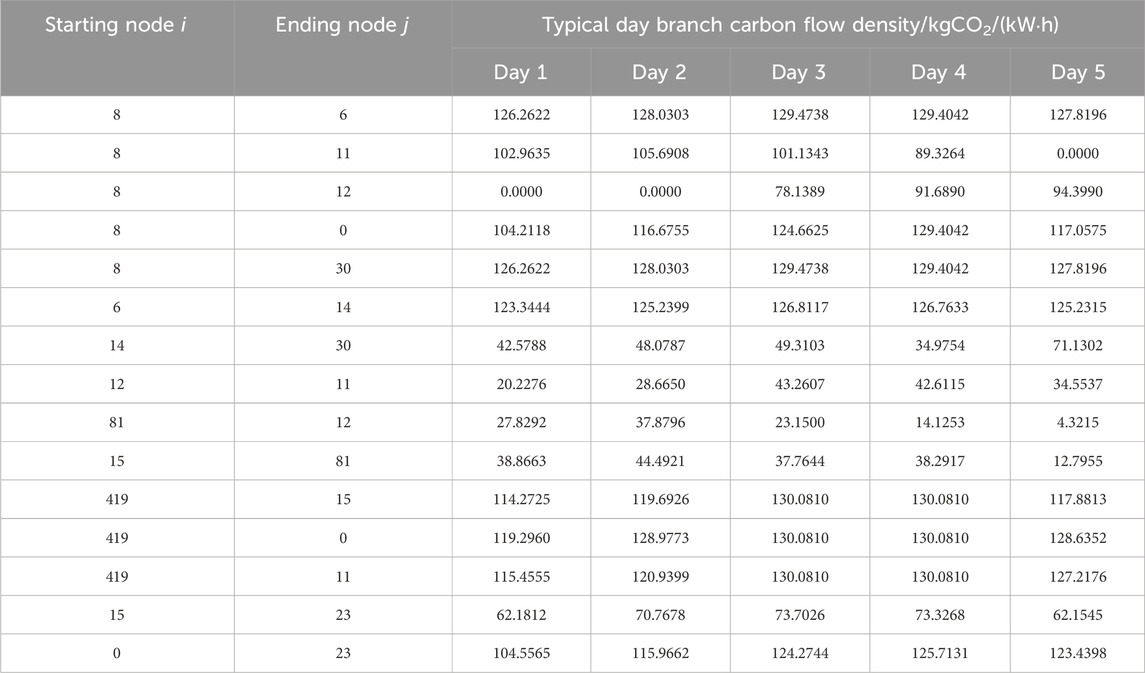
Table 1. Carbon flow density of branches.
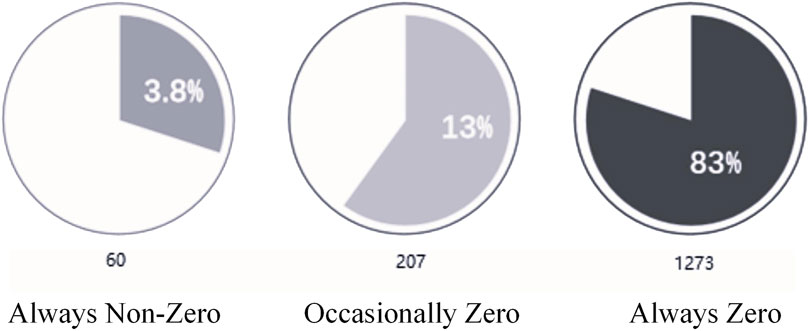
Figure 4. Real-time carbon emission factors for line-based analysis.
The results of the statistical analysis by column are shown in Figure 5. For all routes, the period with the largest average carbon emission factor is from 22:30 p.m. to 23:00 p.m., with the maximum value occurring at 22:55 p.m. on the fourth day of a typical day. The periods with the highest average carbon emission factor were around 22:55, around 20:10, and around 17:50.
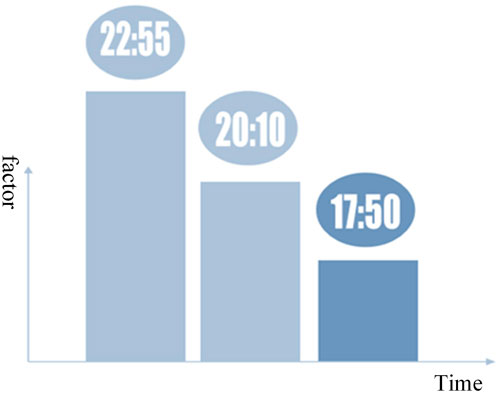
Figure 5. Real-time carbon emission factors for time-based analysis.
4 Evaluation system of low-carbon emission reduction effectiveness in Lishui City
In order to reasonably evaluate the carbon reduction effectiveness of Lishui power system, the carbon reduction effect of electricity is set up as the main indicator to evaluate the overall carbon reduction and emission reduction effect of the power system. Since the carbon reduction effect of electricity is jointly completed by all links of the power system, but the power system is an organic whole, the links of generation, transmission and distribution are coupled with each other and affect each other, and the carbon emission reduction results of each link cannot be simply and linearly added to obtain the overall carbon emission reduction results of the power system (Zhang et al., 2023). However, by separately calculating the contribution of each link to emission reduction, the development of low-carbon power system can be further refined, and the theoretical basis and data support for the advanced plan for low-carbon transformation of power system can be provided. Therefore, four secondary indicators are proposed for the three links of generation, transmission and use in the power system, and the carbon reduction effect of the power system is evaluated in a multi-dimensional and all-round way.
4.1 Primary indicator: the effectiveness of electricity carbon reduction
According to the source of electric energy, the carbon emissions of the power system can be divided into two parts, the carbon emissions generated by the power generation in the city and the carbon emissions from the electricity outside the city. Since Lishui’s local power emissions only come from two self-consumption thermal power plants, the power consumption of the plant is fixed, the power generation is almost unchanged, and the power generation is small, so the carbon emissions of Lishui’s local power supply can be improved relatively little. Therefore, in order to further reduce the carbon emissions of the Lishui power system, we mainly consider from the direction of reducing the dependence on external electricity in the city. The evaluation of the carbon reduction and emission reduction effectiveness of Lishui power system can be summarized as follows: It refers to the difference between the carbon emissions generated by the purchase of electricity from the city before the improvement of the power system, minus the carbon emissions generated by the purchase of electricity after the improvement of the power system.
Among them, due to the interconnection of the national power grid, the physical characteristics of real-time balance of electricity, and the calculation results should have economic and statistical significance, the calculation of the city’s external electricity should be from the perspective of electricity, rather than using electricity for calculation, so the total amount of the city’s external electricity adopts the electricity data of the city’s external gateway. Logically, the electricity from outside the city can be obtained by the following: Municipal external electricity refers to the total electricity consumption of the whole society minus the amount of local power generation and consumption within the city; Local power generation and consumption refers to the amount of power generated locally in Lishui minus the amount of electricity that Lishui purchases from external grid sources outside the city.
Calculation method:
where GPI is the Green power index; FN is the National average carbon emission factor; FL is the Local carbon emission factor.
The official website of each provincial development and reform commission can obtain the carbon emission factor data and green power index of the power industry of each province in Supplementary Table SA1. Among them, the national average electricity carbon emission factor is 5.703 kg CO2/MWh (General Office of the Ministry of Ecology and Environment, 2023).
Evaluation methodology: According to the provincial carbon emission factors of 31 provinces in the country, the green power index of the eighth place (top 25%) reached 26.42%, the 16th place (top 50%) was −5.8%, and the twenty-fourth place (top 75%) was −27.35%, according to which the grade was divided: the green power index reached −27.35% as qualified, −5.8% as good, and 26.42% as excellent (Jiang, 2018).
Indicator calculation results: In 2021 and 2022, the green power index of Lishui City was 52.64% and 60.11%, respectively.
Future indicator forecasting methodology: Using the predicted values of thermal power, clean energy power generation and electricity consumption, combined with the predicted utility carbon emission factor (the change of thermal power factor with time can be ignored in the short term) is used to approximate the calculation.
4.2 Secondary indicator: Permeability of clean power generation
Calculation method: Since almost all of the carbon emissions of the power system come from the thermal power generation units on the power generation side, reducing the carbon emissions on the power generation side is to reduce the thermal power generation and increase the clean energy power generation. Therefore, the higher the proportion of clean energy on the power generation side, the lower the carbon emission level of the power system, it can be summarized as follows:
where RC is the Clean power generation penetration rate; GLc is the local clean power generation; GLt is the local total power generation.
Evaluation basis: In 2021, the cumulative power generation of clean energy accounted for 32.5% of the total power generation in China, and the cumulative power generation of clean energy in Zhejiang Province accounted for 27.8% of the total power generation (China Electricity Council, 2022).
Evaluation methodology: referring to the cumulative power generation of clean energy in China in 2021, 28% of the local clean energy power generation accounted for the total local power generation as qualified, 33% as good, and 38% as excellent.
Indicator calculation result: 95.5% in 2022.
Future indicator forecasting methodology: Calculations are made using clean energy generation and electricity consumption forecasts.
4.3 Secondary index: Flexible resource allocation rate
Calculation method: On the transmission side, the way to reduce carbon emissions is to actively adapt to the characteristics of clean energy power generation on the power generation side, store clean electricity in a timely manner, transfer electricity demand, and use flexible resources of the power grid to adjust the power supply and demand curve to maximize the effect of clean energy output. To this end, it is necessary to examine whether the power system has sufficient flexible resource allocation to meet the needs of flexible dispatch of the power grid. Due to the relative controllability of the power generation side of the power grid, the main goal of flexible resources is to adjust the relatively uncontrollable load demand, so the maximum power load is selected for comparison, and the specific calculation formula is as follows:
where RF is the flexible resource allocation rate; CESS is the adjustable capacity of generalized energy storage resources; CFL is the adjustable capacity of flexible load resources; LMAX is the Maximum power load.
Evaluation basis: Load monitoring capacity reaches more than 70% of the maximum electricity load in the operation area, and load control capacity reaches more than 10% of the maximum electricity load in the operation area (Li, 2017).
Standby is divided into load backup and accident backup, with load standby taking 5% of the maximum power generation load of the system, accident standby taking 10% of the maximum power generation load of the system or the maximum single unit capacity in the system (Cai et al., 2023).
Evaluation methodology: referring to the standards of flexible load and system standby (usually borne by high-flexibility units, such as generalized energy storage resources), if the flexible resource allocation rate reaches 10%, it is qualified, 15% is good, and 20% is excellent.
Indicator calculation result:45.6% in 2022.
Future indicator forecasting methodology: The planned values of generalized energy storage resources and flexible load resources are compared with the predicted values of electricity consumption.
4.4 Secondary index: Global clean source-load matching
Calculation method: With the development of electrical intelligence, the power grid’s ability to predict and perceive load is enhanced, the load can actively support the power grid, and the grid-load interaction is more frequent and efficient. Content three corresponds to the index - flexible resource allocation rate gives the ability of the power grid to regulate supply and demand, in this content, the actual effect of the power grid in regulating supply and demand is mainly considered. In order to achieve the purpose of carbon reduction, the demand for electricity should be met by clean energy, and it is best to realize that the demand for electricity should be fully met by clean energy, without the support of external electricity and local thermal power units. This indicator can be expressed by the matching degree of real-time clean energy generation power and electricity consumption, and the specific calculation formula is as follows:
where Mc is the Clean generation capacity matching; Plc is the local clean power generation; Pn is the national power consumption; Sp is the sampling points.
Evaluation basis: In 2021, the country’s clean energy power generation will be 2,730.4 billion kWh, and the electricity consumption of the whole society will be 8,331.3 billion kWh. Zhejiang Province has a clean energy power generation capacity of 117.4 billion kWh, and the electricity consumption of the whole society is 551.4 billion kWh (China Electricity Council, 2022).
According to the rough calculation of the data, the matching degree of clean source load in China is about 33%, and the matching degree of clean source load in Zhejiang is about 21%.
Evaluation methodology: The closer the value is to 1, the higher the source-load matching. The annual increase in source-load matching degree reaches 5% as qualified, 10% as good, and 15% as excellent. (Or the source-load matching degree of 35% is qualified, 40% is good, and 45% is excellent.)
Indicator calculation result: 61.75% in 2022.
Future indicator forecasting methodology: Since there is no real-time power data, the power generation prediction approximation is used instead:
The clean source-load matching prediction is equal to the local clean power generation forecast divided by the whole society electricity consumption forecast.
where
4.5 Secondary indicators: The proportion of terminal consumption of electric energy
Calculation method: Electricity is the most efficient energy source compared to all energy sources, so while electrification will increase the carbon emissions of the power system, it will reduce the carbon emissions of the entire energy system. Therefore, on the electricity consumption side, we take into account the proportion of final consumption of electric energy, and explain the contribution of the power system to the emission reduction of the entire energy system:
where Rec is the end consumer electricity ratio; En is the national power consumption equivalent energy; Et is the total energy consumption.
Evaluation basis: The national electrification rate is 26.5%, and the proportion of electricity in Zhejiang, Guangdong and Qinghai in final energy consumption exceeds 30% (China Electricity Council, 2021).
Evaluation methodology: referring to the national electrification rate in 2021, an electrification rate of 26.5% is qualified, a 30% is good, and a 33.5% is excellent.
Indicator calculation result: 65.2% in 2022.
Future indicator forecasting methodology: Predict the total electricity consumption and energy consumption of the whole society separately, and then calculate.
Table 2 presents the evaluation findings of Lishui’s electric power transmission network’s zero-carbon indicator system. Our assessment indicates a significant overall reduction in carbon emissions following the implementation of the new electricity system. Notably, improvements made across all three phases of the power cycle (generation, transmission, and consumption) have substantially contributed to this outcome.
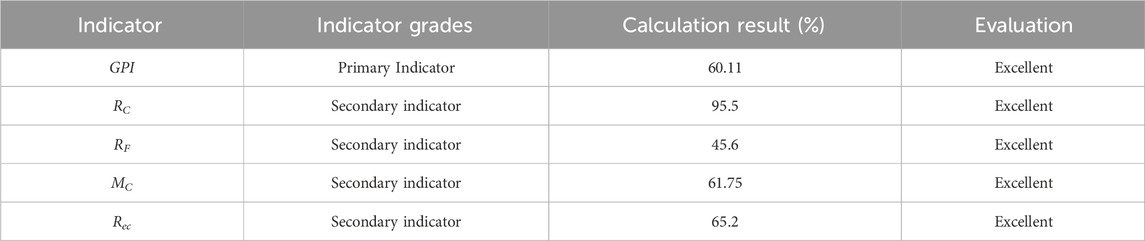
Table 2. Evaluation results for zero-carbon metrics.
5 Conclusion
This article takes Lishui City as an example to explore the carbon reduction practices of the new power system at the municipal level. Firstly, to promote the construction of the new power system, Lishui City has implemented a series of projects, including ten key projects. These projects mainly involve the development of new energy, grid transformation, energy storage technology application, and intelligent distribution network construction. Through the implementation of these projects, Lishui City has accelerated the low-carbon transformation of the power system, improved the efficiency of grid operation, met the diversified electricity demands of users, and optimized the allocation of energy resources. In order to better track and manage carbon emissions, Lishui City has launched an electric carbon traceability model. This model focuses on the power industry and comprehensively monitors and analyzes carbon emissions at various stages of power production, transmission, and consumption, achieving the visualization and quantification of carbon footprints.
To evaluate the carbon reduction effectiveness of the newly constructed power system projects in Lishui City, this article establishes a low-carbon emission evaluation system. With zero carbon as the goal, multiple evaluation indicators are proposed, and the carbon reduction effectiveness of the new power system is evaluated and analyzed based on historical data from Lishui City. The results show that the new power system in Lishui City has achieved significant carbon reduction effectiveness.
The electric carbon traceability model can help monitor and quantify carbon emissions. Based on this, the low-carbon emission reduction evaluation system can assess the effectiveness of carbon reduction policies and measures, providing scientific basis for setting and adjusting low-carbon development goals. Through the low-carbon emission reduction evaluation system, more cities and companies can be motivated to adopt carbon reduction measures, promote technological innovation and energy transition, and contribute to sustainable development and climate change mitigation. The low-carbon emission evaluation system can drive joint efforts from all sectors of society to reduce carbon emissions and achieve sustainable development.
Furthermore, the proposed low-carbon emission reduction evaluation system can assess and evaluate the carbon emissions of various provinces and cities in China to promote carbon reduction and low-carbon development. In the future, we will continue to improve the evaluation system for carbon reduction effectiveness and promote its application in other provinces and cities, expanding its scope of use.
Data availability statement
The original contributions presented in the study are included in the article/Supplementary Material, further inquiries can be directed to the corresponding author.
Author contributions
JY: Writing–original draft. HZ: Writing–original draft. XH: Writing–review and editing. HF: Writing–review and editing. YX: Writing–review and editing. AJ: Writing–review and editing.
Funding
The author(s) declare that financial support was received for the research, authorship, and/or publication of this article. This paper is supported by State Grid Zhejiang Electric Power Co., Ltd. Technology Project under grant: 5211LS230001.
Conflict of interest
JY, HZ, XH, HF, YX and AJ were employed by State Grid Zhejiang Electric Power Co., Ltd, Lishui Power Supply Company.
The authors declare that this study received funding from State Grid Zhejiang Electric Power Co., Ltd. The funder had the following involvement in the study: data collection.
Publisher’s note
All claims expressed in this article are solely those of the authors and do not necessarily represent those of their affiliated organizations, or those of the publisher, the editors and the reviewers. Any product that may be evaluated in this article, or claim that may be made by its manufacturer, is not guaranteed or endorsed by the publisher.
Supplementary material
The Supplementary Material for this article can be found online at: https://www.frontiersin.org/articles/10.3389/fenrg.2024.1329684/full#supplementary-material
Abbreviations
SSCI, subsynchronous control interaction; WSNs, watershed networks; PDNs, power distribution networks; MDS, multi-energy distribution system; PEV, plug-in electric vehicle; SNA, social network analysis; MI-WPUSN, Magnetic Induction-assisted Wireless Power Underground Sensor Network; DEA, Data Envelopment Analysis (); RMB, Ren Min Bi; MW, Megawatt; GPI, Green power index.
References
Cai, Z., Dai, S., Cui, H., et al. (2023). Reserve capacity retention scheme for regional power grids by province (1): mechanism design. Proc. CSEE 43, 61–70. doi:10.13334/j.0258-8013.pcsee.212546
Cao, Y., Zhou, B., Chung, C. Y., Shuai, Z., Hua, Z., and Sun, Y. (2022). Dynamic modelling and mutual coordination of electricity and watershed networks for spatio-temporal operational flexibility enhancement under rainy climates. IEEE Trans. smart grid 14, 3450–3464. doi:10.1109/TSG.2022.3223877
Cheng, Y., Zhang, N., Wang, Y., Yang, J., Kang, C., and Xia, Q. (2018). Modeling carbon emission flow in multiple energy systems. IEEE Trans. Smart Grid 10 (4), 3562–3574. doi:10.1109/tsg.2018.2830775
China Electricity Council (2021). China electrification annual development report 2021. Beijing: China Building Materials Industry Press.
China Electricity Council (2022). China electric power statistical yearbook 2022. Beijing: China Statistics Press.
Duan, Y., Zhao, Y., and Hu, J. (2023). An initialization-free distributed algorithm for dynamic economic dispatch problems in microgrid: modeling, optimization and analysis. Sustain. Energy, Grids Netw. 34, 101004. doi:10.1016/j.segan.2023.101004
Fan, J., and Zhou, X. (2023). Optimization of a hybrid solar/wind/storage system with bio-generator for a household by emerging metaheuristic optimization algorithm. J. Energy Storage 73, 108967. doi:10.1016/j.est.2023.108967
Gao, Z. Y., Zhang, J., Zhuang, W. J., et al. (2023). Reflections on some of the characteristics of the new power system. Power autom. Equip. (04-18), 1–14. doi:10.16081/j.epae.202209007
General Office of the Ministry of Ecology and Environment (2023). Notice on doing a good job of managing power industry enterprise greenhouse gas emission report for 2023-2025. Available at https://www.mee.gov.cn/xxgk2018/xxgk/xxgk06/202302/t20230207_1015569.html.
Hou, M., Zhao, Y., and Ge, X. (2017). Optimal scheduling of the plug-in electric vehicles aggregator energy and regulation services based on grid to vehicle. Int. Trans. Electr. Energy Syst. 27 (6), e2364. doi:10.1002/etep.2364
Hu, F., Wei, S., Qiu, L., Hu, H., and Zhou, H. (2024). Innovative association network of new energy vehicle charging stations in China: structural evolution and policy implications. Heliyon 10 (2), e24764. doi:10.1016/j.heliyon.2024.e24764
Jiang, Y. (2018). Study on evaluation method and system of green development of Hainan electric power. North China Electric Power University.
Lei, X. M., He, J. J., Yang, S. B., et al. (2022). Feasibility and environmental protection of "zero carbon rural"from the perspective of energy transition take F village in middle area of shaanxi province as an example. J. Beijing Inst. Technol. Sci. Ed. 22 (5), 32–41.
Lei, Y., Yanrong, C., Hai, T., Ren, G., and Wenhuan, W. (2023). DGNet: an adaptive lightweight defect detection model for new energy vehicle battery current collector. IEEE Sensors J. 23 (23), 29815–29830. doi:10.1109/JSEN.2023.3324441
Li, P., Hu, J., Qiu, L., Zhao, Y., and Ghosh, B. K. (2022a). A distributed economic dispatch strategy for power–water networks. IEEE Trans. Control Netw. Syst. 9 (1), 356–366. doi:10.1109/TCNS.2021.3104103
Li, S., Zhao, X., Liang, W., Hossain, M. T., and Zhang, Z. (2022b). A fast and accurate calculation method of line breaking power flow based on taylor expansion. Front. Energy Res. 10. doi:10.3389/fenrg.2022.943946
Li, Y. (2017). Interpretation 3 of the revised Measures for demand side Management of electric power. Electr. demand side Manag. 19, 62–64. CNKI:SUN:DLXQ.0.2017-06-019.
Li, Z., Xu, Y., Wang, P., and Xiao, G. (2023). Coordinated preparation and recovery of A post-disaster multi-energy distribution system considering thermal inertia and diverse uncertainties. Appl. Energy 336, 120736. doi:10.1016/j.apenergy.2023.120736
Li, Z., Xu, Y., Wu, L., and Zheng, X. (2020). A risk-averse adaptively stochastic optimization method for multi-energy ship operation under diverse uncertainties. IEEE Trans. Power Syst. 36 (3), 2149–2161. doi:10.1109/TPWRS.2020.3039538
Lin, B. Y., and Yang, M. Q. (2022). Research status, challenges and development direction of China's power system under the background of carbon neutrality. J. Xi'an Jiaot. Univ. Technol. Soc. Sci. Ed. 42, 1–10. doi:10.15896/j.xjtuskxb.202205001
Liu, G. (2021). Data collection in MI-assisted wireless powered underground sensor networks: directions, recent advances, and challenges. IEEE Commun. Mag. 59 (4), 132–138. doi:10.1109/MCOM.001.2000921
Liu, J. Z. (2022). The intelligent development path of electric power that supports the construction of new power systems. Energy Technol. 20, 3–7. CNKI:SUN:SBMT.0.2022-04-001.
Liu, P., Yang, W. H., Zhang, J., et al. (2021). Prospects for emission reduction technologies under carbon neutral targets. Mod. Chem. Ind. 41 (6), 6–10.
Luo, J., Zhuo, W., Liu, S., and Xu, B. (2024). The optimization of carbon emission prediction in low carbon energy economy under big data. IEEE Access 12, 14690–14702. doi:10.1109/ACCESS.2024.3351468
Lyu, W., Hu, Y., Liu, J., Chen, K., Liu, P., Deng, J., et al. (2024). Impact of battery electric vehicle usage on air quality in three Chinese first-tier cities. Sci. Rep. 14 (1), 21. doi:10.1038/s41598-023-50745-6
Pei, D. H. (2021). Research on the construction path of near-zero carbon emission demonstration zone. Leather Manuf. Environ. Technol. 2 (6), 155–156.
Shang, M., and Luo, J. (2021). The Tapio decoupling principle and key strategies for changing factors of Chinese urban carbon footprint based on cloud computing. Int. J. Environ. Res. Public Health 18 (4), 2101. doi:10.3390/ijerph18042101
Shirkhani, M., Tavoosi, J., Danyali, S., Sarvenoee, A. K., Abdali, A., Mohammadzadeh, A., et al. (2023). A review on microgrid decentralized energy/voltage control structures and methods. Energy Rep. 10, 368–380. doi:10.1016/j.egyr.2023.06.022
Wang, C. Q., Chen, Y., Wen, F. S., et al. (2022). Improvement and improvement of carbon emission flow theory of power system. Grid Technol. 46, 1683–1693. doi:10.13335/j.1000-3673.pst.2021.2071
Wang, Y., Yang, H., Xie, X., Yang, X., and Chen, G. (2023). Real-time subsynchronous control interaction monitoring using improved intrinsic time-scale decomposition. J. Mod. Power Syst. Clean Energy 11 (3), 816–826. doi:10.35833/MPCE.2021.000464
Xiao, H. Q., Li, T. J., Zhang, D. X., et al. (2021). New issues and key technologies in the planning of new power systems under the dual carbon goals. High. Volt. Technol. 47, 3036–3046. doi:10.13336/j.1003-6520.hve.20210809
Xie, X. R., Ma, N. J., Liu, W., et al. (2023). Review and prospect of energy storage application functions in new power system. Proc. CSEE 43, 158–169. doi:10.13334/j.0258-8013.pcsee.220025
Xu, X., Wang, C., and Zhou, P. (2021). GVRP considered oil-gas recovery in refined oil distribution: from an environmental perspective. Int. J. Prod. Econ. 235, 108078. doi:10.1016/j.ijpe.2021.108078
Yan, C., Zou, Y., Wu, Z., and Maleki, A. (2024). Effect of various design configurations and operating conditions for optimization of a wind/solar/hydrogen/fuel cell hybrid microgrid system by a bio-inspired algorithm. Int. J. Hydrogen Energy 60, 378–391. doi:10.1016/j.ijhydene.2024.02.004
Zhang, N., Li, Y. W., and Huang, J. H. (2023). “Carbon measurement method and carbon meter system of the whole link of power system,” in Power Syst. autom. Available at: http://kns.cnki.net/kcms/detail/32.1180.TP.20230310.1635.008.html.04-18
Zhang, S. L. (2022). Thinking on optimizing and adjusting the carbon emission factor of the power grid under the background of "dual carbon. Manag. Chin. power Enterp. 679, 62–65. CNKI:SUN:ZGDQ.0.2022-22-018.
Zhong, W., Chen, J., Liu, M., er, al., and Milano, F. (2021). Coordinated control of virtual power plants to improve power system short-term dynamics. Energies 14 (4), 1182. doi:10.3390/en14041182
Zhong, W., Tzounas, G., and Milano, F. (2022). Improving the power system dynamic response through a combined voltage-frequency control of distributed energy resources. IEEE Trans. Power Syst. 37 (6), 4375–4384. doi:10.1109/tpwrs.2022.3148243
Zhou, T., Kang, C., Xu, Q., et al. (2012a). Preliminary investigation on a method for carbon emission flow calculation of power system. Automation Electr. Power Syst. 36 (11), 44–49.
Keywords: new power system, carbon emission flow, electric carbon traceability model, carbon reduction evaluation index, evaluation system
Citation: Ye J, Zhang H, Hu X, Feng H, Xu Y and Ji A (2024) Exploration of carbon reduction in new municipal power systems. Front. Energy Res. 12:1329684. doi: 10.3389/fenrg.2024.1329684
Received: 29 October 2023; Accepted: 19 March 2024;
Published: 28 March 2024.
Edited by:
Liansong Xiong, Xi’an Jiaotong University, ChinaReviewed by:
Shengfei Yin, Berkeley Lab (DOE), United StatesHong Lerong, Hunan University, China
Flah Aymen, École Nationale d'Ingénieurs de Gabès, Tunisia
Copyright © 2024 Ye, Zhang, Hu, Feng, Xu and Ji. This is an open-access article distributed under the terms of the Creative Commons Attribution License (CC BY). The use, distribution or reproduction in other forums is permitted, provided the original author(s) and the copyright owner(s) are credited and that the original publication in this journal is cited, in accordance with accepted academic practice. No use, distribution or reproduction is permitted which does not comply with these terms.
*Correspondence: Xinwei Hu, MTA3NTUyMjA0NDcyQHN0dS54anUuZWR1LmNu