 Jawed Mustafa
 Saeed Alqaed1,2
- 1Mechanical Engineering Department, College of Engineering, Najran University, Najran, Saudi Arabia
- 2Science and Engineering Research Center, Najran University, Najran, Saudi Arabia
- 3Department of Nutrition, Cihan University-Erbil, Iraq
- 4Department of Mechanical Engineering, Eastern Mediterranean University, Famagusta, Turkey
- 5Department of Medical Research, China Medical University Hospital, China Medical University, Taichung, Taiwan
In this study, a finite element analysis is employed to numerically investigate the thermal behavior of a battery pack comprising cylindrical lithium-ion cells. The system incorporates air cooling with phase change material (PCM) surrounding the batteries and nanofluid (NFD) circulating within the PCM through tubes of varying diameters (ranging from 2 mm to 6 mm) at flow rates (FRT) spanning 5 mL/min to 20 mL/min. A two-phase mixture model is applied to analyze the behavior of the NFD as it changes phase. The transient simulation covers a 1-h period to assess temperature variations of the NFD, batteries, surrounding air, PCM, and the phase change process within the PCM. Our results indicate that variations in NFD flow rate (NFFR) do not significantly affect the PCM’s molten fraction during PCM melting, coinciding with an increase in battery temperature (TBT). However, during the PCM refreezing phase, a FRT of 15 mL/min results in the highest quantity of solid PCM. The outlet temperature (TOT) of the NFD demonstrates a cyclical pattern of increase and decrease over time. We observe that when the NFD temperature is elevated, the lowest TOT of the NFD is associated with a FRT of 5 mL/min. Conversely, when the NFD temperature is lowered, this FRT leads to the highest TOT of the NFD. The TBT exhibits some sensitivity to changes in FRT within the initial half-hour, with a subsequent decline, particularly with a FRT of 15 mL/min.
1 Introduction
Researchers have become interested in energy-related topics because of the growing significance of energy to a nation’s progress. Especially, developed countries have invested in one or more source of new energies. Wind energy, geothermal energy, sea wave energy, and solar energy have received more attention than other ones (Batista et al., 2023; Kumar et al., 2023; Rana et al., 2023). Considering the energy subjects in the field of transportation is also an important topic because a large amount of energy is spent on transportation by different vehicles every year. The use of hybrid vehicles by employing new energy sources can ultimately reduce energy consumption on a large scale. Batteries are an important part of hybrid vehicles. They are placed in packs with different numbers so that they can store the energy required to move the vehicle. In the last decade, researchers have paid more attention to this type of battery that has been utilized in electric vehicles. The enhancement in the production of these vehicles has caused various manufacturers to develop the field. Today, even electric trucks are produced in some countries that require batteries with a high energy storage capacity (Zhao et al., 2021; Annamalai and Amutha prabha, 2023; Mohammed et al., 2023). The number of different studies in the field of batteries is too high, indicating the need for progress in this field in the industry. One of the important areas in battery research is their cooling process, which is practical and crucial (Sefidan et al., 2017; Tran et al., 2017; Xu et al., 2017; Han et al., 2018; Mukhopadhyay et al., 2018). Hence, they require cooling when operating at charging rates. Sarchami et al. (Sarchami et al., 2022) examined a liquid-cooled system with a combination of copper plates. They utilized alumina-water NFD with different volume fractions φ) and evaluated its effect in a wavy channel. The presence of this cooling system improved battery performance and battery surface temperature. Luo et al. (Luo et al., 2022) conducted a review on battery thermal management systems and demonstrated that the use of PCMs improves battery performance, and on the other hand, the use of these materials leads to better performance in the cold climate. Also, the use PCMs along with other cooling techniques has better performance in battery thermal management systems.
The heat transfer in batteries is practical and has important applications in the hybrid vehicle industry. Researchers have considered the thermal management of batteries using different methods, including passive and active techniques (Park, 2013; Goli et al., 2014; Sun and Dixon, 2014; Tran et al., 2014; Zou et al., 2014). The use of PCMs without the need for external energy can control the temperature of a device until the complete melting of the PCM (Babapoor et al., 2015; Lin et al., 2015; Jiang et al., 2016). Also, the use of free and forced convection of different fluid flows is another method of managing the temperature of different devices. NFDs have reportedly been used in the field of battery thermal management, particularly recently, according to earlier studies (Aberoumand et al., 2020; Wiriyasart et al., 2020; Zhou et al., 2021). Thus, in this article, a thermal analysis is done on a three-dimensional BPC with a few battery cells. Airflow, laminar NFD flow, and PCM are used to control the TBT. The simulations are carried out transiently in an hour by varying the NFFR inside the tube in the middle of the PCM and the tube’s diameter. All of the battery cells are encircled by the PCM, and the air velocity is maintained. One of the innovations of the current study is the analysis in three dimensions. Another novelty of the current study is the concurrent use of air, NFD, and PCM for battery temperature management.
2 Battery pack geometry
25 cylindrical lithium-ion batteries are arranged in a square to make up the BPC.
The BPC is shown schematically in Figure 1. A laminar airflow channel with a velocity of 0.001 m/s contains the BPC. The BPC is filled with PCM and a spiral tube containing alumina-water NFD flow is located inside the PCM. The NFD flows in a laminar regime with a FRT of 5–20 mL/min. The tube’s diameter ranges from 2 to 6 mm. The study of the BPC took 1 hour to complete.
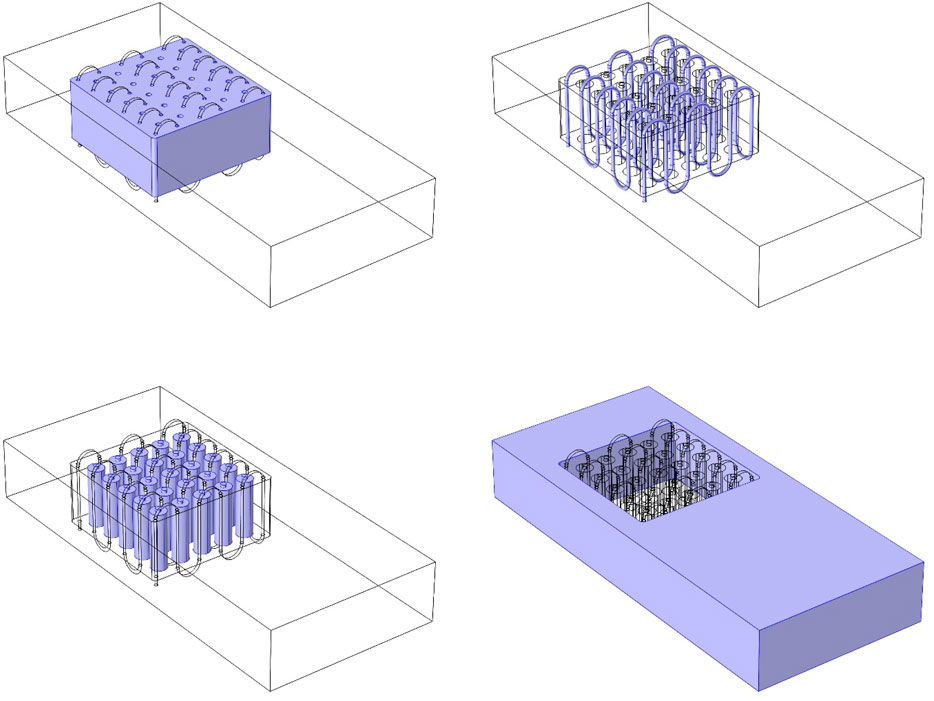
FIGURE 1. A schematic of the BPC and its thermal management system.
3 Governing equations for the BPC and cooling system
The battery formula are shown 1–4. These Equations used to solve the battery. It is important to note that the heat produced by the battery is caused by its internal resistance, indicating that the heat produced by the battery’s entropy.
The equations used to solve the airflow are provided in Eqs 5–7 by assuming incompressible and Newtonian airflow (Nazer-Nejad et al., 2018).
Eqs 8–16 presents the equations used for the melting and freezing fronts in the PCM. The momentum and energy equations, along with the diffusion and heat transfer equations, are solved using the assumption that the liquid PCM is Newtonian (Biwole et al., 2013).
where u, k, ρ, and
Equations (23)–(27) presents the relations to calculate the properties of the two-phase NFD flow.
Table 1 presents the properties of nanoparticle, PCM, and water (Yang et al., 2016; Pordanjani et al., 2023).
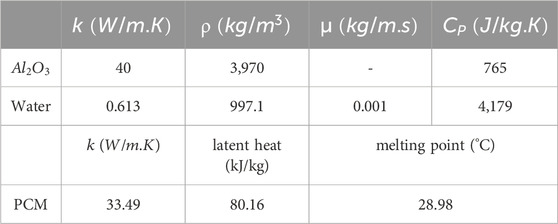
TABLE 1. Thermophysical properties of PCM, water, and
4 Grid study, numerical method, and validation
The performance of the BPC and its cooling system are examined using the FEM and COMSOL software. The flow of NFD is solved using the two-phase mixture method. An unstructured grid is generated on the geometry (Figure 2). The grid study demonstrates that the grid with 1,865,000 elements is suitable for the simulations. Table 2 presents the method of meshing and compares the results obtained from various grid resolutions.
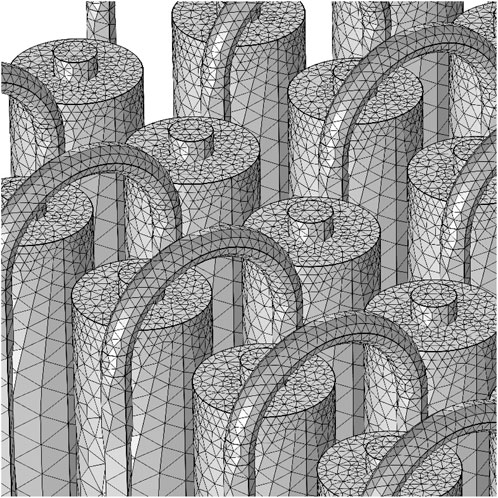
FIGURE 2. A schematic of the grid generated on the geometry.

TABLE 2. Average temperature of battery for different grid qualities.
In this section, the validation of the developed code is discussed. The T-Av of the cell in an adiabatic mode is displayed in Figure 3. The results of the present research are compared with the numerical and experimental investigations. There is a slight difference between the experimental data and the present results. But, the use of the developed method leads to excellent results and the results are better than other numerical ones. The difference in the T-Av is due to the weakness of the modeling, not having the exact values of the partial derivative of the open-circuit voltage in terms of the temperature and other properties and parameters of the model. The comparison between the present results and those reported by Ye et al. (Ye et al., 2012) and Wu et al. (Wu et al., 2012) demonstrates the high accuracy of the present simulations. They investigated the T-BY by solving the equations governing the battery.
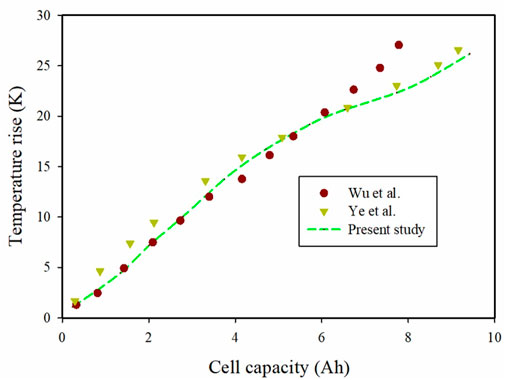
FIGURE 3. Comparison of numerical results obtained in this study with numerical and laboratory results.
5 Results and discussion
Figure 4 illustrates the temperature contours of the air passing through the channel at different times of 15, 30, 45, and 60 min when the NFFR is 5 mL/min. The low quantity of molten PCM in the first 15 min is what causes the low air temperature. The air temperature increases after 30 min have passed and a significant portion of PCM has melted. In the components that are in touch with the PCM, the air temperature is much greater. In 45 min, the quantity of molten PCM in the container decreases, which causes a modest drop in air temperature. The atmospheric temperature drops, particularly during the first hour after the batteries’ heat output ends.
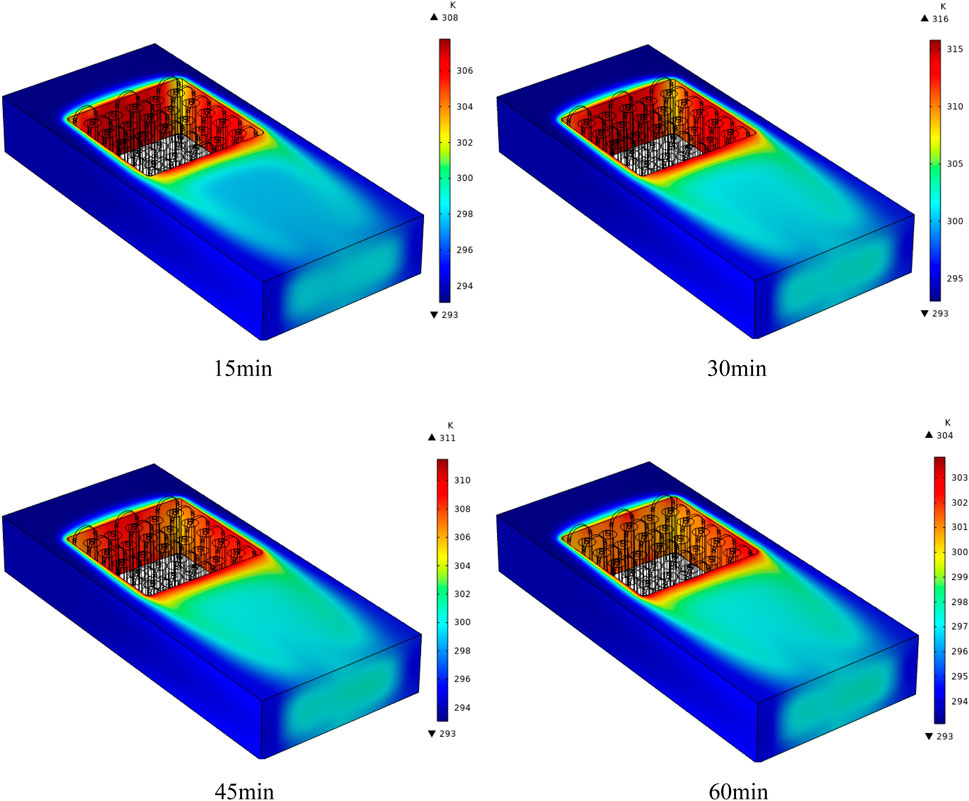
FIGURE 4. Temperature contours of the air passing through the channel at different times of 15, 30, 45, and 60 min when the NFFR is 5 mL/min.
When the NFFR is 5 mL/min, Figure 5 shows the temperature contours of the PCM enclosure for various durations of 15, 30, 45, and 60 min. The PCM’s melting or freezing states have a significant impact on its temperature. At the time of PCM phase change, its temperature does not change considerably due to the latent heat of melting in PCM. However, when it is solid, the temperature can be lower than its melting point, and when it melts, the temperature can be higher than its melting point. In 15 min, the central parts of the PCM are at a high temperature, and the side parts that are in contact with the air are at a low temperature. In 30 min, the central parts are at a higher temperature than the side parts, but the side parts do not have much temperature difference from the middle parts of PCM. In 45 min, the temperature of different parts of PCM is close to each other and the NFD flow causes the PCM temperature to reduce in some parts. In 1 hour the temperature of PCM is decreased because its temperature can be lower than its melting point due to the freezing of all PCM. Hence, there are some parts with a low temperature in the middle parts.
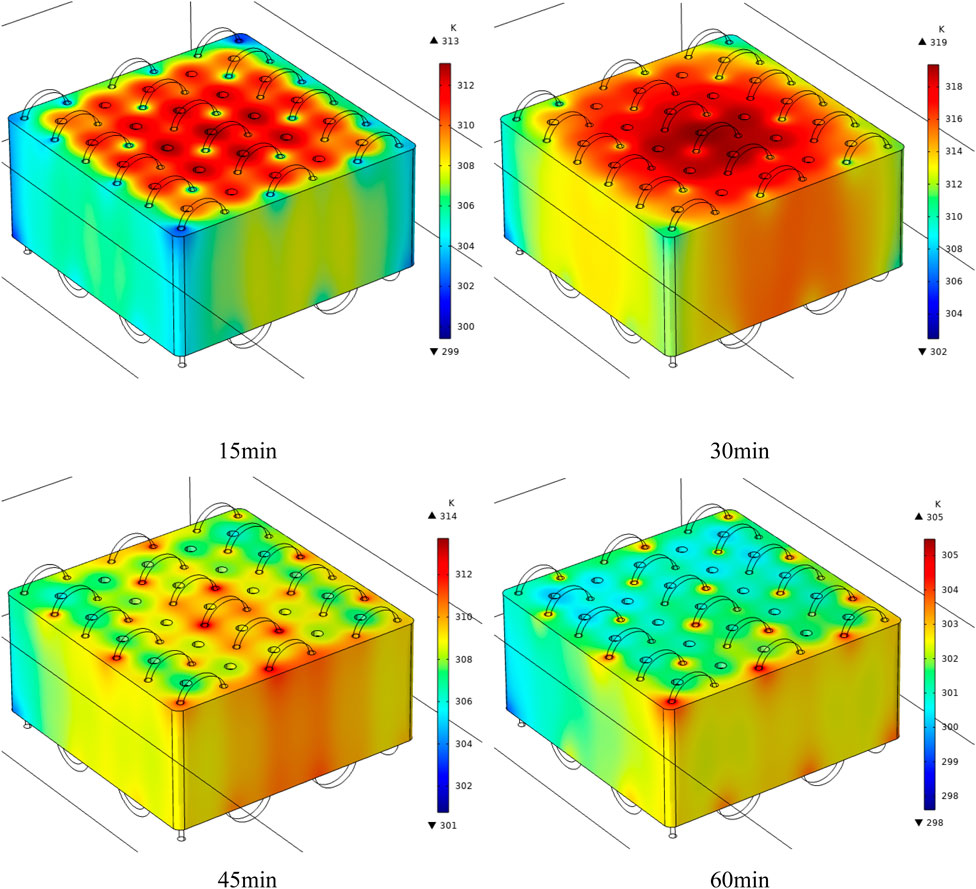
FIGURE 5. Temperature contours of the PCM enclosure for different times of 15, 30, 45, and 60 min when the NFFR is 5 mL/min.
When the NFFR is 5 mL/min, Figure 6 shows the temperature contours of the tube in the BPC at various times of 15, 30, 45, and 60 min. The temperature of the NFD in the tube depends on the time. In 15 min, the temperature of the parts of the tube that are located inside the PCM is high. But, the parts of the tube that are placed outside the PCM have a low temperature. The temperature of the tube in the direction of the NFD flow is low. It is increased when the NFD enters the middle of the PCM and collides with the hot PCM. In 30 min, the tube has a high temperature and even the parts of the tube that are placed out of the PCM are heated. At this time, due to the melting of PCM, the temperature of the tube and NFD becomes higher. At the time of 45 min, the tube temperature is reduced. The temperature of various parts of the tube, especially those located inside the PCM, decreases as the amount of molten PCM decreases. Finally, around the hour mark, the temperature of the tube portions within the PCM decreases, which is the primary factor in the PCM solidifying since less heat is generated in the batteries. In certain areas, the NFD’s temperature drops as a result.
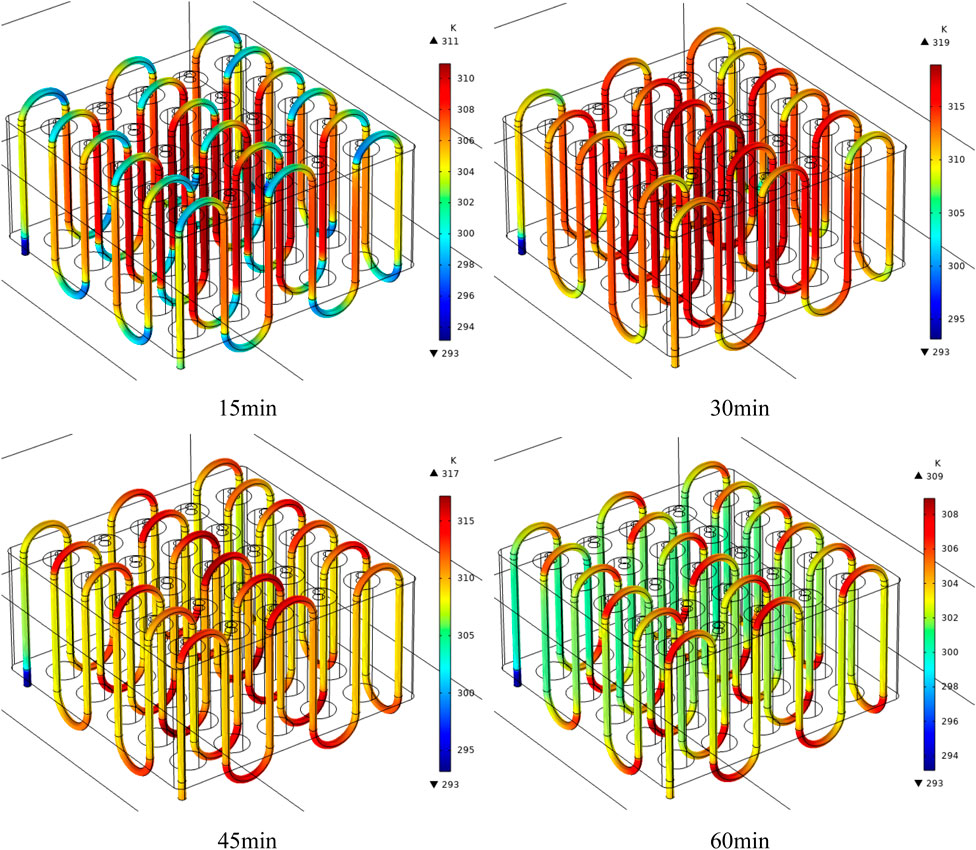
FIGURE 6. Temperature contours of the tube in the BPC for different times of 15, 30, 45, and 60 min when the NFFR is 5 mL/min.
The temperature contours on the battery cells for various durations of 15, 30, 45, and 60 min are shown in Figure 7 when the NFFR is 5 mL/min. Time is a factor in TBT cells. The maximal TBT cell number may be observed to increase initially before declining. The batteries in the center of the BPC reach a high temperature at 15, 30, and 45 min, as do the batteries in the rear row. The batteries on the final row reach their highest temperature in an hour. At the time of 15 and 30 min, the side batteries are at a low temperature. In 45 min, the two batteries placed at the corner have a particularly low temperature, and in 1 h, the batteries located at the air side have the minimum temperature among the battery cells. The presence of airflow in the channel causes the batteries placed at the inlet to have a low temperature. The presence of NFD flow that is not aligned with the airflow also causes the TBT cells to be closer to each other at the inlet and outlet sides.
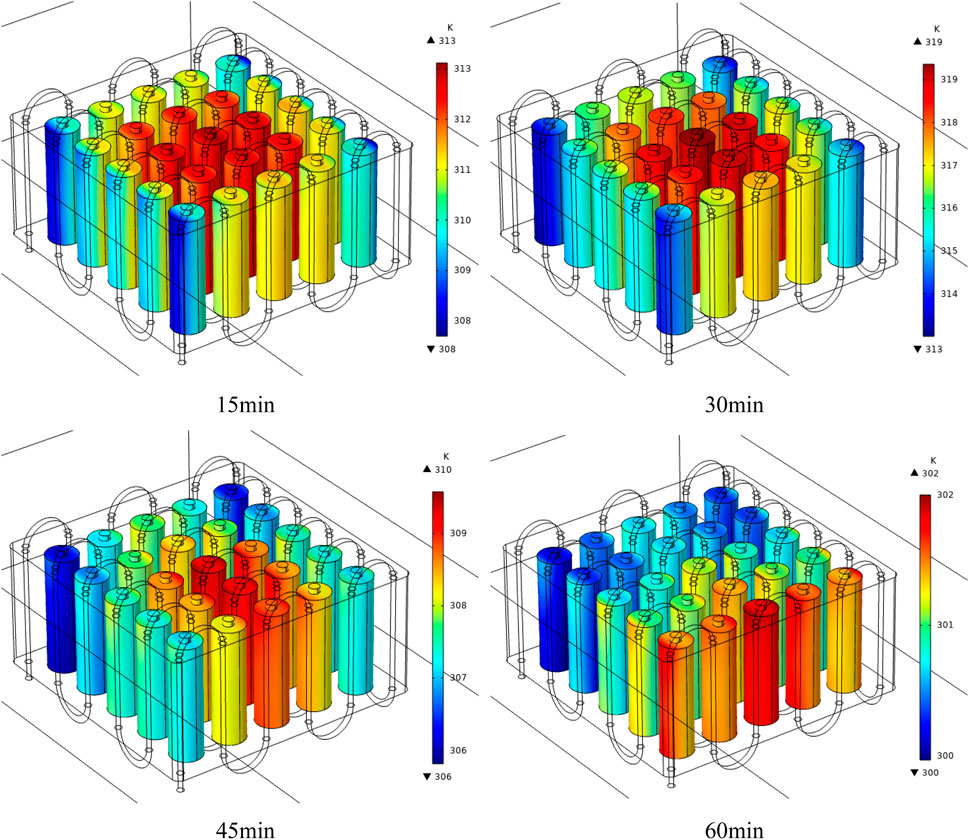
FIGURE 7. Temperature contours on battery cells for different times of 15, 30, 45, and 60 min when the NFFR is 5 mL/min.
Figure 8 depicts the temperature contours on the horizontal and vertical cross-sections of the BPC for the TDBs ranging from 2 to 6 mm. The horizontal cross-sections are shown on the left side, and the temperature distribution can be seen on them. In the horizontal cross-sections, the temperature is enhanced in the flow direction due to the symmetry of the temperature distribution on the first and third planes. But the maximum temperature is observed for the last plane. By moving along the flow direction, the temperature of the NFD is enhanced due to the heat received from the PCM and the batteries.
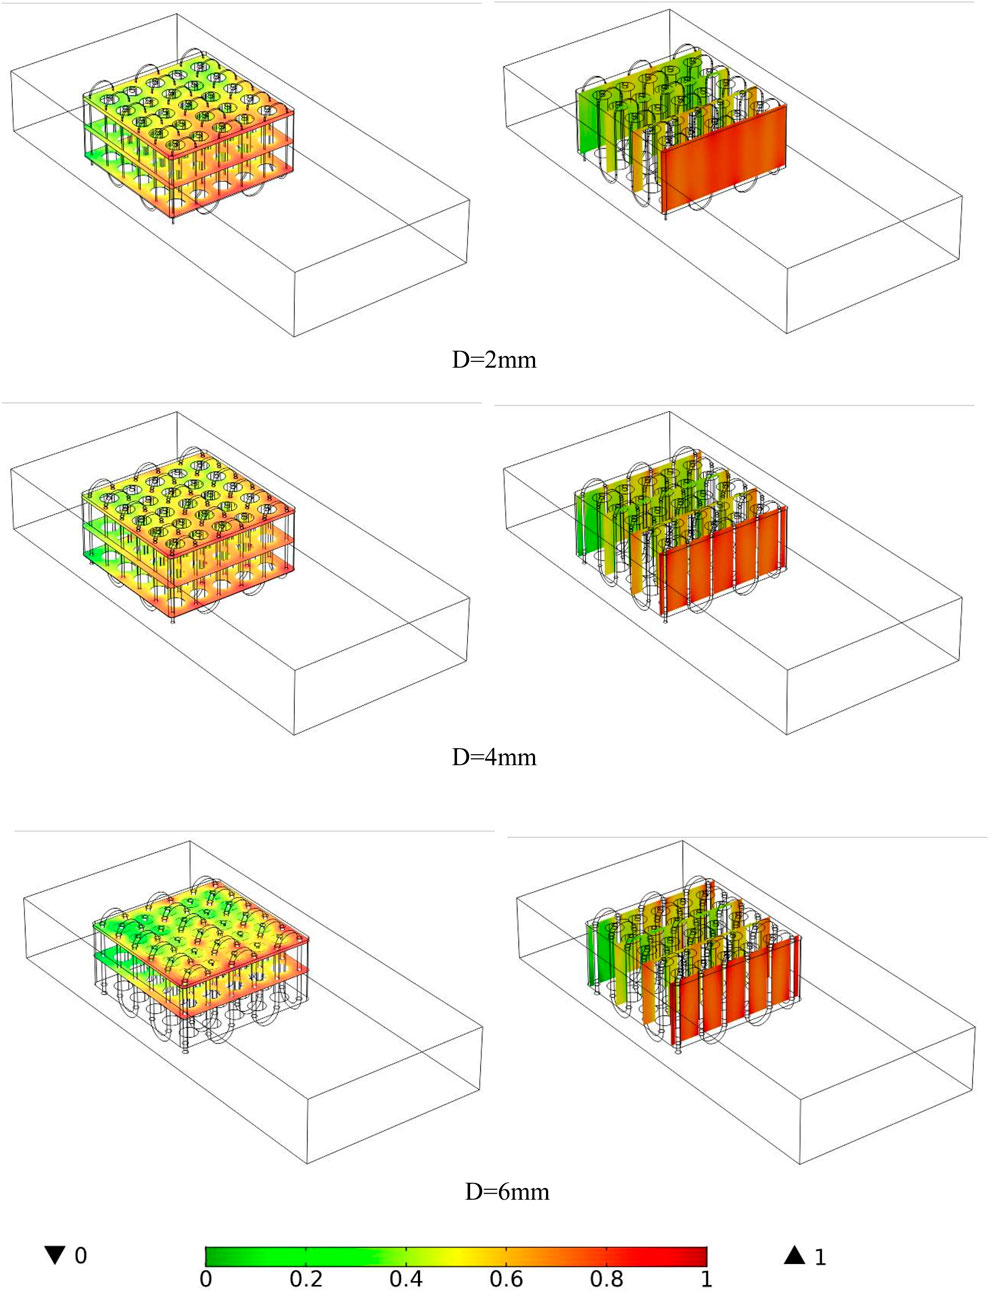
FIGURE 8. Temperature on horizontal and vertical cross-sections of the BTPK for three TDBs of 2–6 mm.
The temperature contours on the horizontal and vertical cross-sections of the BPC are shown in Figure 9 for various NFD in-tube velocities. According to the figure, the vertical cross-sections are placed on the right side and the horizontal cross-sections are located on the left side. As the NFFR is enhanced, the temperature of batteries and PCM is reduced due to the increment in heat transfer from PCM and batteries. By enhancing the FRT, the thermal energy held in the PCM is released outside. Temperature control is maintained for the T-BT. Phase change makes the temperature on the BPC uniform and keeps the battery. This issue can be seen in the cross-sections. Better temperature uniformity is created at horizontal cross-sections of the pack by enhancing the FRT. The last horizontal plane has a higher temperature than the rest of the planes. The temperature of the initial rows of batteries is reduced more when the FRT of the NFD is enhanced, whereas the temperature of the latter rows of batteries is intensified significantly.
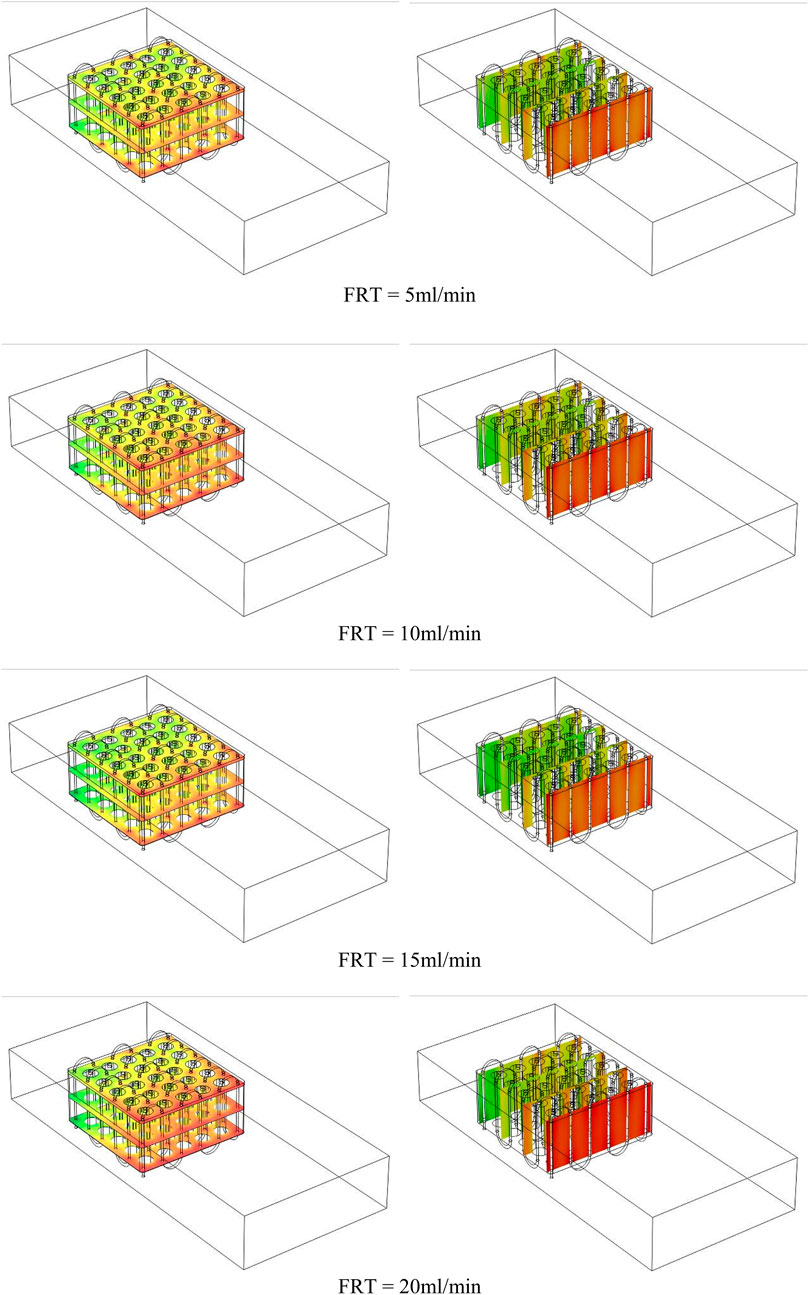
FIGURE 9. Temperature on horizontal and vertical cross-sections of the BTPK for different velocities of NFs in the tube.
Figure 10 demonstrates the TBT up to 1 h for the NFFR ranging from 5 to 20 mL/min. Using the temperature control system designed for the battery, the average TBT is slightly higher than 303 K in most cases, which is acceptable. The use of NFD flow to make the TBT cells more uniform, as well as the application of airflow to reduce the temperature of the batteries cause the average TBT to be acceptable. Also, the use of PCM avoids a sudden enhancement and temperature jump in battery cells. The BPC experiences an increase in temperature at a time of nearly half an hour. After this time, the airflow in the channel reduces the temperature. Until this time, the temperature in the batteries is high and after this time, the temperature is decreased due to the non-working of the batteries. The temperature reduction of the BPC is higher at the NFFR of 15 mm/min than the FRTs in the second half hour. In other NFFRs, the TBT is close to each other. Due to the weak flow of NFD, its variations have little effect on the TBT. Based on the design, the flow of NFD flow is used to close the TBT cells located at the inlet and outlet.
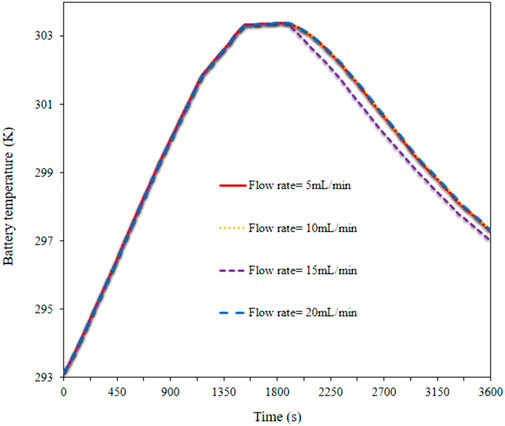
FIGURE 10. TBT up to 1 h for the NFFR ranging from 5 to 20 mL/min.
Figure 11 demonstrates the TOT of the NFD up to 1 h for the NFFR ranging from 5 to 20 mL/min. The TOT of the NFD is dependent on various factors. The airflow in the channel, the melting or freezing of PCM, the heat generated in the battery, the FRT of the NFD, and even time influence the TOT of the NFD. When the laminar air flows in the channel steadily, its cooling power is enhanced so that it can reduce the TBT and PCM. Hence, after a certain time, the temperature of the NFD, batteries, and PCM is decreased. As long as the batteries generate heat, the temperature of the NFD is enhanced. When the batteries stop working, the temperature of the NFD is decreased. The minimum value of the TOT of the NFD occurs at a FRT of 5 mL/min. When the NFD temperature has a decreasing trend, this FRT leads to the maximum TOT of the NFD among different FRTs. During the increasing trend of the NFD TOT, the FRT of 20 mL/min is the maximum value of the TOT of the NFD among different FRTs. The FRT of 15 mL/min results in the minimum temperature of the NFD at the outlet. In this FRT, the enhancing trend of NFD TOT is decreased earlier and the change in the NFD temperature is observed in a shorter time.
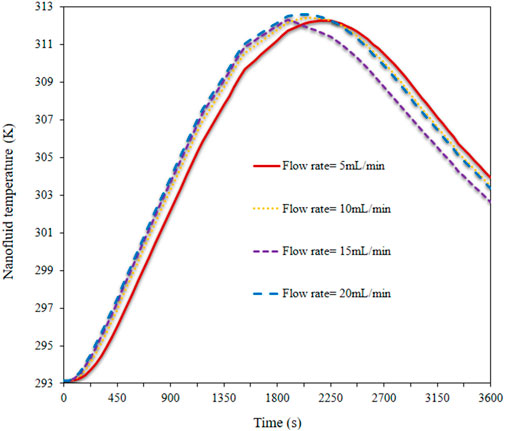
FIGURE 11. TOT of the NFD up to 1 h for the NFFR ranging from 5 to 20 mL/min.
The volume percentage of molten PCM for the NFFR ranges from 5 to 20 mL/min up to 1 h as shown in Figure 12. The temperature of the PCM first rises because of the heat produced in the battery cells and the poor airflow in the channel. Consequently, the melting process starts. In less than 15 min, a substantial portion of PCM is converted to the liquid phase at various FRTs of NFD.
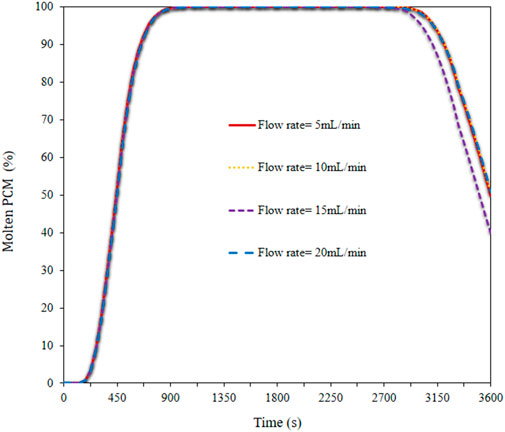
FIGURE 12. Volume fraction of molten PCM for the NFFR ranging from 5 to 20 mL/min up to 1 h.
The PCM stays in the liquid phase for a long period. The PCM phase transition is impacted by airflow and NFD, which also lowers battery temperatures. The low velocity flows, particularly the NFD flow, are employed to increase the BPC’s temperature uniformity. The PCM freezing process begins after 40 min. At this point, the PCM temperature decreases and the freezing process begins as a result of the correct flow of air around the BPC and an NFD in the tube. The PCM begins to freeze since the batteries are not producing enough heat. The impact of altering the NFD’s FRT is now evident. The NFFR of 15 mL/min causes the greatest amount of phase shift at this moment.
6 Conclusion
In this article, a three-dimensional simulation is done on the cooling of a BPC with the presence of a laminar flow of NFD and air as well as PCM. The air flows around the PCM and the NFD flows in a tube inside the PCM. By changing the tube diameter and NFFR, TBT, TOT of NFD, and volume fraction of molten PCM are transiently examined. The results of this study demonstrate:
1- The use of NFD and air flows and PCM can control the TBT. Besides, they lead to the proper temperature uniformity among the battery cells.
2- In the first half an hour, the TBT is enhanced by 303 K, which is the maximum TBT. After that, the temperature is reduced.
3- The effect of FRT on the TBT is small until the first half hour. After this time, the temperature of the NFD becomes lower than in other conditions at a FRT of 15 mL/min.
4- The TOT of the NFD has increasing and decreasing trends. When the temperature is enhanced, the minimum TOT of the NFD occurs at a FRT of 5 mL/min, but when the FRT is decreased, the TOT of the NFD becomes higher.
5- During the PCM melting process, changing the FRT of NFD has little effect on the volume fraction of molten PCM, but during its re-freezing, the use of a FRT of 15 mL/min results in the maximum amount of solid PCM.
Data availability statement
The original contributions presented in the study are included in the article/Supplementary Material, further inquiries can be directed to the corresponding authors.
Author contributions
JM: Conceptualization, Formal Analysis, Funding acquisition, Methodology, Writing–original draft, Writing–review and editing. SA: Data curation, Investigation, Supervision, Writing–review and editing. SS: Formal Analysis, Supervision, Validation, Writing–review and editing. HA: Methodology, Project administration, Software, Visualization, Writing–review and editing.
Funding
The author(s) declare that no financial support was received for the research, authorship, and/or publication of this article.
Acknowledgments
The authors are thankful to the Deanship of Scientific Research and under the supervision of the Science and Engineering Research Centre at Najran University for funding this work under the Research centers Funding program grant code (NU/RCP/SERC/12/12).
Conflict of interest
The authors declare that the research was conducted in the absence of any commercial or financial relationships that could be construed as a potential conflict of interest.
Publisher’s note
All claims expressed in this article are solely those of the authors and do not necessarily represent those of their affiliated organizations, or those of the publisher, the editors and the reviewers. Any product that may be evaluated in this article, or claim that may be made by its manufacturer, is not guaranteed or endorsed by the publisher.
References
Aberoumand, S., Woodfield, P., Shabani, B., and Dao, D. V. (2020). Advances in electrode and electrolyte improvements in vanadium redox flow batteries with a focus on the nanofluidic electrolyte approach. Phys. Rep. 881, 1–49. doi:10.1016/j.physrep.2020.08.001
Annamalai, M. C., and Amutha prabha, N. (2023). A comprehensive review on isolated and non-isolated converter configuration and fast charging technology: for battery and plug in hybrid electric vehicle. Heliyon 9, e18808. doi:10.1016/j.heliyon.2023.e18808
Babapoor, A., Azizi, M., and Karimi, G. (2015). Thermal management of a Li-ion battery using carbon fiber-PCM composites. Appl. Therm. Eng. 82, 281–290. doi:10.1016/j.applthermaleng.2015.02.068
Batista, N. E., Carvalho, P. C. M., Fernández-Ramírez, L. M., and Braga, A. P. S. (2023). Optimizing methodologies of hybrid renewable energy systems powered reverse osmosis plants. Renew. Sustain. Energy Rev. 182, 113377. doi:10.1016/j.rser.2023.113377
Biwole, P. H., Eclache, P., and Kuznik, F. (2013). Phase-change materials to improve solar panel's performance. Energy Build. 62, 59–67. doi:10.1016/j.enbuild.2013.02.059
Goli, P., Legedza, S., Dhar, A., Salgado, R., Renteria, J., and Balandin, A. A. (2014). Graphene-enhanced hybrid phase change materials for thermal management of Li-ion batteries. J. Power Sources 248, 37–43. doi:10.1016/j.jpowsour.2013.08.135
Han, D., Qiu, A., Zhu, H., Deng, Y., Chen, J., Zhao, X., et al. (2018). Orthogonal experimental design of liquid-cooling structure on the cooling effect of a liquid-cooled battery thermal management system. Appl. Therm. Eng. 132, 508–520. doi:10.1016/j.applthermaleng.2017.12.115
Jiang, G., Huang, J., Fu, Y., Cao, M., and Liu, M. (2016). Thermal optimization of composite phase change material/expanded graphite for Li-ion battery thermal management. Appl. Therm. Eng. 108, 1119–1125. doi:10.1016/j.applthermaleng.2016.07.197
Kumar, C. M. S., Singh, S., Gupta, M. K., Nimdeo, Y. M., Raushan, R., Deorankar, A. V., et al. (2023). Solar energy: a promising renewable source for meeting energy demand in Indian agriculture applications. Sustain. Energy Technol. Assessments 55, 102905. doi:10.1016/j.seta.2022.102905
Lin, C., Xu, S., Chang, G., and Liu, J. (2015). Experiment and simulation of a LiFePO4 battery pack with a passive thermal management system using composite phase change material and graphite sheets. J. Power Sources 275, 742–749. doi:10.1016/j.jpowsour.2014.11.068
Luo, J., Zou, D., Wang, Y., Wang, S., and Huang, L. (2022). Battery thermal management systems (BTMs) based on phase change material (PCM): a comprehensive review. Chem. Eng. J. 430, 132741. doi:10.1016/j.cej.2021.132741
Mohammed, A. S., Atnaw, S. M., Salau, A. O., and Eneh, J. N. (2023). Review of optimal sizing and power management strategies for fuel cell/battery/super capacitor hybrid electric vehicles. Energy Rep. 9, 2213–2228. doi:10.1016/j.egyr.2023.01.042
Mukhopadhyay, S., Fernandes, S., Shihab, M., and Waleed, D. (2018). Using small capacity fuel cells onboard drones for battery cooling: an experimental study. Appl. Sci. 8, 942. doi:10.3390/app8060942
Nazer-Nejad, M., Saffarian, M. R., and Behbahani-Nejad, M. (2018). Investigating the possibility of using the underground tunnel for air-conditioning in Tehran. J. Braz. Soc. Mech. Sci. Eng. 40, 473. doi:10.1007/s40430-018-1395-y
Park, H. (2013). A design of air flow configuration for cooling lithium ion battery in hybrid electric vehicles. J. Power Sources 239, 30–36. doi:10.1016/j.jpowsour.2013.03.102
Pordanjani, A. H., Raisi, A., and Daneh-Dezfuli, A. (2023). Slip and non-slip flows of MHD nanofluid through microchannel to cool discrete heat sources in presence and absence of viscous dissipation. J. Magnetism Magnetic Mater. 580, 170972. doi:10.1016/j.jmmm.2023.170972
Rana, M. M., Uddin, M., Sarkar, M. R., Meraj, S. T., Shafiullah, G. M., Muyeen, S. M., et al. (2023). Applications of energy storage systems in power grids with and without renewable energy integration — a comprehensive review. J. Energy Storage 68, 107811. doi:10.1016/j.est.2023.107811
Sarchami, A., Najafi, M., Imam, A., and Houshfar, E. (2022). Experimental study of thermal management system for cylindrical Li-ion battery pack based on nanofluid cooling and copper sheath. Int. J. Therm. Sci. 171, 107244. doi:10.1016/j.ijthermalsci.2021.107244
Sefidan, A. M., Sojoudi, A., and Saha, S. C. (2017). Nanofluid-based cooling of cylindrical lithium-ion battery packs employing forced air flow. Int. J. Therm. Sci. 117, 44–58. doi:10.1016/j.ijthermalsci.2017.03.006
Sun, H., and Dixon, R. (2014). Development of cooling strategy for an air cooled lithium-ion battery pack. J. Power Sources 272, 404–414. doi:10.1016/j.jpowsour.2014.08.107
Tran, L., Lopez, J., Lopez, J., Uriostegui, A., Barrera, A., and Wiggins, N. (2017). Li-ion battery cooling system integrates in nano-fluid environment. Appl. Nanosci. 7, 25–29. doi:10.1007/s13204-016-0539-6
Tran, T.-H., Harmand, S., Desmet, B., and Filangi, S. (2014). Experimental investigation on the feasibility of heat pipe cooling for HEV/EV lithium-ion battery. Appl. Therm. Eng. 63, 551–558. doi:10.1016/j.applthermaleng.2013.11.048
Wiriyasart, S., Hommalee, C., Sirikasemsuk, S., Prurapark, R., and Naphon, P. (2020). Thermal management system with nanofluids for electric vehicle battery cooling modules. Case Stud. Therm. Eng. 18, 100583. doi:10.1016/j.csite.2020.100583
Wu, W., Xiao, X., and Huang, X. (2012). The effect of battery design parameters on heat generation and utilization in a Li-ion cell. Electrochimica Acta 83, 227–240. doi:10.1016/j.electacta.2012.07.081
Xu, J., Lan, C., Qiao, Y., and Ma, Y. (2017). Prevent thermal runaway of lithium-ion batteries with minichannel cooling. Appl. Therm. Eng. 110, 883–890. doi:10.1016/j.applthermaleng.2016.08.151
Yang, X.-H., Tan, S.-C., and Liu, J. (2016). Numerical investigation of the phase change process of low melting point metal. Int. J. Heat Mass Transf. 100, 899–907. doi:10.1016/j.ijheatmasstransfer.2016.04.109
Ye, Y., Shi, Y., Cai, N., Lee, J., and He, X. (2012). Electro-thermal modeling and experimental validation for lithium ion battery. J. Power Sources 199, 227–238. doi:10.1016/j.jpowsour.2011.10.027
Zhao, G., Wang, X., Negnevitsky, M., and Zhang, H. (2021). A review of air-cooling battery thermal management systems for electric and hybrid electric vehicles. J. Power Sources 501, 230001. doi:10.1016/j.jpowsour.2021.230001
Zhou, Z., Lv, Y., Qu, J., Sun, Q., and Grachev, D. (2021). Performance evaluation of hybrid oscillating heat pipe with carbon nanotube nanofluids for electric vehicle battery cooling. Appl. Therm. Eng. 196, 117300. doi:10.1016/j.applthermaleng.2021.117300
Keywords: phase change material, battery cooling, lithium-ion battery, air-cooled system, nanofluid
Citation: Mustafa J, Alqaed S, Sajadi SM and Aybar HŞ (2024) Improving lithium battery cooling: analyzing the impact of air flow, nanofluid flow, and phase change materials. Front. Energy Res. 12:1329392. doi: 10.3389/fenrg.2024.1329392
Received: 28 October 2023; Accepted: 08 January 2024;
Published: 08 February 2024.
Edited by:
Emin Açıkkalp, Eskisehir Technical University, TürkiyeReviewed by:
Mamdouh El Haj Assad, University of Sharjah, United Arab EmiratesAnibal Alviz, Lord of Sipan University, Peru
Tolga Taner, Aksaray University, Türkiye
Copyright © 2024 Mustafa, Alqaed, Sajadi and Aybar. This is an open-access article distributed under the terms of the Creative Commons Attribution License (CC BY). The use, distribution or reproduction in other forums is permitted, provided the original author(s) and the copyright owner(s) are credited and that the original publication in this journal is cited, in accordance with accepted academic practice. No use, distribution or reproduction is permitted which does not comply with these terms.
*Correspondence: Jawed Mustafa, am1tdXN0YWZhQG51LmVkdS5zYQ==; Hikmet Ş. Aybar, aGlrbWV0LmF5YmFyQGVtdS5lZHUudHI=