 Abdul Aziz1
 Muhammad Shuaib Qureshi
- 1Department of Computer Science Shaheed Zulfikar Ali Bhutto Institute of Science and Technology (SZABIST), Islamabad, Pakistan
- 2Department of IT and Computer Science, Pak-Austria Fachhochschule: Institute of Applied Sciences and Technology, Haripur, Pakistan
- 3Department of Computer Science and Engineering, Chungnam National University, Daejeon, Republic of Korea
- 4Department of Computer Science and IT, University of Lakki Marwat, Lakki Marwat, Pakistan
The economy of a country is directly proportional to the power sector of that country. An unmanaged power sector causes instability in the country. Pakistan is also facing this phenomenon due to uncontrolled power outage and circular debt. Pakistan’s power sector is analyzed as a case study to find out the root cause for the unmanaged power sector and for proposing the most effective data-driven solution. After a literature review and discussion with domain experts, it was found that inaccurate power demand forecast is one of the main reasons for power crisis in Pakistan. Under-forecasting caused load shedding, and over-forecasting increased circular debt due to idle capacity payments. Previously, traditional statistical methods were used for power demand forecasting. The multiple linear regression model that is being used since 2018 (IGCEP) uses features such as previous year load and demographic and economic variables for long-term peak power demand forecasting till 2030. The problem is that the independent variables used in existing models are manipulated and cause a gap between actual and forecasted power demand. Moreover, even yearly peak power demand is not absolutely linear in nature; hence, it is necessary to apply AI-based techniques that can handle nonlinearity effectively. Not using system-generated data, not using the most appropriate features, not using an appropriate forecasting time horizon, and not using the appropriate forecasting model are main reasons for inaccurate peak power demand forecasting. The issue can be resolved by forecasting monthly peak power demand for the next 5 years by using the National Power Control Center’s (NPCC) system-generated data. Accurate monthly peak load forecasting leads to accurate yearly peak power demand. The monthly peak load forecasting strategy not only helps in managing operational issues of the power sector such as fuel scheduling and power plant maintenance scheduling but also guides decision-makers toward power and transmission expansion or contraction in the long term. More accurate monthly peak power demand forecasting can be achieved by applying nonlinear AI models in a comprehensive dataset comprising new engineered features, climate features, and the number of consumers. All these features are mostly system-generated and cannot be manipulated. As a result, the accuracy is improved and the results are more reliable than those of the existing models. The new features can be engineered from recent monthly peak load data generated by the system operator (NPCC). Climate features are collected from the Meteorological Department of Pakistan through sensors or database connectivity. The number of electricity consumers can be extracted from NEPRA’s state-of-industry report. All three datasets are combined on a common key (month–year) to a comprehensive dataset, which is passed through different AI models. In the experimental setup, it is found that support vector regression (SVR) produces the most accurate results, with an R-square of 99%, RMSE of 28, and MAPE of 0.1355, which are the best results compared to the literature reviewed.
1 Introduction
Since more than a decade, Pakistan has been struggling to handle electricity-related issues including chronic load shedding and circular debt, which have caused a long-lasting negative impact on the country’s economy. One of the main reasons for these issues is the absence of a reliable mechanism that could minimize the gap between the projected and actual peak power demand (Shaik et al., 2017). This is the time to use the latest artificial intelligence techniques to overcome power sector issues by creating a comprehensive dataset and selecting an effective and efficient machine learning model.
It is found that the primary function in electric grid operations, managed by the National Power Control Center (NPCC) (Ilyass, 2017; Farooq, 2018), is to maintain a balance between demand and supply, failing of which may cause load shedding and blackout in the country. Whenever load increases at the consumers’ end, it needs to be shaved off by cutting off the power supply in some areas of the country, causing load shedding. The one reason for this is the lower power generation/transmission capacity in the country. It has also been observed that although there is adequate generation capacity within the country, load-shedding still occurs due to the maintenance of power plants, the unavailability of fuel, and the decision not to operate unprofitable power plants because of rising fuel prices. In this research, the monthly peak power demand for the next 4 to 5 years has been forecasted to overcome these issues. Monthly peak power demand forecasting is not only beneficial for the power plants’ maintenance scheduling and fuel management but is also helpful in demand/supply side load management. If accurately forecasted, the areas near alternate sources of energy may be served using micro grids and reduce the load on the national grid. Moreover, if the concept of monthly peak load forecasting is replicated for day-ahead power load forecasting, then alternate sources of energy can be used to the optimum level, thus achieving lower tariff and reduction in carbon emissions.
On the other hand, when available electricity capacity is more than the demand, then, as per the “take or pay” contracts (NEPRA, 2020), additional capacity payments burden the economy. Capacity payment is one of the main reasons for the exponential hike in circular debt. The first step to overcome these problems is prediction of short-term, mid-term, and long-term power demand forecast. For this purpose, state-of-the-art data science techniques and machine learning models have remained very useful throughout the world. Efforts in the same direction are also required for Pakistan’s power sector. The power sector of Pakistan, from generation to consumption of electricity, has been visualized in Figure 1, which is very useful for understanding the flow of the power sector.
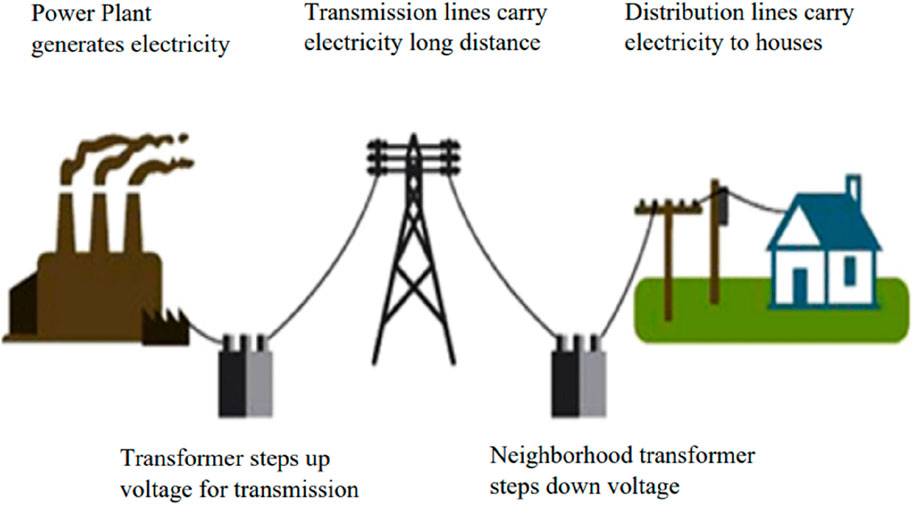
Figure 1. Overview of power flow.
Since independence, there have been two vertically integrated companies, i.e., the Water and Power Development Authority (WAPDA) and Karachi Electric Supply Company (KESC), now KELECTRIC (NTDC, 2018b). WAPDA was mandated to cover whole of Pakistan, except Karachi. Later, WAPDA was unbundled, and Pakistan Electric Power Co-Operation (PEPCO) was created in 1998, while WAPDA retained the ownership of large hydropower plants. PEPCO consists of government-owned thermal plants, i.e., generation companies (GENCOs), National Transmission & Despatch Company (NTDC), and distribution companies (DISCOs). The NTDC is responsible for establishing, running, and managing the bulk transmission line network while following the grid code provided by the National Electric Power Regulatory Authority (NEPRA). Moreover, the NTDC has been mandated to forecast long-term peak power demand.
The distribution companies, i.e., DISCOs, distribute electricity to end consumers through their own distribution network by stepping down from the high-voltage transmission lines of the NTDC. The Central Power Purchase Agency Guarantee (CPPAG) keeps track and buys electricity from generators, i.e., IPPs and GENCOs, on behalf of DISCOs. The NPCC is responsible for system grid operations and maintains a balance between electricity demand and supply (Ilyass, 2017). Therefore, the NPCC has to pre-commit electric units to maintain grid balance, failing of which causes load shedding. Imbalance in supply/demand also creates a cascaded grid shutdown process by the system, causing a blackout in the country. Power sector entities with their functionality are explained in Figure 2.

Figure 2. Overview of power flow.
As electricity cannot be stored and needs to be consumed as soon as generated, an integrated system, in a circular manner, of all entities is required for the feed-forward and feed-backward of accurate information such as power demand requirements. Figure 2 explains the connectivity among generation, transmission, and distribution to consumers. All the generation and distribution entities relate to the NPCC. The demand from DISCOs is recorded at the NPCC, and the supply is accordingly managed from generators (state-owned GENCOs/WAPDA and private IPPs) so that the balance between power demand and supply can be maintained round the clock. Prior power demand prediction helps the NPCC commit to power generation, manage fuel requirements, and plant maintenance scheduling.
The research emphasizes on using system-generated actual data at the NPCC to minimize the ambiguities in data from other sources. The central repository of system-generated load data at the NPCC is recommended to be the primary source of information to generate the secondary information for decision-making. By following the same concept, the daily peak load actual data from 2006 to 2016 are gathered from (Farooq, 2018) the NPCC system. The same is preprocessed into monthly peak load and for creation of new features. The monthly peak power demand is used to forecast for the next 4 to 5 years.
The main objective of the study is to reduce the gap between actual and forecasted peak power demand of Pakistan. The study achieved this goal by selecting the most appropriate features, selecting an appropriate forecasting time horizon, and using system-generated data. The comprehensive dataset created in this regard is the main contribution of the study. The peak power demand forecasted using the proposed framework is better than that of the IGCEP and base paper (Liu et al., 2021). The study not only forecasts peak power demand month-wise but also yearly long-term peak power demand. Monthly peak power demand helps in fuel management and power plant maintenance scheduling, while long-term forecasting helps in future generation/transmission planning. Moreover, the model presented in the study is capable of adopting new technology impacts such as electric vehicles. An alternative source of energy is highly unpredictable, and a power surge may cause imbalance in the frequency. The proposed framework can also be replicated to forecast hourly load for alternative sources to regulate the power supply in the grid.
In this study, we predicted yearly month-wise demand by implementing an appropriate machine learning model using monthly peak demand data of NPCC from 2009 to 2016 as the dependent variable. The nonlinear, nonstationary peak power demand is derived by different independent features including previous load features, economic features, and climate features. It is important to note that monthly peak power demand is a supervised learning, regression problem and highly nonlinear in nature; therefore, the supervised machine learning model that can handle nonlinearity is fitted in this study. The models are trained and tested with data from 2006 to 2016. Yearly month-wise forecasts from 2017 to 2021 have been made using the proposed machine learning model. The results produced by the proposed model are compared with the results of the IGCEP by GoP and the results of base papers (Liu et al., 2021). Different machine learning and neural network models, e.g., ANN, SVR, PC-SVR, and RF decision trees, are evaluated with performance metrics, R-square, RMSE, and MAPE.
1.1 Problem definition
The problems identified for power demand forecasting in Pakistan are as follows:
i. Inaccurate yearly long-term power demand forecasting causes under-forecasting or over-forecasting. Under-forecasting causes load shedding, while over forecasting causes circular debt due to idle capacity, which burdens the country’s economy.
ii. The existing long-term power demand prediction in Pakistan is highly correlated with economic/demographic variables, which are manipulated. The misleading assumptions for future values of independent variables cause inaccurate projection.
iii. The existing model cannot handle the nonlinearity of peak power demand.
iv. Mid-term time horizon activities like fuel scheduling and plant maintenance scheduling cannot be managed using the existing IGCEP model for long-term peak power demand.
1.2 Research questions
i. Can considering climate features with engineered historic features reduce the gap between actual and predicted load noticeably in mid-term and long-term time horizons?
ii. Can mid-term month-wise peak demand forecast be extended to long-term peak power demand for power generation expansion and transmission line expansion planning?
iii. Can fuel and power plant maintenance scheduling be chalked out using month-wise peak power demand forecasting?
iv. It is a fact that several assumptions made for future values of economic/demographic variables cause inaccurate demand forecasting. How can a number of assumptions be avoided?
v. Can feature engineering using daily/monthly peak load and climate features eliminate the role of GDP and population, which are misleading?
vi. Can the gap between power demand and supply be minimized using a nonlinear machine learning model?
vii. Generation of 1 MW power costs approximately 1.5–2 million US dollars. Can better forecasting save costs and help utilize it in other sectors such as education and health?
viii. Having a huge gap of approximately 15,000 MW between available generation capacity (around 45,000 MW) and required peak load (around 30,000 MW) places a significant burden on the country’s economy. Can it be minimized to reduce circular debt?
2 Related work
Multiple linear regression (Shaik et al., 2017) is popular since long for calculating electricity demand forecast, and the same methodology is being used in Pakistan’s IGCEP as well. Forecasting techniques are mainly divided into two categories, i.e., artificial intelligence methods and parametric methods. The artificial neural network (ANN) and recursive neural network (RNN) are examples of artificial intelligence methods that are blackbox methods that have a better accuracy; however, there is a limitation in interpretation. Parametric methods are categorized as trend analysis, end-use model, and economic model, as explained in Figure 3. In trend analysis, a trend is observed from historic data, and future values are predicted. While in the end-use model, a detailed survey about appliances used is conducted by the end users and their behavior toward utilization of electricity. In the economic model, indicative parameters of economy, e.g., GDP, per capita income, and tariff, are used.
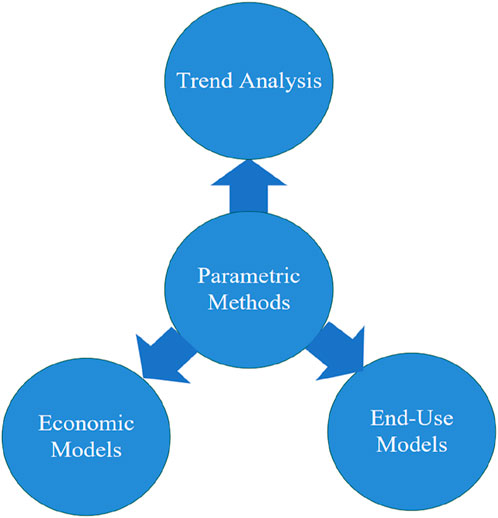
Figure 3. Parametric methods for load (MW) forecasting.
Pakistan is currently using the multiple linear regression forecasting technique, which is the economic model (NEPRA, 2021). China, being a huge economy and the largest power-generating country, must have a tested and reliable model for long-term power demand prediction, for which the gray model has been used. Some studies (Li and Zhang, 2018; Government of Pakistan, 2020) proposed an improved form of the gray model, i.e., DCOGM, which uses transformed data and interpreted GM (1,1) output. The model was used to estimate the electricity consumption in Shanghai, China, during 2017–2020. It claims a better MAPE against the machine learning approach SVR. The method needs to be compared with the ANN technique, which is mostly used nowadays. The significance of seasonal and climate factors is discussed in Aayush Goel (2014), while predicting month-wise electricity demand for Delhi. The multiple regression, logarithmic multiple regression, trend seasonality model, and ARIMA are trained. Root-mean-square error (RMSE) is used as a performance metric. It was found that the logarithmic regression model with a minimum RMSE (87.3) was the best among others.
The study on “long-term forecasting for electrical load in Kuwait” by Almazrouee et al. (2020) compared the prophet statistical model with the Holt–Winters statistical model using five performance metrics and found that the prophet model gives more accurate results than the Holt–Winter model. The study used the previous peak load data of Kuwait from 2010 to 2020 and forecasted for 2021 to 2030. The performance matrices MAPE, MAE, RMSE, and R-square were used, and an R-square of 0.99 for the prophet model as compared to 0.96 of the Holt–Winters model was obtained. A review study on the topic “A review in electricity demand forecasting in low- and middle-income countries: the demand determinants and horizons” by Mir et al. (2020) discussed Pakistan’s power sector as a reference. As per the review, the MTLF horizon uses previous load data mostly along with other determinants.
Chabouni et al. (2020) discusses the temperature and seasonality nexus on load dynamics in Algeria and concludes the importance of demand forecast for electricity demand-side management. A simple multiple regression model was applied on the weather, historic load, and calendar data. It claims an adjusted R-square of 96.9%. The study used the holy month of Ramadan as a dummy variable. Consumers’ electric appliance numbers and users’ occupied area of living were used as input variables in a study (Awan and Knight, 2020) for domestic power demand prediction of Punjab, Pakistan, using multiple linear regression. This is an example of an end-user model; however, accurate data gathering is a limitation in the study. The implementation of smart meters is a better option to obtain users’ electricity load data.
The geographical region matters as far as peak power demand forecasting is concerned. This is why the techniques and features used by similar regions like Pakistan are more important. Dhaval and Deshpande (2020) from India proposed multiple linear regression from short-term load forecasting (STLF). The weather features, previous load, day of week, and time of day were treated as independent variables. The proposed model is validated against adjusted R-square, which is 0.89. The MAPE calculated is 5.06%. However, the model needs to be compared with other machine learning models as well. In 2018, Azad et al. (al MQAe, 2018) used SVR to find the peak load of the UAE using meteorological data, including temperature and humidity. To maintain homogeneity for applying SVR, data are divided into two sets, i.e., weekend days and season-based data. The results using RMSE were compared with those of ANN, and it was found that SVR can have an equally good accuracy.
Shah et al. (2019) proposed a component-wise estimation method. The model consists of deterministic and stochastic components. Both components are predicted using different regression and time series methods, and the results are summed up. The mean absolute percentage error, mean absolute error, and root-mean-squared error are used as performance metrics. It is concluded that the vector autoregressive model combined with spline function-based regression has better performance than the rest of the regression and time-series models. The Indicative Generation Capacity Expansion Plan (IGCEP) (NTDC, 2018a; NEPRA, 2021) handles the long-term power demand forecasting using the multiple linear regression model by considering economic and demographic parameters. The software applications PLEXOS and EViews are used for power planning and statistical/regression modeling, respectively. The assumptions made for the future values of independent variables such as GDP and population may be inaccurate due to politicized figures or weak methodology.
Short-term power demand in Nepal was predicted by Bhandari SRS and Kumar Jha (2018) using the artificial neural network (ANN) model. Seven independent variables were used, viz, temperature, hour of the day, day of the week, a flag indicating if it is holidays/weekdays, previous day’s average load, load from the same hour of the previous day, and load from the same hour and same day from the previous week. The ANN was compared with traditional time-series methods. It was found that the evaluation metric MAPE is 1.17 for the ANN, and for others, it is between 1.61 and 5.07. The ANN is an up-to-date machine learning technique and gives better results compared to traditional statistical methods.
Saravanan et al. (2012) projected the electricity demand for India from 2012 to 2030 using PC-ANN (principal component-artificial neural network) and PCR (principal component regression) models of machine learning. The main contribution is the introduction of the principle component technique with the ANN and MLR (multiple linear regression). The models used 11 independent variables, including the amount of CO2 emission, population, per capita GDP, per capita gross national income, gross domestic savings, industry, consumer price index, wholesale price index, imports, exports, and per capita power consumption. The regression and ANN techniques as well as the PCR and PC-ANN models were compared using performance metrics MAPE, RMSE, and MBE. It was found the ANN is better than the RA traditionally, while the proposed PC-ANN model is better, with the least error among others being ANN, RA, and PCR (regression using principal component).
In the prediction of the electricity demand for Thailand, Kandananond (2011) compared three models ARIMA, ANN, and MLR and studied using the independent variables of population, gross domestic product, stock index, revenue from exporting industrial products, and electricity consumption. It was concluded that mean absolute percentage error (MAPE) was reduced to 0.996% by using the ANN as compared to ARIMA and MLR, for which the mean absolute percentage error is 2.80981% and 3.2604527%, respectively. However, the author recommended ARIMA and MLR due to the simple structure, interpretability, and better performance. While predicting yearly power demand for Malaysia, al MSMOe (2010) used the artificial neural network on the historical data of Malaysia. According to this study, several ANN designs are made using independent variables such as population, number of electricity consumers, and per capita electricity consumption, and with yearly electricity demand as the dependent variable. Regression coefficient R of 0.998 was calculated for evaluation. However, the model proposed (al MSMOe, 2010), i.e., ANN, needs to be compared with other machine learning models as well.
The artificial neural network (ANN) remained an emerging machine learning model used in many studies during 2020 and 2023. Neural network models are black boxes that focus on improving the accuracy than interpretation of a model. In Behm et al. (2020), the ANN has been used to predict month-wise yearly electricity demand forecasting for European countries using the data of Germany from 2005 to 2016. The evaluation metric MAE was found to be 2.8% compared to the model used by the European Network of Transmission System Operators (centos-e), which is 4.8%. It uses weather data, calendar data, and previous load data as independent variables. Antonopoulos et al. (2020) discussed different machine learning models used in studies from 2009 to 2018 for power demand response forecasting. It was concluded that different architectures of the ANN with a single hidden layer as well as deeper with multiple layers have been used in most of the work for power load and price forecasting. The capability of handling nonlinearity makes ANN architectures most attractive.
Forecasting energy demand plays a crucial role in the effective management of smart microgrids, aiding in the strategic planning of power production and facilitating energy transactions with the commercial grid. Models based on machine learning (ML) and deep learning (DL) show great potential in accurately forecasting the energy needs of consumers and predicting energy production from renewable sources (Aslam Sheraz et al., 2021). The renewable energy sources have challenges such as reliability, quality of power, and balance between demand and supply in microgrids. Hence, it is very important to forecast power generation by renewable energy sources to overcome these challenges. A survey (Renewable and Sustainable Energy Reviews, 2020) has discussed different statistical, ANN, and DNN models and found that deep neural networks like LSTM and RNN provide more accurate prediction of short-term power generation from renewable energy sources. Ali et al. (2020) used the ANN to predict the monthly peak-load demand and achieved an MAPE of 0.056. The dataset consists of temperature, humidity, and precipitation as independent variables. The study discussed that the ANN model is the most appropriate to handle the nonlinear relationship between peak load and the factors affecting it.
Khan et al. (2021) introduced a new predictive model designed to forecast short-term electricity prices using the methods of ensemble empirical mode decomposition (EEMD) and extreme learning machine (ELM).
Shehzad et al. (2023) addressed the issue of electricity theft, highlighting its detrimental effects on power grid infrastructure and the significant financial losses incurred by electric utilities. They proposed a solution in the form of a deep learning (DL)-based meta-learner model that was specifically designed to detect non-technical losses associated with electricity theft. Mughees et al. (2021) concluded that short-term electricity demand forecasting is mandatory for a successful demand response program. Therefore, this research attempted to design, implement, and test a deep bi-direction long short-term memory sequence-to-sequence (Bi-LSTM StoS) neural network model to predict day-ahead load forecast. It is also compared with MG-SVR and LMBP-ANN. MAPE and RMSE are used as performance metrics. Short-term load forecasting using recursive neural network seq-to-seq is proposed by Zhao et al. (2020) using different datasets for grid operation management. MAPE and MAE performance metrics were used in the study, and it was found that RNN-StoS performs better in short-term load forecasting using geographical and weather data.
Kazemzadeh et al. (2020) forecasted yearly peak power demand using a hybrid model by integrating support vector regression (SVR), autoregressive integrated moving average (ARIMA), and artificial neural network (ANN). First, the parameters of the SVR are optimized using particle swarm optimization (PSO). Second, a hybrid model including the ARIMA, ANN, and the proposed SVR is used to forecast yearly peak load. The hybrid forecasting model is used for yearly peak load and total energy demand for Iran National Energy Control Center. The performance of the hybrid model was measured using the MAE, RMSE, and MAPE. The MAPE for the hybrid model remained 0.99%, while for the IA model, it was 0.97%.
The data-driven models including the ANN, SVR, MLR, and GBDT were compared using socioeconomic and climate variables and forecasting monthly peak power demand (Liu et al., 2021). Performance of all models was compared using R-square, and it was found that GBDT outperforms with the highest accuracy. The study proposed GBDT for power demand prediction with R2 88%, which is almost the same as that for the SVR. However, the MAPE for GBDT is 7%, while for SVR, it is 8%. Computational time of GBDT is the best among all the other models.
Kim et al. (2019) found that despite using several techniques, the accuracy of forecasting power demand cannot be enhanced considerably. To address this issue, a hybrid model (c, l)-long short-term memory (LSTM) + convolution neural network (CNN) was proposed in this study. The model is compared with three widely used models, ARIMA, (c, l)-LSTM, and S2S LSTM, by calculating the mean absolute percentage error (MAPE) and relative root-mean-square error (RRMSE) metrics.
Kwon et al. (2020) used k-means clustering with RNN-LSTM for short-term load forecasting and achieved least root-mean-square (RMS) test error among other models including the ANN, RNN, and SVR. The K-means clustering technique is used to create seasonal clusters. Nepal et al. (2019) combined the ARIMA with k-means clustering to achieve accuracy for short-term electricity load forecasting. This approach is interpretable and simple. However, there is a question of handling nonlinearity in power demand data within the cluster. Power sector authorities required an interpretation of the model results, i.e., correlation of independent variables with dependent variables. This is why regression and ARIMA are still popular models. Other studies (Nor Hamizah Miswan RMSaSHHA, 2017; NEPRA, 2020) created hybrids of linear regression with ARIMA and ARIMA (0.1.1) for load forecasting.
The hybrid model used by Prince Waqas Khan et al. (2020) for yearly demand forecasting is a combination of extreme gradient boosting (XGBoost), categorical boosting (CatBoost), and random forest. The proposed model was evaluated against an R-squared of 0.9212, which is claimed as better than that of existing models. Another study (del Real et al., 2020) proposed a mixed architecture consisting of the convolutional neural network (CNN) coupled with the artificial neural network (ANN). Hybrid or mix-architecture is a popular modeling technique nowadays, specifically for highly nonlinear and uncertain data such as peak power demand. However, recent studies used neural network models using different architectures, like Chang et al. (2011) used a weighted evolved fuzzy neural network model for monthly electricity demand forecasting. Similarly, He (2017) and SHaP (2017) used CNN-RNN and DNN-staked autoencoder models for load forecasting.
The most recent studies of 2023, such as Kumar and Pal (2023), forecasted power load of the short-term time horizon using Gaussian process regression (GPR) on historic data. The author agreed that SVM is the best machine learning model for power demand prediction. There is very little difference in the RMSE value between GPR and SVM regressor. Similarly, Abumohsen et al. (2023) used LSTM, GRU, and RNN for short-term power forecasting. This shows that even current studies are focusing on the short-term and mid-term time horizon for power demand forecasting using nonlinear machine learning models.
2.1 Critical evaluation
Critical evaluation Table 1 represents a complete picture of the related work reviewed. As forecasting peak power demand is a supervised learning regression problem, the regression learning models are more effective and efficient for peak power demand prediction. While reviewing the literature critically, it is observed that the models that can handle nonlinearity are more effective and have higher accuracy. It is also observed that accuracy increases for shorter and mid-term time horizons than long-term ones. The reason behind this is that the projected power demand curve better aligns its direction due to shorter and mid-term time horizon data. The second set of important features is climate features for short and mid-term horizons. While economic features have more impact while forecasting long-term peak power demand, the results are not encouraging due to manipulation of economic features. As power demand data are highly nonlinear and uncertain, statistical and multiple linear regression models are not appropriate for short- and mid-term time horizon forecasting. However, for long-term forecasting, statistical and multiple linear regressions are still popular while compromising the accuracy. Statistical and multiple linear regression models are more interpretable, which is also one of the main requirements of decision makers. However, due to the availability of high storage, high processing power, and ubiquitous data, it is recommended to forecast for short- and mid-term time horizons for better accuracy. The results of short- and mid-term horizons also lead yearly long-term peak power demand forecast. Neural network models are mostly used for short-term forecasting, but it is a black hole, and the results cannot be interpreted easily. Therefore, for Pakistan, mid-term time horizon forecasting is more appropriate, and the SVR model is a better option for Pakistan as it is not only interpretable but also has improved accuracy and reliability.
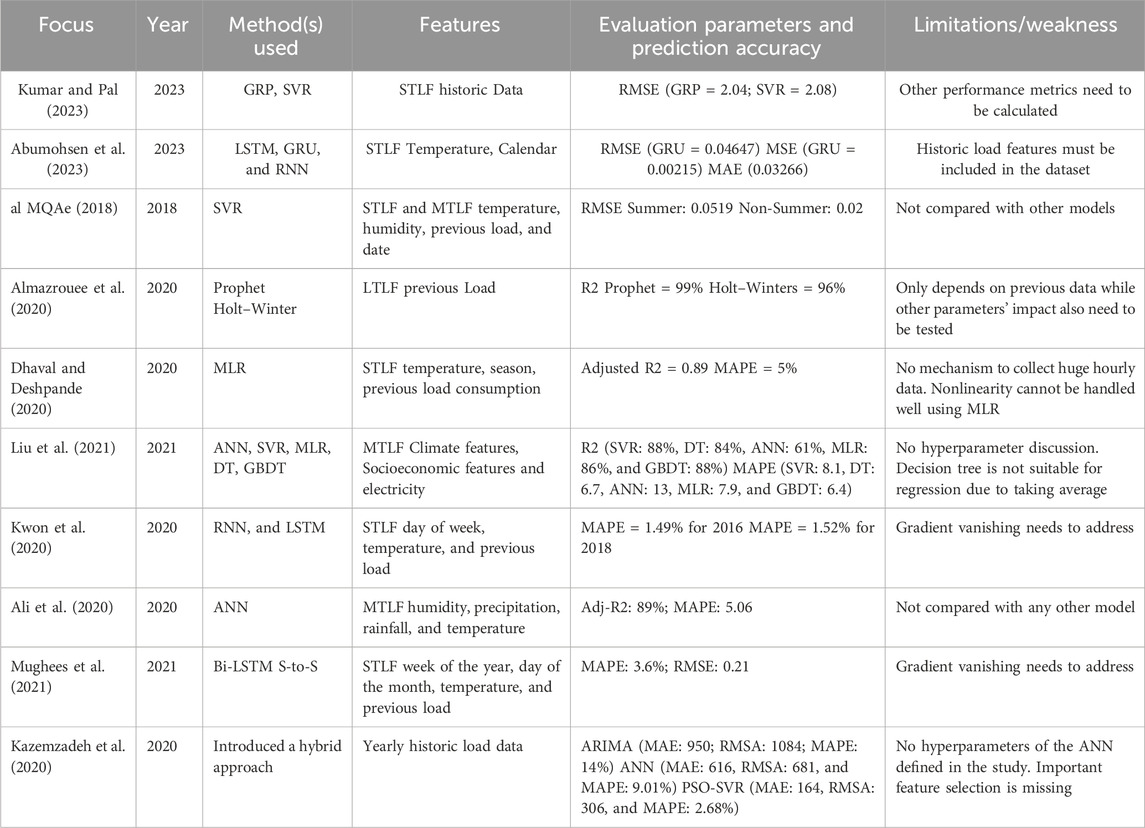
Table 1. Critical evaluation.
3 Materials and methods
Pakistan is facing electricity load shedding and circular debt issues. Due to this, the economy of the country cannot flourish. While investigating these issues, it was found that the above issues are mainly due to power demand and supply gap, mismanagement of fuel arrangements, and non-availability of power plants due to maintenance. Domain experts agree that these issues can be resolved by predicting accurate peak power demand on mid- and long-term time horizons. The methodology explained in Figure 4 is proposed.
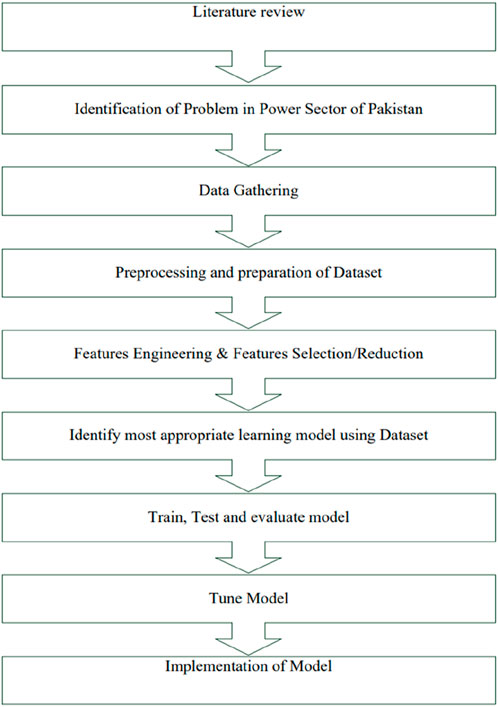
Figure 4. Research methodology.
First, state-of-the-art literature on predictions of peak power demand was explored. It was found that different statistical and machine learning models are being used by authors. The datasets with different socio/economic/climate/demographic features are used to train the models. The selection of features and models depend on the forecasting time horizon and region. Short-term and mid-term horizons use climate and historic features mostly, while the impact of economic features is lesser. However, for a long-term horizon, economic features have more impact on the peak power demand curve than others. In long-term projection, a lot of assumptions must be made for future values of economic/demographic features, which decreases the accuracy of the model. In this research, the projection of peak power demand for a mid-term horizon, which is extendable to long-term projection, is proposed.
After the identification of problems and deciding the forecasting time horizon, the next step is gathering of data. It is proposed that daily peak load data generated by the NPCC are used to filter out monthly peak power demand as a dependent variable. Climate data are gathered from the Meteorological Department of Pakistan, while economic feature data are collected from the Bureau of Statistics of Pakistan. The final dataset is prepared by merging the climate/calendar dataset and the economic dataset along with NPCC’s monthly peak load data. Feature engineering is done in the preprocessing phase to create new features using daily/monthly peak load data generated by the NPCC’s system. The most relevant features are selected using different features selection and data science techniques.
The final dataset with the most relevant features is split into training and test datasets. Different machine learning models are trained using the training dataset. The models are tested using performance metrics like R-square, RMSE, and MAPE using the test dataset. The models are tuned for optimum hyperparameters that give maximum accuracy. After tuning the hyperparameters and getting the best-fit model, cross-validation techniques are applied to check the consistency of the models for unseen data. The research methodology is explained in Figure 4.
3.1 Proposed framework
Raw data are gathered from the concerned entities like the Bureau of Statistics for economic parameters, system-generated daily peak power demand data from the NPCC, and climate data from the Meteorological Department of Pakistan. These datasets have the common key “month–year.” After preprocessing and feature engineering, the datasets are merged using the common key, and the combined dataset is prepared with all potential features given in Table 2. Different feature selection/reduction techniques are applied to filter the most appropriate features. The proposed machine learning model is applied on the final dataset with the best features to forecast peak power demand. The framework of the model is given in Figure 5.
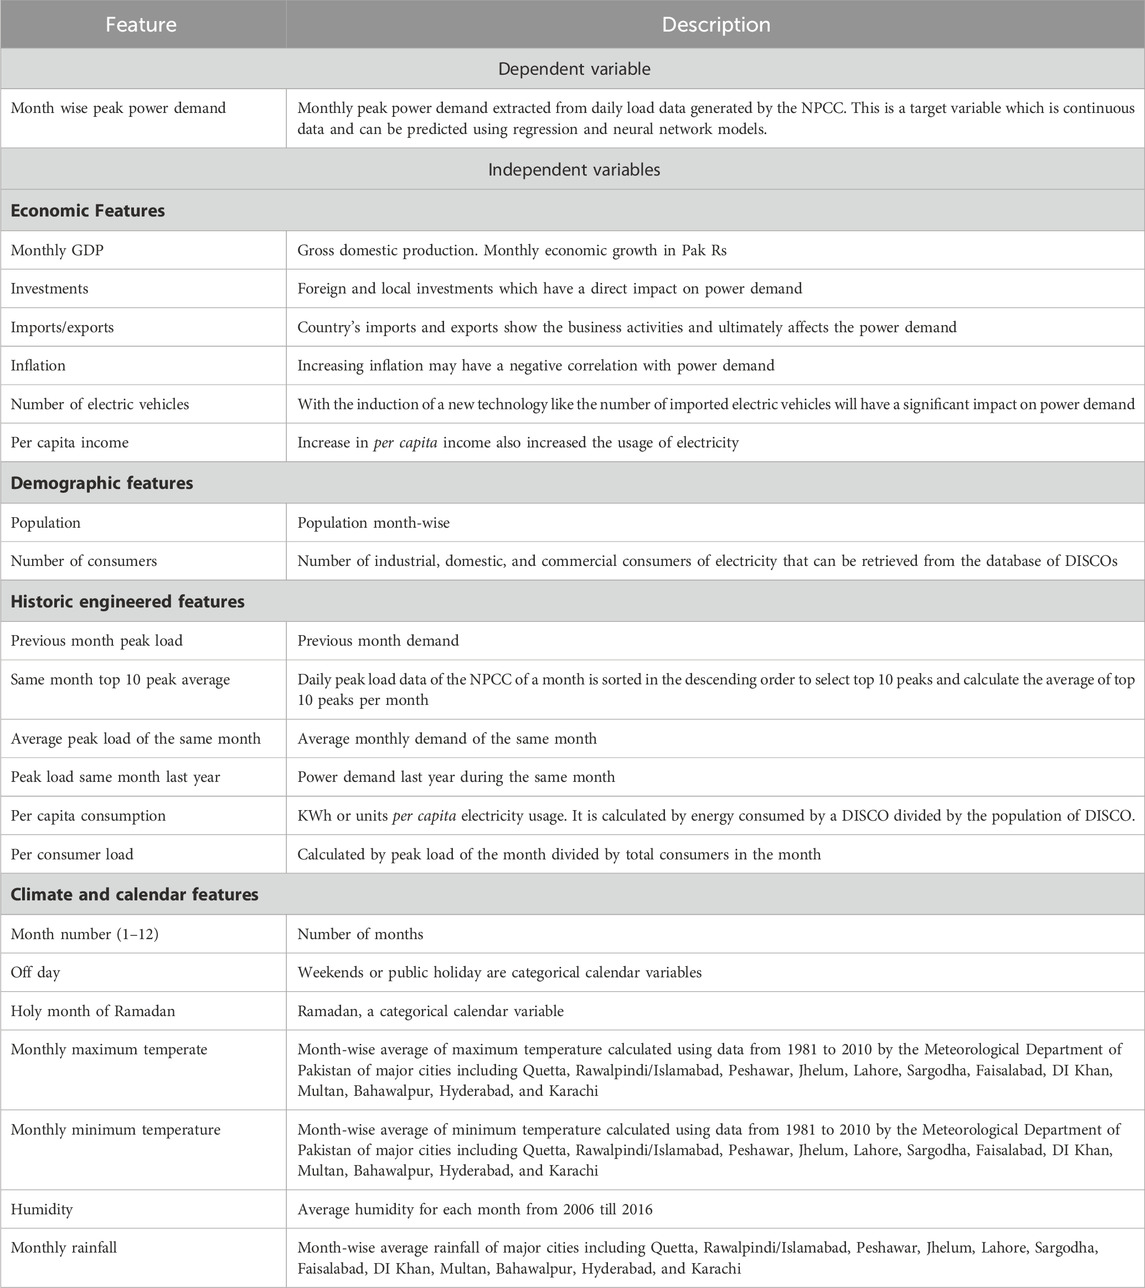
Table 2. Important features and target variable.
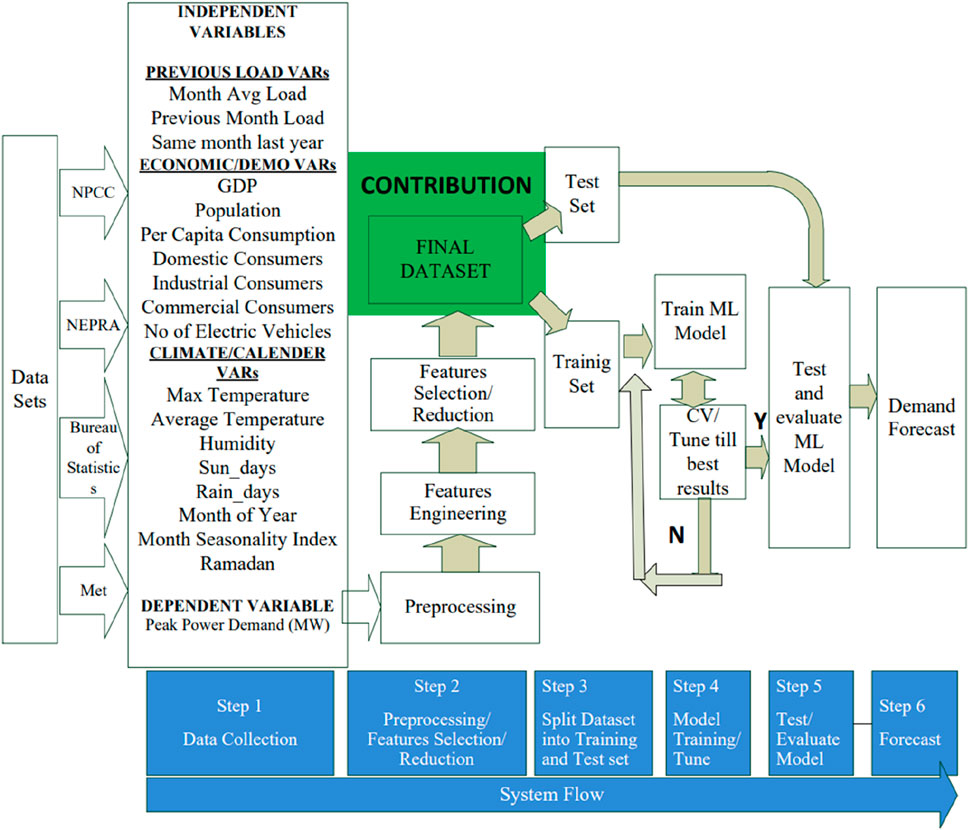
Figure 5. Framework of the model.
3.1.1 Mathematical representation of the proposed model
Support vector regression (SVR) is proposed for monthly peak power demand forecasting. With the use of the kernel, the SVR provides an efficient way to handle nonlinear regression problems by projecting the original features into the kernel space where data can be linearly separated, as explained in Figure 6.
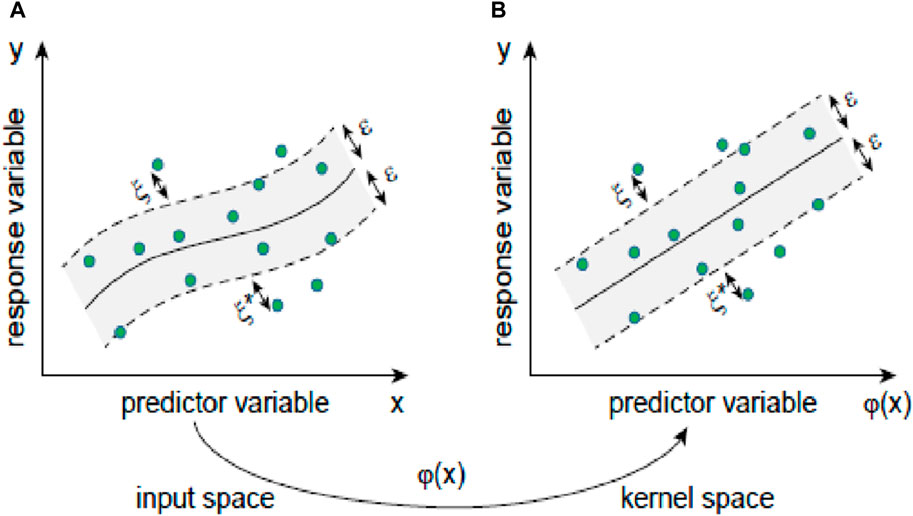
Figure 6. Graphical representation of SVR.
SVR introduces an ε-insensitive loss function to compute a hyperplane such that the predicted values of the training data have at most an ε deviation from actual values. To allow SVR to handle nonlinear data, a polynomial kernel function is applied in this thesis that transforms original input data to a higher-dimensional kernel space, where input data Rd are transformed into a kernel space F, as represented by Equation 1.
The linear function can be represented as in Equation 2.
The optimization function of Y is given in Equation 3, subject to the conditions given in Equation 4.
subject to
where ξ,ξ∗ are the slack variables to guard against outliers; C > 0 is the regularization parameter, which is set to 500; and ε is 35 in this paper, while “poly” is used as the kernel function.
3.1.2 Dependent, independent, and historical variables
The potential variables that take part in feature selection are explained in Table 2. By applying the different feature selection techniques, the most appropriate features are selected for monthly to yearly peak power demand forecasting. Different nonlinear machine learning models are fitted and tuned on the final dataset. The best fit model with the best accuracy is proposed for Pakistan’s power sector.
3.1.3 Experimental setup
In a production environment, the NPCC is the centralized storage location for the final dataset. At the NPCC, the daily peak load dataset, climate dataset, and economic dataset are gathered via database connectivity with the respective department through the internet or through sensors. However, in the experimental setup, NPCC’s daily peak load data from 2006 to 2016 are extracted from reports (NTDC, 2011; NTDC, 2017), while climate and economic data are gathered from the Bureau of Statistics report of Pakistan Statistical Yearbook 2022 (PBS, 2022). The daily peak load dataset is preprocessed to create the monthly peak load dataset, which is combined with economic and climate datasets using the common key, i.e., month–year. Monthly peak power demand is the target variable in the final dataset, while economic, historic load, and climate features are the predictors.
As far as hardware and software used in the experimental setup are concerned, the whole methodology is implemented on a laptop system with specifications, i.e., Processor Intel® Core™ i5 8250U CPU @ 1.60 GHz 1.80 GHz, 16.0 GB RAM, 512 GB SSD, and the Windows 10 Pro as the operating system. Python programing language and Jupiter Notebook V3.0 IDE are utilized for data preprocessing and visualization. Jupiter Notebook is an open-source IDE that can execute the python code, visualize data, and fit the statistical model under one umbrella. Python is also an open-source programming language that supports multiple data sources and performs statistical/mathematical calculations in an effective and efficient manner.
3.1.4 Data validation
The data used in this study are collected from authentic sources, and most of the data are system-generated, with the least chance of missing or invalid data. The daily peak load data collected from the NPCC system, while climate data are sensor-generated data from the Meteorological Department of Pakistan. The data extracted from NEPRA’s PDF reports are converted into Excel format using Adobe Acrobat Professional. The following steps have been applied to ensure data validation.
i. Data types and format of features have been ensured by assigning appropriate data type of features, which prevent invalid entries of data. For example, the month–year key in the dataset is of date type to avoid invalid dates.
ii. Uniqueness of the primary key, i.e., “month–year,” has been checked using Python.
iii. While joining datasets on the common key, it was ensured that there are no duplicate entries, and the joining operation created the correct number of records.
iv. The range of different features is checked using visualization and sorting in Python and Excel.
v. Different queries are performed in Python on datasets to ensure validation. For example, the peak load in the month of July from 2006 to 2016 is extracted to ensure consistency of data.
vi. Alternatively, datasets are also converted in Excel format and validated through the filter operation available in Excel.
3.1.5 Data preprocessing
The three datasets, i.e., daily peak load dataset, climate dataset, and economic dataset, are loaded into the respective data frames using Jupiter Notebook. The following main data preprocessing actions are performed on these datasets:
• The missing values and outliers were filtered out. The missing values are filled by the mean value of the column, and mismatched outliers were corrected from the source data otherwise removed from datasets.
• As the target variable is month-wise peak power load, the daily peak demand data are pre-processed into month-wise peak demand data. When plotted, it indicates that it is a nonlinear curve. Figure 7 and Figure 8 describe the behavior of monthly peak power demand from 2006 to 2013.
• The economic parameters including GDP, population, and the number of domestic, industrial, agriculture, and bulk user data are on yearly basis, which need to be preprocessed and converted into monthly basis. For this purpose, the monthly growth rate of each parameter is calculated using the following formula.
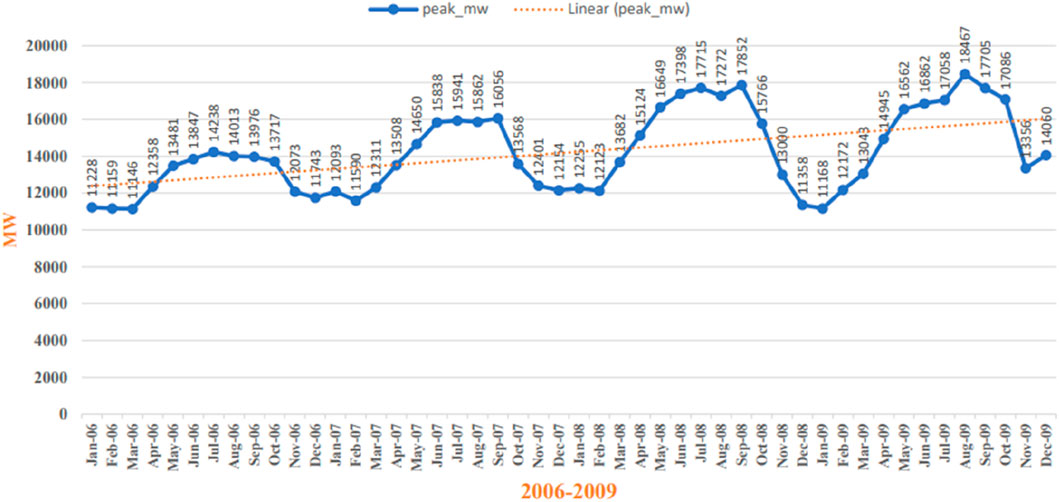
Figure 7. Month-wise peak power demand for 2006–2009.
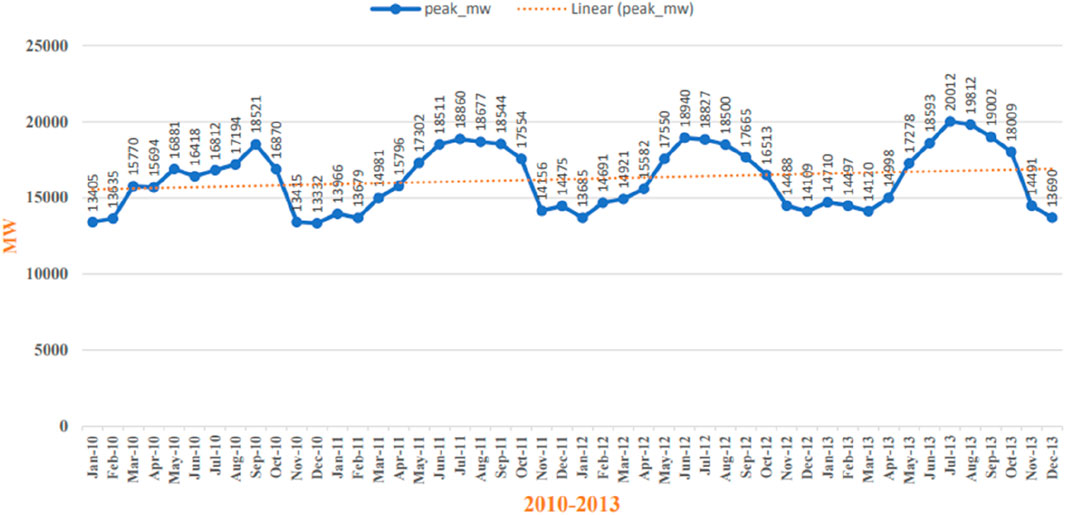
Figure 8. Month-wise peak power demand for 2010–2013.
Let “r” be the monthly compound growth rate of GDP. For the year 2006–2007, the GDPe (beginning GDP, which is the GDP at the end of 2006) and GDPe (end GDP, which is the GDP at the end of 2007). Equations 5–7 are used to calculate the monthly growth rate “r”.
Here, GDPe is the ending GDP of the financial year, and GDPb is the base or starting GDP of the financial year. Here, r is the monthly growth rate of GDP to find out. Hence, yearly GDP from 2006 to 2007 has been interpolated using the compound growth rate “r” into monthly GDP from 2006 to 2007. Similarly, other yearly economic variables have been preprocessed into month-wise economic parameters. Moreover, null values and duplicate values are also identified and filled with either mean values or with consultation of the domain expert. The values’ range is also checked, and outliers are rectified or removed from data. As mostly data of the selected features are system-generated, the health of data is satisfactory and unbiased. No missing month–year peak load and climate data are found in the datasets. Other than using Python tools for data preprocessing, Microsoft Excel Spreadsheet is also used for visualizing the representation of data along with using filters, as shown in Figures 7 and 8.
3.1.6 Feature engineering
It is in consensus that historic features have a noticeable impact on better prediction, specifically for continuous time-series target variables such as short- and mid-term power load forecasting. These features need to be engineered from historic data of daily peak power demand generated by the system control operator NPCC. The engineered features include “monthly average peak demand,” “monthly top 10 peaks average,” “last month peak demand,” and “last year peak demand of the same month.”
3.1.7 Feature selection
After combining three datasets into a single dataset, 73 features are obtained. It is proven that increasing the number of features causes overfitting in machine learning models, and thus, reliable accuracy cannot be achieved. Therefore, it is important to check collinearity and select the features that have the most impact on dependent variables. In this regard, Pearson’s collinearity matrix and feature selection/importance techniques are used.
Pearson’s correlation analysis is a quick technique for feature selection. It gives the correlation of independent variables with the target variable, and inter-variable dependency is also explained. During feature selection, Pearson’s correlation matrix based on the final dataset is created, and the results are visualized using a heat map plot. The heat map shows how much the features are related to each other. Correlation can be defined as the impact of one feature by changing another feature. The correlation value is between −1 and 1. The features which are near −1 are highly negatively correlated, and features near +1 are highly positively correlated. Features with a value near 0 have no or little correlation. The heat map helps us select the variables that are highly correlated with dependent variables. In a positive correlation, the increase in the value of one column also increases the value of the other column, and in case of a negative correlation, the increase in the value of one column causes a decrease in the other. The presence of a correlation among independent variables can negatively affect the performance of the model in terms of generalizability. It is used to remove redundant information from datasets.
Feature selection is an important step of data preprocessing. It not only reduces overfitting but also improves accuracy and minimizes computation time. Select K-best class is a popular feature selection technique that assigns higher scores to relevant features and removes others. K-best is a univariant method in which statistical methods (F-statistics and p-values in case of regression) are applied to the independent variables against the target variable one by one, and they are ranked according to the score. It is applied on the merged dataset to extract K-best-scoring features by using the f-regression scoring function. Out of 73 features in the merged dataset, 43 best features have been plotted in Figure 9.
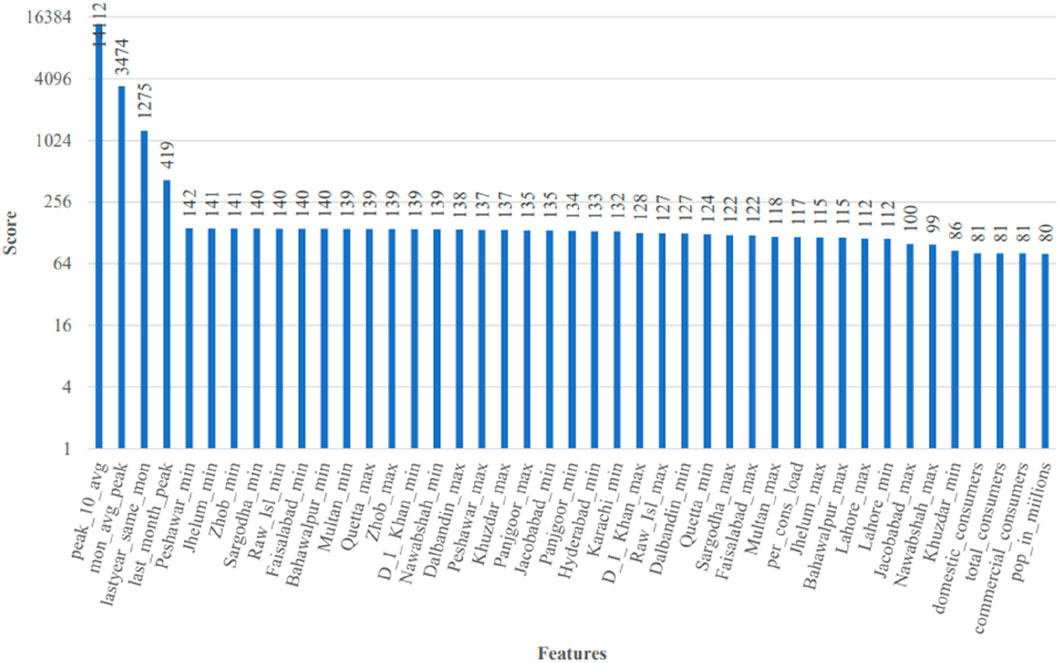
Figure 9. Best 43 features using the f-regressor score.
Decision tree regressors not only solve the nonlinear problems but also provide the features’ importance to select the most appropriate features. In this regard, ensemble decision methods provide better results. To find out the important features from our final dataset, the first ensemble technique used for feature importance is extra tree regressor, which emphasizes on low variance. The top 24 features out of 73 are given and plotted in Figure 10.
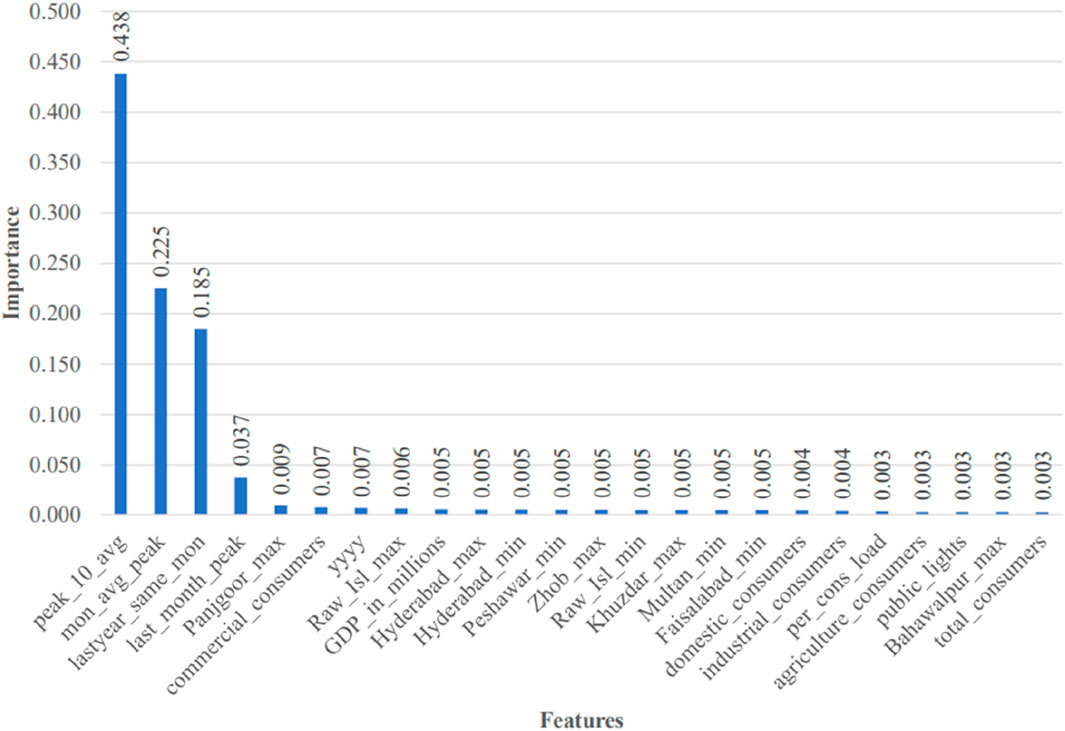
Figure 10. Feature importance using the extra tree regressor.
Pearson’s correlation, K-best feature selection, and extra tree regressor are applied on the merged dataset with 73 features including historic load features, climate feature, and economic features. Engineered historic load features are the most relevant, followed by climate and economic features for mid-term peak power demand forecasting. The target variable, i.e., monthly peak load, is a continuous variable that is extracted from daily peak load system data of the NPCC. This system generates raw data used to engineer features and is continuously fed into the system to update the values of the engineered features dynamically. In this study, feature engineering is applied on historic data from 2006 to 2016. The climate features, i.e., maximum temperature, minimum temperature, and rainfall of all major cities, are highly correlated with each other. Therefore, to minimize the number of features to avoid overfitting, only the maximum temperature is selected. As per domain knowledge, maximum temperatures of the cities including Quetta, Rawalpindi/Islamabad, Peshawar, Jhelum, Lahore, Sargodha, Faisalabad, DI Khan, Multan, Bahawalpur, Hyderabad, and Karachi are important due to higher industrial/commercial activities along with a higher number of consumers, and same are retained in the final dataset. As far as economic features are concerned, total consumers and load per consumer are important features as compared to other economic features such as GDP per month, per capita energy consumption, and per consumer energy consumption. Selecting the most appropriate features is a mandatory step while implementing the machine learning model. Manual feature selection is also done by addition/replacing other features in the final dataset of 18 features, and the accuracy is measured. It is found that the selected 18 features give the minimum error on all machine learning models. The heat map of the selected features is given in Figure 11. Although multi-collinearity exists among features, it has no effect on nonlinear models such as SVR and ANN. This is why the multiple linear regression model is not recommended for mid-term peak power demand forecasting.
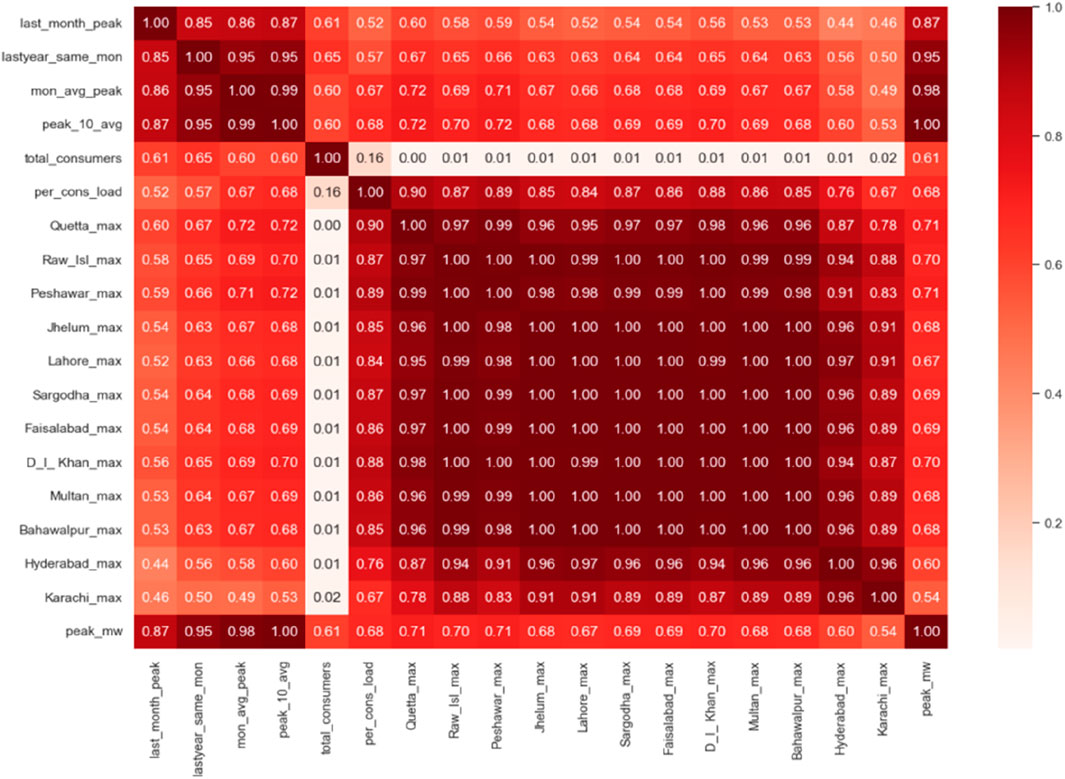
Figure 11. Heat map of selected features.
4 Framework implementation
4.1 Data source connectivity
The entities that are mandated to manage economic, climate, and power data need to connect using sensors or database connectivity. In the proposed architecture, the connectivity of the NPCC for daily peak load data, Meteorological Department for temperature data, and Bureau of Statistics/DISCOs for economic data is suggested. All raw data are compiled at the central data science center at the NPCC, where the proposed model is implemented. Raw data gathered are preprocessed and input to best fit the machine learning model for forecasting. The forecasting results will be transmitted and accessible to all stakeholders in real-time for decision-making.
4.2 Model implementation
After the physical connectivity of data sources, the data sets including daily peak load, climate feature data, and economic feature data are gathered at the central data center, where cleansing, preprocessing, and merger into a single dataset take place. After selecting the most effective features, a set of learning models are trained on the final dataset. Peak power demand is a regression and non-linear problem; therefore, regressors that can handle nonlinearity are implemented for peak power load forecasting. The following machine learning regressors are implemented:
• Support vector regression.
• MLP—artificial neural network.
• PCA-ANN.
• Random forest decision tree.
4.3 Validation and tuning
The final dataset is split into training and test datasets in a 80:20 ratio. The models are trained using the training dataset, and the models are evaluated using the test dataset. Hyperparameters are tuned using grid search cross-validation by giving the range of hyperparameter values. The models are re-run with tuned hyperparameters to get the best train and test performance metrics. Cross-validation is also performed on the best fit model to ensure the consistent performance of the model.
R-squared metric shows how close the predicted regression line or curve is to the actual data points. The higher the R-square means, the better fitted curve and better accuracy. Equation 8 shows the R-square is
Here,
R2 = R-square, which is between 0 and 1. The closer to 1 it is, the higher the accuracy.
RSS = residual sum of square.
T = total sum of square.
Root-mean-square error indicates the average deviation of the actual and predicted value. The lower the value of the RMSE is, the better the accuracy of the model. Equation 9 calculates the RMSE, which is as follows:
Here,
RMSE = root-mean-square error.
Yp = predicted value.
Ya = actual value.
T = total number of data points.
Hyperparameters of models are tuned using the grid search mechanism to improve the accuracy of the models. To get consistent results, the K-fold cross-validation technique is applied to find mean RMSE and standard deviation.
The percentage of deviation between the actual and forecasted values is calculated by the MAPE. The lower the value of the MAPE is, the better the accuracy of the model. Equation 10 calculates the MAPE, which is as follows:
Here,
Actual = actual peak load of the month.
Forecasted = forecasted peak load of the same month.
Absolute of the difference between the actual and forecasted values is taken to remove the negative.
4.4 Experimental results
In the literature review, it was observed that different models and features were used to predict power demand for different time horizons. For example, short- and mid-term power demand prediction uses climate/calendar features along with previous load features, while for the long term, the research emphasis is mostly on economic parameters. Moreover, deep learning models are used for short- and mid-term peak power demand forecasting that can handle nonlinearity, while long-term demand forecasting uses traditional regression models. In this study, we are predicting peak power demand for the mid-term time horizon for the next 3 to 5 years.
Liu et al. (2021) have done almost similar kind of work and proposed GBDT as the best model. The results of the proposed model in this study are also compared with results of Liu et al. (2021). In this study, the nonlinear regressors including SVR, MLP-ANN, PCA-ANN, and random forest decision tree are implemented.
The support vector regressor was trained and tested with initial hyperparameters. To optimize the results, hyperparameters are tuned using the grid search cross-validation technique. Tuned hyperparameters of the SVR are C = 500, coef0 = 300, epsilon = 25, kernel = poly, and degree = 3. The multi-layer perceptron (MLP) flavor of the artificial neural network is trained and tuned. The tuned hyperparameters using the grid search technique are learning rate = 0.001, epochs = 600, batch size = 50, hidden layers = 23, and neurons = 20, while Relu/Leaky Relu is used as the activation function and Adam as the optimizer. The linear activation function is used in the output layer. The feature reduction technique, i.e., principal component analysis, is applied on 18 selected features, and a new dataset of 10 principal components is created, which explain most of variance in data. The dataset with 10 principal components is used to train the artificial neural network. The best hyperparameters after tuning are learning rate = 0.001, epochs = 700, batch size = 50, hidden layers = 23, and neurons = 30, while Relu/Leaky Relu is used as the activation function and Adam is used as the optimizer. Linear activation function is used in the output layer. Random forest decision tree regressor is a nonlinear regressor that creates a forest of trees, and the final continuous value is calculated by taking the mean of the result by each tree’s leaves. The hyperparameters including the number of estimators, maximum depth of tree, and minimum sample leaf are tuned using the grid search cross-validation tuning technique. The best hyperparameters are {“max_depth”: 6, “min_samples_leaf”: 5, and “n_estimators”: 200}.
4.5 Model comparison and selection of the model
The performance metrics R-square, RMSE, and MAPE are used to evaluate and compare the models. After practically implementing in the experimental setup, it is clear that SVR performs the best, and the same is proposed for monthly peak power demand forecasting. The comparison of the results of all models trained and tested with the base paper (Liu et al., 2021) and IGCEP model of the government of Pakistan is given in Table 3.
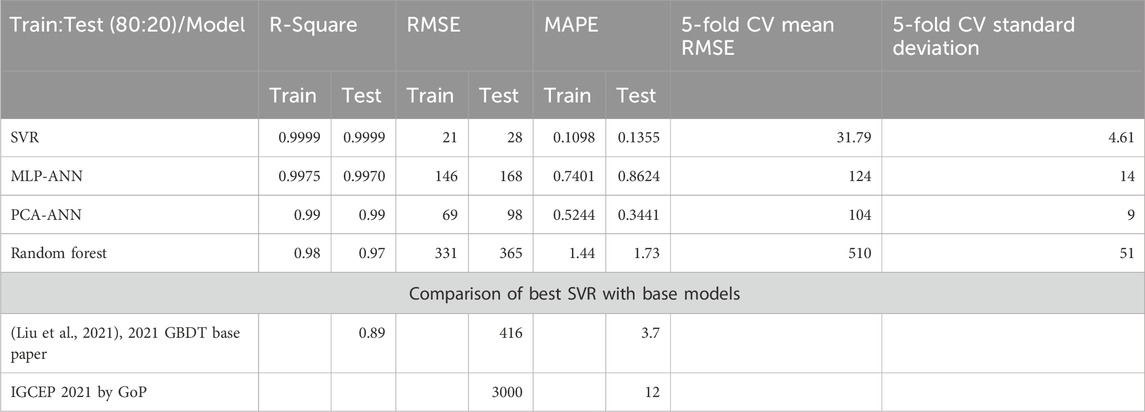
Table 3. Model results.
5 Discussion
After selecting the most appropriate features, a set of learning models is trained on the selected dataset. As peak power demand is a regression and nonlinear problem, regression models that can handle nonlinearity are implemented for peak power load forecasting. The following machine learning regressors are implemented:
• Support vector regression.
• Artificial neural network—MLP.
• PCA-ANN.
• Random forest decision tree.
Visual representation of performance metrics R-square, RMSE, and MAPE is given in Figure 12 and Figure 13.
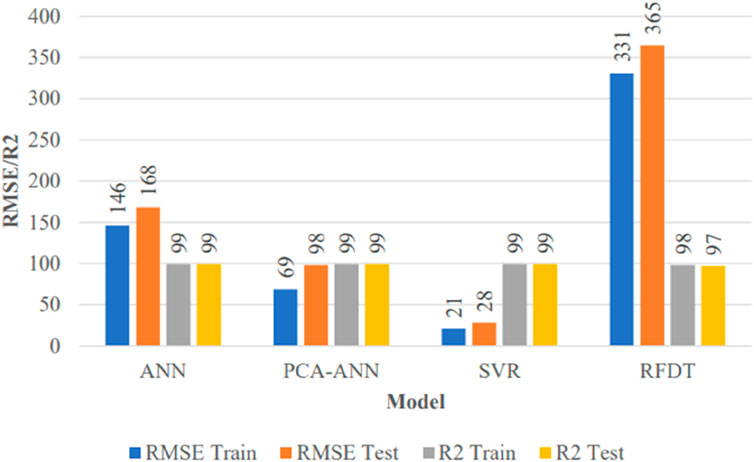
Figure 12. Performance matrices (RMSE and R2).
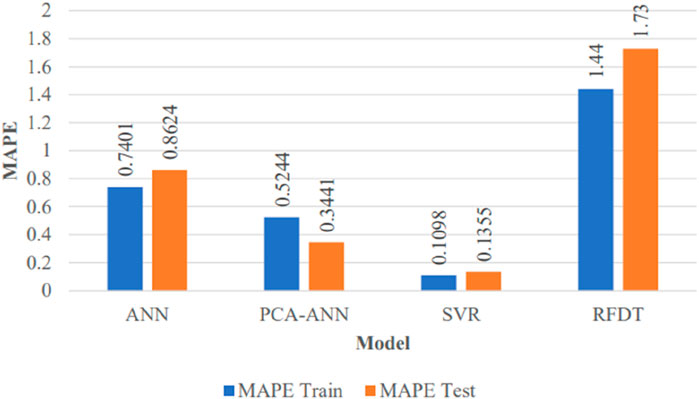
Figure 13. Performance matric (MAPE).
As monthly peak power demand data are uncertain and highly nonlinear, the support vector regressor and ANN models give the best results. As far as the decision tree regressor is concerned, it does not calculate the new continuous value and takes the mean of the regressor trees’ output, which remain within the available domain of peak power demand. Moreover, decision trees are highly sensitive to small changes in data, so they are highly unpredictable. Finally, the results of SVR and PCA-ANN are very close; however, SVR is being proposed for monthly peak power demand forecasting for giving the best CV-RMSE with minimum standard deviation. The results of PCA-ANN are better than those of MLP-ANN because feature reduction using PCA results in non-linear independent components and reduces overfitting and improves accuracy.
In the experimental setup, the SVR model is fitted using tuned hyperparameters on the final dataset of 2006 to 2016. The monthly peak load on the unseen data from 2017 to 2022 is forecasted using the best-fit tuned SVR model. As actual daily peak load data of the NPCC from 2017 to 2021 are not available, actual monthly peak demands are gathered from NEPRA’s State of Industry Report 2022 (NEPRA, 2020). There is a chance of error in actual peak demands collected because they are secondary data and are not retrieved from system-generated data of the NPCC. The actual and forecasted values are given and visualized in Figure 14 and Figure 15.
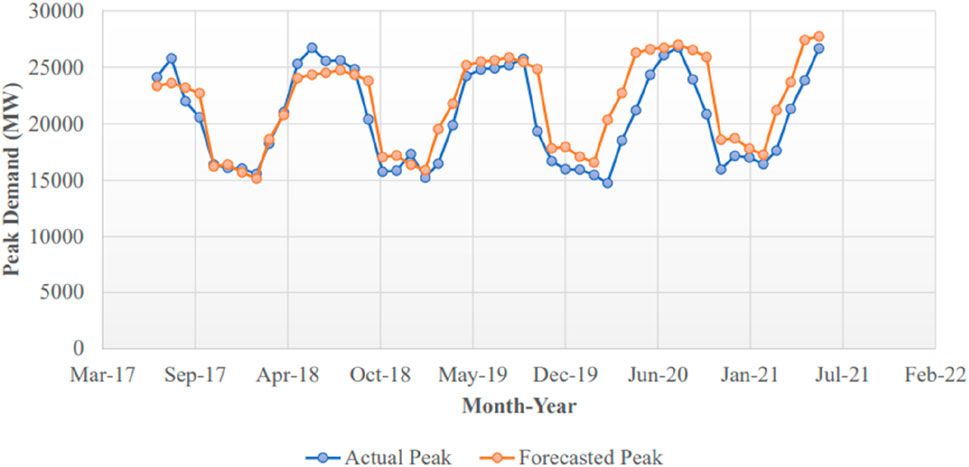
Figure 14. Forecasting peak load using SVR on unseen data from 2017 to 21.
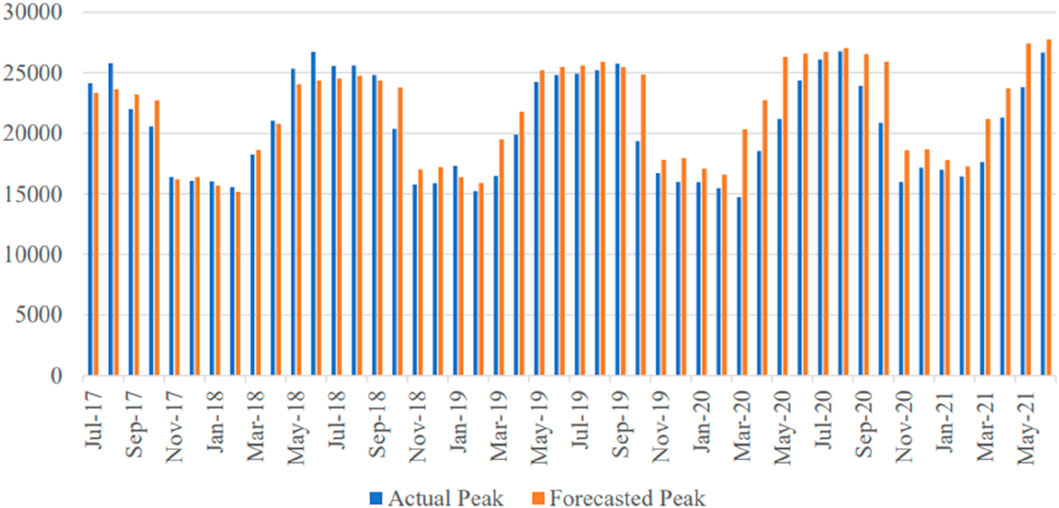
Figure 15. Forecasting peak load using SVR on unseen data from 2017 to 21.
Establishment of a new power generation plant takes 3 to 4 years. Therefore, long-term power demand forecast is required for next 5 to 10 years to continuously add power in the national grid. Keeping in view the importance of long-term forecast, yearly peak power demand is extracted from monthly peak power demand forecasted using the best-fit proposed model, i.e., SVR. This information is helpful for decision-makers for future generation/transmission expansion plans. The yearly long-term forecasted results published in NEPRA’s State of Industry Reports and Indicative Capacity Expansion Plan 2021 (IGCEP 2021) by the Government of Pakistan have been compared with forecasted values of the selected model, SVR, in the study. The comparison of forecasted yearly peak power demand on seen data from 2006 to 2016 as well as on unseen data from 2017 to 2030 is given in Table 4 and plotted in Figure 16.
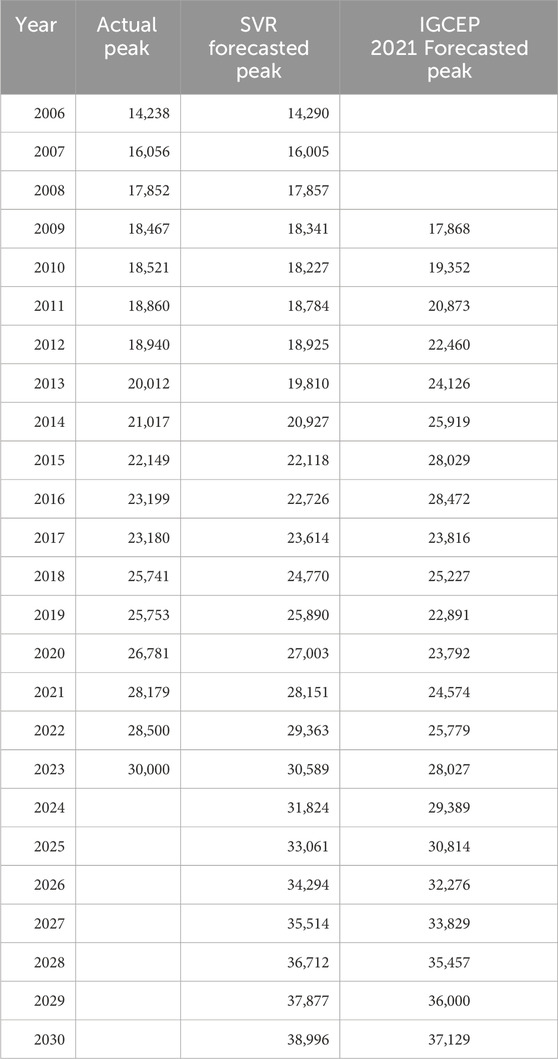
Table 4. Long-term peak load forecasting from 2017 to 2023.
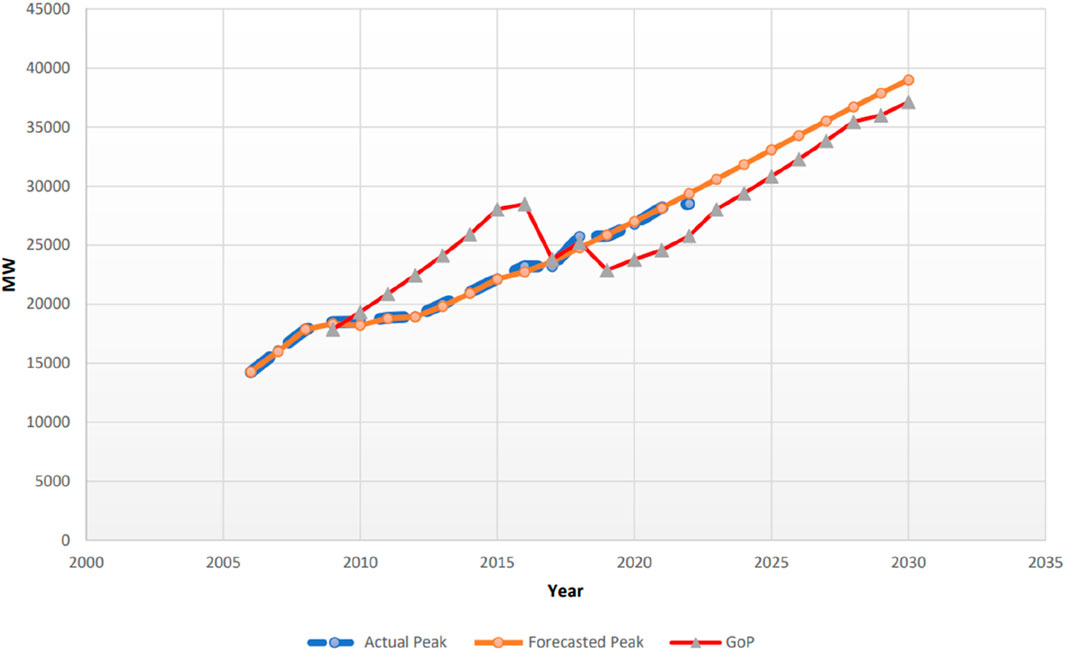
Figure 16. Long-term peak load forecasting using SVR on unseen data from 2017 to 2030.
6 Conclusion
The economic growth of any country depends on efficient power sectors. In this regard, the first step is forecasting of accurate and realistic power demand in all time horizons. In this paper, Pakistan’s monthly peak power demand is forecasted by gathering peak demand data as a target variable gathered from the NPCC system. After that, a dataset containing the highly correlated and rich features with power demand is prepared using feature engineering and feature selection techniques. The machine learning models are fitted on the final dataset.
Most of the work for forecasting peak power demand is on a long-term time horizon, i.e., yearly peak demand in the next 5–10 years. These models mostly depend on economic variables like GDP and per capita income. The problem is that the actual proportionate impact of economic variables is not translated into forecasted power demand and, hence, creates gaps. Moreover, it only focuses on future generation and transmission expansion, while it has been observed that fuel management, plant maintenance scheduling, and merit order dispatch are equally important. To get both benefits, month-wise peak power demand forecasting is proposed in this study.
The main reason for power crisis in Pakistan is either over-generation or under-generation of power capacity. This happens due to over-forecasting or under-forecasting of peak power demand. It is obvious that long-term over-forecasting creates more power capacity, and the government has to pay capacity payment even if the plants are idle, as per international contracts. This capacity payment adds up to circular debt, which reached approximately 3 trillion. Currently, Pakistan is in the over-generation state due to over-forecasting in the past. Moreover, due to over-generation, significant investment and efforts are put in the power sector while ignoring other sectors such as health and education. To enhance generation capacity of 1 MW requires the investment of 1.5 million USD to 2 million USD, and currently, there is approximately 15,000 MW of over-generation capacity in Pakistan. Similarly, under-forecasting slows down the new generation process and, at one point of time, a state of under-generation occurs, and the country faces load shedding. So this is high time to utilize the power of data science. Finalizing a comprehensive dataset, a best forecasting time horizon, and applying a machine learning model is the need of the time for a consistent power demand forecasting mechanism. This study is the first step toward this direction.
As per the conceptual design given in the study, daily peak load data generated by the NPCC system are continuously fed into the proposed design, and forecasted results are dynamically updated in real time. The other factors that impact power demand are climate and economic factors. Data of climate features and economic features are collected from the Meteorological Department and Bureau of Statistics, respectively. The three datasets, i.e., peak load data, climate data, and economic data, are merged into a single dataset. Feature engineering is applied to create more features from historic load data of the NPCC. Highly correlated features with peak power demand are selected using feature selection techniques. Peak power demand is continuous, highly uncertain, and nonlinear. Therefore, the machine learning regressors that can handle nonlinearity are fitted on the final dataset in the experimental setup. SVR with the best performance metrics is selected for monthly/yearly power demand forecast.
While aligning the research questions with results, it is clear that the final dataset with mostly climate and engineered historic features has better accuracy. Extending month-wise forecasting to long-term peak power demand forecasting, as shown in Table 4, indicates that long-term forecasting results of the proposed model are better than those of IGCEP 2021. As far as research question 3 is concerned, domain experts have reached a consensus that mid-term power demand prediction helps in fuel management and plant maintenance scheduling. For research questions 4 and 5, selecting monthly peak power demand forecasting in the proposed model has eliminated the effect of misleading economic parameters like GDP and population without compromising the accuracy for mid- and long-term forecasting. The proposed framework produces better performance metrics. While answering the research question 6, it is obvious that nonlinear model SVR produced the best results. The power sector is highly invested, and in this regard, it causes a negative impact on the country’s economy. The same has been observed in Pakistan as well. So, to answer research questions 7 and 8, saving 1 MW will save millions of USD and definitely help in reducing circular debt.
The concept of the paper can 100% be implemented in any region of the world. The reason behind that is because the paper mainly focuses the system-generated load data of the power control center and climate data from the meteorological department. Both the departments exist in every country, and data are readily available. Second, implementing the model proposed in the paper solves the purpose of mid- and long-term prediction, thus enhancing the efficiency of the power sector of any country. The other big advantage of the proposed model is that it uses system-generated data, which eliminates the chance of wrong input. Moreover, continuity and consistency of data are ensured, and future values of engineered and climate features are easy to grab. In addition, the model is capable of absorbing the effect of new technologies like electric vehicles because the model mostly relies on historic engineering features and uses the mid-term horizon, which immediately picks the change in the power demand curve. Monthly peak load data, used in this model implementation, already incorporate the effect of economic features such as GDP and population, and hence, it almost eliminates the use of manipulated economic features for peak power demand forecasting, thus enhancing accuracy.
7 Future directions
In future, more features can be engineered, such as 11 dummy variables for each month in a year and the accuracy may be improved. In addition, the model can be replicated in microgrids to feed electricity from alternate sources of energy and reduce the load on the national grid. The same can be very helpful for the power capacity trading market and electricity exchange in future. Moreover, due to the induction of smart meters and smart grids, a huge volume and high velocity of data are generated. Handling this large amount of data in real time along with achieving computational efficiency is a big challenge for power sector data experts. As power demand prediction requires access to datasets/databases of other departments/entities, which may not be willing to share their data due to security and legal bindings, one possible solution is to utilize distributed computing paradigms along with federated learning approaches to mitigate the security/privacy concerns. Effective policies and regulations are needed from the government’s side to ensure smooth operations considering the evolution of the traditional power grid into the smart grid (ICT-enabled power grid). Fossil fuel power plants are the main cause of carbon emissions. It can be reduced by using alternative sources of energy. The off-grid methodology can be used by forecasting day-ahead peak load of an area and feeding it with power from an alternative source. The same study can be implemented for day-ahead peak load forecasting to reduce CO2 emissions.
Data availability statement
The data analyzed in this study are subject to the following licenses/restrictions: the daily peak load data generated by the National Power Control Center (NPCC) in Pakistan are used to filter out monthly peak power demand as a dependent variable. Climate data are gathered from the Meteorological Department of Pakistan, while economic features are collected from the Bureau of Statistics of Pakistan. The final dataset is prepared by merging the climate/calendar dataset and the economic dataset along with the NPCC’s monthly peak load data. Feature engineering is done in the preprocessing phase to create new features using daily or monthly peak load data generated by the NPCC’s system. Requests to access these datasets should be directed to dr.danish@szabist-isb.edu.pk.
Author contributions
AA: Conceptualization, Data curation, Investigation, Methodology, Software, Validation, Visualization, Writing–original draft, Writing–review and editing. DM: Conceptualization, Data curation, Formal analysis, Investigation, Methodology, Project administration, Resources, Supervision, Validation, Visualization, Writing–original draft, Writing–review and editing. MSQ: Conceptualization, Formal analysis, Investigation, Methodology, Software, Writing–original draft, Writing–review and editing. MBQ: Conceptualization, Data curation, Formal analysis, Investigation, Methodology, Software, Supervision, Validation, Writing–original draft, Writing–review and editing. KK: Funding acquisition, Project administration, Validation, Writing–review and editing.
Funding
The author(s) declare that no financial support was received for the research, authorship, and/or publication of this article.
Conflict of interest
The authors declare that the research was conducted in the absence of any commercial or financial relationships that could be construed as a potential conflict of interest.
Publisher’s note
All claims expressed in this article are solely those of the authors and do not necessarily represent those of their affiliated organizations, or those of the publisher, the editors, and the reviewers. Any product that may be evaluated in this article, or claim that may be made by its manufacturer, is not guaranteed or endorsed by the publisher.
References
Abumohsen, M., Owda, A. Y., and Owda, M. (2023). Electrical load forecasting using LSTM, GRU, and RNN algorithms. Energies 16 (5), 2283. doi:10.3390/en16052283
Ali, W., Hussein, M., and Mina, L. (2020). Monthly peak-load demand forecasting for sulaimani governorate using different weather conditions based on ANN model. Sulaimani J. Eng. Sci. 7 (1), 11–22. doi:10.17656/sjes.10118
Almazrouee, A. I., Almeshal, A. M., Almutairi, A. S., Alenezi, M. R., and Alhajeri, S. N. (2020). Long-term forecasting of electrical loads in Kuwait using prophet and holt–winters models. Appl. Sci. 10 (16), 5627. doi:10.3390/app10165627
Antonopoulos, I., Robu, V., Couraud, B., Kirli, D., Norbu, S., Kiprakis, A., et al. (2020). Artificial intelligence and machine learning approaches to energy demand-side response: a systematic review. Renew. Sustain. Energy Rev. 130, 109899. doi:10.1016/j.rser.2020.109899
Aslam, S., Herodotou, H., Mohsin, S. M., Javaid, N., Ashraf, N., and Aslam, S. (2021a). A survey on deep learning methods for power load and renewable energy forecasting in smart microgrids. Renew. Sustain. Energy Rev. 144, 1–55. doi:10.1016/j.rser.2021.110992
Aslam, S., Herodotou, H., Mohsin, S. M., Javaid, N., Ashraf, N., and Aslam, S. (2021b). A survey on deep learning methods for power load and renewable energy forecasting in smart microgrids. Renew. Sustain. Energy Rev. 144, 110992. doi:10.1016/j.rser.2021.110992
Awan, U., and Knight, I. (2020). Domestic sector energy demand and prediction models for Punjab Pakistan. J. Build. Eng. 32, 101790. doi:10.1016/j.jobe.2020.101790
Behm, C., Nolting, L., and Praktiknjo, A. (2020). How to model European electricity load profiles using artificial neural networks. Appl. Energy 277, 115564. doi:10.1016/j.apenergy.2020.115564
Bhandari Srs, B., and Kumar Jha, A. (2018) Short term electric load forecasting of Kathmandu valley of Nepal using artificial neural network.
Chabouni, N., Belarbi, Y., and Benhassine, W. (2020). Electricity load dynamics, temperature and seasonality Nexus in Algeria. Energy 200, 117513. doi:10.1016/j.energy.2020.117513
Chang, P.-C., Fan, C.-Y., and Lin, J.-J. (2011). Monthly electricity demand forecasting based on a weighted evolving fuzzy neural network approach. Int. J. Electr. Power and Energy Syst. 33 (1), 17–27. doi:10.1016/j.ijepes.2010.08.008
del Real, A. J., Dorado, F., and Durán, J. (2020). Energy demand forecasting using deep learning: Applications for the French grid. Energies 13 (9), 2242. doi:10.3390/en13092242
Dhaval, B., and Deshpande, A. (2020). Short-term load forecasting with using multiple linear regression. Int. J. Electr. Comput. Eng. (IJECE) 10 (4), 3911. doi:10.11591/ijece.v10i4.pp3911-3917
Farooq, M. (2018) System operation and control. Islamabad, Pakistan: CPPAG. Available at: https://www.cppa.gov.pk/DownloadFiles/Other/Generation%20Technologies%20-%20Farooq%20CPPA.pdf-180724034743617.pdf.
Government of Pakistan (2020) Year Book 2019-20. Islamabad, Pakistan: GoP. Available at: https://cabinet.gov.pk/SiteImage/Publication/Year%20Book%20(2019-20).pdf.
Ilyass, E. (2017) Power control system and planning Pakistan. Islamabad, Pakistan: National Power Control Center NPCC. Available at: https://www.saarcenergy.org/wp-content/uploads/2018/05/Pakistan%20NTDC%20-%20NPCC-%20SAARC%20BD%20Workshop,%2010-11DEC2017.pdf.
Iqbal, A., Nadeem, A., Arslan, M. M., Javed, M. A., and Arshad, N. (2021). “Does Pakistan have enough electricity generation to support massive penetration of electric vehicles?,” in 2021 IEEE Texas Power and Energy Conference (TPEC), College Station, TX, USA, 02-05 February 2021, 1–6.
Kale, R. V., and Pohekar, S. D. (2014). “Electricity demand and supply scenarios for Maharashtra (India) for 2030,” an application of long-range energy alternatives planning. Energy Policy 72, 1–13. doi:10.1016/j.enpol.2014.05.007
Kandananond, K. (2011). Forecasting electricity demand in Thailand with an artificial neural network approach. Energies 4 (8), 1246–1257. doi:10.3390/en4081246
Kazemzadeh, M.-R., Amjadian, A., and Amraee, T. (2020). A hybrid data mining driven algorithm for long term electric peak load and energy demand forecasting. Energy 204, 117948. doi:10.1016/j.energy.2020.117948
Khan, S., Aslam, S., Mustafa, I., and Aslam, S. (2021). Short-term electricity price forecasting by employing ensemble empirical Mode decomposition and extreme learning machine. Forecasting 3 (3), 460–477. doi:10.3390/forecast3030028
Kim, M., Choi, W., Jeon, Y., and Liu, L. (2019). A hybrid neural network model for power demand forecasting. Energies 12 (5), 931. doi:10.3390/en12050931
Kumar, M., and Pal, N. (2023). Machine learning-based electric load forecasting for peak demand control in smart grid. CMC-COMPUTERS Mater. CONTINUA 74 (3), 4785–4799. doi:10.32604/cmc.2022.032971
Kwon, B.-S., Park, R.-J., and Song, K.-B. (2020). Short-term load forecasting based on deep neural networks using LSTM layer. J. Electr. Eng. Technol. 15 (4), 1501–1509. doi:10.1007/s42835-020-00424-7
Li, K., and Zhang, T. (2018). Forecasting electricity consumption using an improved Grey prediction model. Information 9 (8), 204. doi:10.3390/info9080204
Liu, S., Zeng, A., Lau, K., Ren, C., Chan, P.-w., and Ng, E. (2021). Predicting long-term monthly electricity demand under future climatic and socioeconomic changes using data-driven methods. A case study of Hong Kong. Sustain. Cities Soc. 70, 102936. doi:10.1016/j.scs.2021.102936
Mir, A. A., Alghassab, M., Ullah, K., Khan, Z. A., Lu, Y., and Imran, M. (2020). “A review of electricity demand forecasting in low- and middle-income countries,” the demand determinants and horizons. Sustainability 12 (15), 5931. doi:10.3390/su12155931
Mughees, N., Mohsin, S. A., Mughees, A., and Mughees, A. (2021). Deep sequence to sequence Bi-LSTM neural networks for day-ahead peak load forecasting. Expert Syst. Appl. 175, 114844. doi:10.1016/j.eswa.2021.114844
Nepal, B., Yamaha, M., Yokoe, A., and Yamaji, T. (2019). Electricity load forecasting using clustering and ARIMA model for energy management in buildings. Jpn. Archit. Rev. 3 (1), 62–76. doi:10.1002/2475-8876.12135
NEPRA (2018) State of Industry report 2010 to 2018. NEPRA. Available at: https://nepra.org.pk/publications/State%20of%20Industry%20Reports.php.
NEPRA (2019) State of Industry report 2018-19. Islamabad, Pakistan: NEPRA. Available at: https://nepra.org.pk/publications/State%20of%20Industry%20Reports/State%20of%20Industry%20Report%202018.pdf.
NEPRA (2020) State of Industry report 2020. Islamabad, Pakistan: NEPRA. Available at: https://nepra.org.pk/publications/State%20of%20Industry%20Reports/State%20of%20Industry%20Report%202020.pdf.
NEPRA (2021) Indicative generation capacity expansion plan (IGCEP) 2021-30 report. Islamabad, Pakistan: NEPRA. Available at: https://nepra.org.pk/Admission%20Notices/2021/06%20June/IGCEP%202021.pdf.
Nor Hamizah Miswan RMSaSHHA (2017) ARIMA with regression model in modelling electricity load demand.
NTDC (2011) Power reference data book. Lahore, Pakistan: National Transmission and Dispatch Company. Available at: https://ntdc.gov.pk/ntdc/public/uploads/services/planning/power%20data%20reference%20books/pdrb%202003-11.pdf.
NTDC (2017) Igcep 2018-2040. Lahore, Pakistan: National Transmission and Dispatch Company. Available at: https://ntdc.gov.pk/ntdc/public/uploads/services/planning/power%20data%20reference%20books/pdrb%202010-11%20to%202016-17.pdf.
NTDC (2018a) Igcep 2018-2040. Lahore, Pakistan: National Transmission and Dispatch Company. Available at: https://ntdc.gov.pk/ntdc/public/uploads/downloads/NTDC.PSP.IGCEP.pdf.
PBS (2022) Pakistan statistical Yearbook 2022. Islamabad, Pakistan: PBS. Available at: https://www.pbs.gov.pk/sites/default/files/other/yearbooks/Pakistan_Statistical_Year_Book_2022.pdf.
Waqas Khan, P., Byun, Y.-C., Lee, S.-J., and Park, N. (2020). Machine learning based hybrid system for imputation and efficient energy demand forecasting. Energies. 13, 2681. doi:10.3390/en13112681
Renewable and Sustainable Energy Reviews (2020). Renewable and sustainable energy reviews. Peer-Reviewed J. 130, 109899.
Saravanan, S., Subramanian, K., and Thiyagarajan, C. (2012). India’s electricity demand forecast using regression analysis and artificial neural networks based on principal components. ICTACT J. Soft Comput. 02 (04), 365–370. doi:10.21917/ijsc.2012.0057
Shah, I., Iftikhar, H., Ali, S., and Wang, D. (2019). Short-term electricity demand forecasting using components estimation technique. Energies 12 (13), 2532. doi:10.3390/en12132532
Shaik, S. A., Mirjat, N. H., Korejo, W. S., Walasai, G. D., Larik, A. S., and Hussain, A. (2017). Electricity demand forecasting. A pakistans perspective. Asian J. Eng. Sci. Technol. 2 (1).
Shehzad, F., Ullah, Z., Alhussain, M., Aurangzeb, K., and Aslam, S. (2023). Deep learning-based meta-learner strategy for electricity theft detection. Front. Energy Res. 11, 1–13. doi:10.3389/fenrg.2023.1232930
Sigauke, C., and Nemukula, M. M. (2018). Modelling extreme peak electricity demand during a heatwave period: a case study. Energy Syst. 11 (1), 139–161. doi:10.1007/s12667-018-0311-y
Keywords: National Power Control Center, artificial neural network, SVR, indicative generation capacity expansion plan, system operation
Citation: Aziz A, Mahmood D, Qureshi MS, Qureshi MB and Kim K (2024) AI-based peak power demand forecasting model focusing on economic and climate features. Front. Energy Res. 12:1328891. doi: 10.3389/fenrg.2024.1328891
Received: 27 October 2023; Accepted: 16 April 2024;
Published: 29 July 2024.
Edited by:
Muhammad Babar Rasheed, University of Alcalá, SpainReviewed by:
Ijaz Ul Haq, Universitat de Lleida, SpainSheikh Tahir Bakhsh, Cardiff Metropolitan University, United Kingdom
Asif Khan, King Abdulaziz University, Saudi Arabia
Copyright © 2024 Aziz, Mahmood, Qureshi, Qureshi and Kim. This is an open-access article distributed under the terms of the Creative Commons Attribution License (CC BY). The use, distribution or reproduction in other forums is permitted, provided the original author(s) and the copyright owner(s) are credited and that the original publication in this journal is cited, in accordance with accepted academic practice. No use, distribution or reproduction is permitted which does not comply with these terms.
*Correspondence: Muhammad Shuaib Qureshi, c2h1YWliLnF1cmVzaGlAcGFmLWlhc3QuZWR1LnBr