 Yongbing Yan
 Yan Shao
- China Power Information Technology Co, Ltd., Beijing, China
Northeast China has been facing a severe power shortage situation. Since September 2021, “power rationing” events occurring in many places in the three provinces of northeast China have been causing inconvenience to people’s production and life. Therefore, it is particularly important to accurately predict the power load combined with the influencing factors of local power consumption. At the same time, the northeast region is about to enter the heating season, and the pressure on coal and electricity will further increase. In Heilongjiang Province, due to coal capacity control, limited production led to the high price of thermal coal; wind power photovoltaic output fluctuations, the epidemic, and other reasons also resulted in a large gap in the power supply side. Improving the power demand forecasting ability is of great significance to strengthen the reliability of people’s daily electricity consumption, rational distribution of power generation plans, and deployment of power grid resources. In order to improve the accuracy of electricity consumption prediction in Heilongjiang Province, Markov error correction is carried out on the basis of the backpropagation (BP) neural network prediction model so that the final prediction results have the advantages of the BP neural network prediction model and Markov model. In addition, it is more suitable for the prediction of random series data with high volatility, the prediction accuracy can be improved significantly, and the overall trend of electricity consumption can be predicted more accurately.
1 Introduction
Northeast China has been facing a severe situation of electricity shortage. The main reasons are the national macro-control, coal production capacity restrictions, the closure of many coal mines, and the scope and speed of power consumption growth that exceed expectations such that the supply side of thermal coal cannot quickly respond to the increase in demand. At the same time, the generation of new energy sources such as wind power and photovoltaic power is small, and there are problems such as unstable power generation and immature energy storage technology. In addition, due to the impact of the epidemic, the number of incoming orders from overseas markets has exploded in the short term, and electricity consumption has increased significantly each year, resulting in a large gap in the power supply side of northeast China in recent years. More accurate electricity consumption forecast is particularly urgent and important. The power generation mode of Heilongjiang Province is dominated by traditional thermal power (more than 78%), wind power (more than 15%), and solar power and thermal power generation (6%). More accurate electricity consumption forecast is of great significance for improving the reliability of people’s daily electricity consumption, reducing the operating cost of power enterprises, rational distribution of power generation plans, and improving power demand side management. At the same time, it would be helpful to provide policy guidance to the government on the reform of electricity prices, improve the electricity market, lead the low-carbon circular economy model, and drive the modernization transformation and upgrading of Heilongjiang’s industrial structure.
Since the 1950s, domestic and foreign experts and relevant practitioners began to study the methods of power load forecasting; power forecasting methods mainly experienced three stages: 1) manual forecasting methods. Before 1970, the main methods included the single-consumption straight method, power elasticity method, and per capita indicator load analysis method (Zhu, 2017; Onja et al., 2020; Xu, 2020). The traditional forecasting methods require a large amount of complicated data, and the corresponding statistical methods are relatively cumbersome. 2) Traditional forecasting methods. Before 1990, mainly time series methods were used. For example, some studies (Zeng et al., 2012; Cui and Xu, 2015; Xu et al., 2020) used the time series technology to forecast electricity consumption. The regression analysis method (Dergiades and Tsoulfidis, 2008; Hondroyiannis, 2010) established a co-integration autoregressive distributed lag model to predict the residential electricity consumption in the United States and Australia. Gray system and other methods, such as the introduction of gray correlation degree (Wang, 2005; The garden, 2015; Zhao, 2015), were used for analysis and prediction. This stage prediction method greatly reduces statistical work, but many models do not take comprehensive factors into account, and their adaptability needs to be improved. 3) Modern forecasting methods. Since 1990, modern prediction methods represented by artificial neural networks have emerged. Backpropagation (BP) and long short-term memory (LSTM) neural network models are representative and widely used. For example, some studies (Xu et al., 2017; Xu et al., 2019; Zheng et al., 2020) predicted the electricity consumption index based on the LSTM model, while other studies (Beccali et al., 2011; Shobha and Balasaranya, 2012) used the artificial neural network model and the RBFN neural network to predict residential electricity consumption and household air conditioning power consumption in the Mediterranean region. Subsequently, the combination prediction of the neural network combined with traditional methods also occurred, such as the combination of the gray theory and artificial neural network (Chen, 2019) for electricity consumption prediction tests. Some studies (Jin et al., 2011; He et al., 2019; Zhang et al., 2019) used the intelligent algorithm of support vector or PCA and deep long-term memory combined with artificial neural networks to predict electricity consumption.
According to the summary analysis, the prediction of electricity consumption in modern times still needs to be further studied in the following aspects: 1) The data of electricity consumption time series are often non-stationary. It is difficult for econometrics to effectively solve its pseudo-regression problem, and it is difficult for the LSTM model to solve the problem of slow training fitting speed and the indistinct gradient when the length of time series data is large. 2) In the case of discrete data in the gray correlation degree, the gray level of the data will reduce the accuracy of the prediction, and it is impossible to take into account multiple indicator variables affecting the power consumption at the same time. 3) Traditional single models were used in electricity consumption prediction in the past, and no specific indicator variable factors were selected for the studied region. In the selection of the research region, the northeast border provinces under the background of a new industrialization transformation were not involved. The innovations of this paper are reflected in the following aspects:
1) The factors affecting electricity consumption in Heilongjiang Province: This paper selects factors that have had a great impact on the economic development of northeast China in recent years, such as serious population loss (population), coal capacity restriction resulting in insufficient coal power output (energy consumption), the “double carbon” new industrialization transformation (the contribution rate of the output value of the secondary industry to gross domestic product), and other factors that are highly adaptive, which were combined with the background of the times and the regional characteristics.
2) Data processing: The fitting value of the BP neural network is calculated, the relative error is found, and normalization processing is carried out. When dividing the Markov state space, the classical golden section method is adopted and combined, which is simple and can ensure the rationality of the data state space division to the maximum extent.
3) Model optimization: Compared with the more modern artificial neural network prediction methods, the BP neural network has strong advantages in nonlinear mapping ability and generalization characteristics. In this paper, based on the modern BP prediction model and Markov prediction method, the prediction error caused by the dependence of the original model training on data samples is greatly reduced, the problem of large random fluctuations of power consumption in the prediction is solved, and the prediction accuracy is further improved. This combination method has been rarely used in the field of electricity consumption prediction in recent years, and it is worth popularizing widely.
In terms of model selection and research methods, this paper can be used as a reference for the study of electricity consumption forecast of other provinces in the old industrial base of northeast China and provide technical support for alleviating the large-scale “power cut-off” situation caused by power shortage in northeast China in recent years (Yan, 2015; Hu et al., 2017; Guo, 2019; Liu et al., 2020; Qiao et al., 2020; He, 2021; Ma and Wu, 2021; Wu et al., 2022; Xu et al., 2022; Wu et al., 2023).
2 BP neural network and the construction of the Markov chain prediction model
2.1 BP neural network model
The BP neural network has a wide application prospect. It is a multi-level feedforward neural network trained according to the error direction and propagation algorithm.
The BP neural network is composed of an input layer, hidden layer, and output layer, as shown in Figure 1.
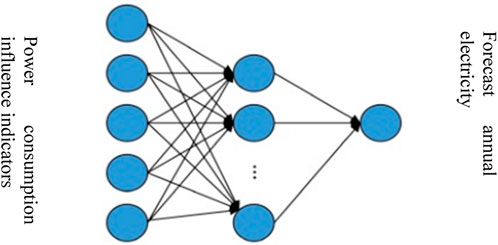
FIGURE 1. Structure of the BP neural network.
2.2 Markov chain prediction model
The Markov chain is an important branch of the field of stochastic process, which determines the probability of the future state by the Markov chain given the state of the system. It is characterized by the following features: the future is only affected by the present rather than the past, and its prediction accuracy is relatively high, which is particularly prominent in many prediction problems.
If any
Through the historical data of power consumption and its influencing factors, the fitting value of the BP neural network is calculated, the relative error is calculated and normalized, and the Markov state space is divided (using the golden section method). The mean value of the normalized relative error is
In the formula,
where
2.3 Markov modifies the BP neural network prediction value
The relative error between the predicted value and the actual value of the BP neural network is divided into different state spaces
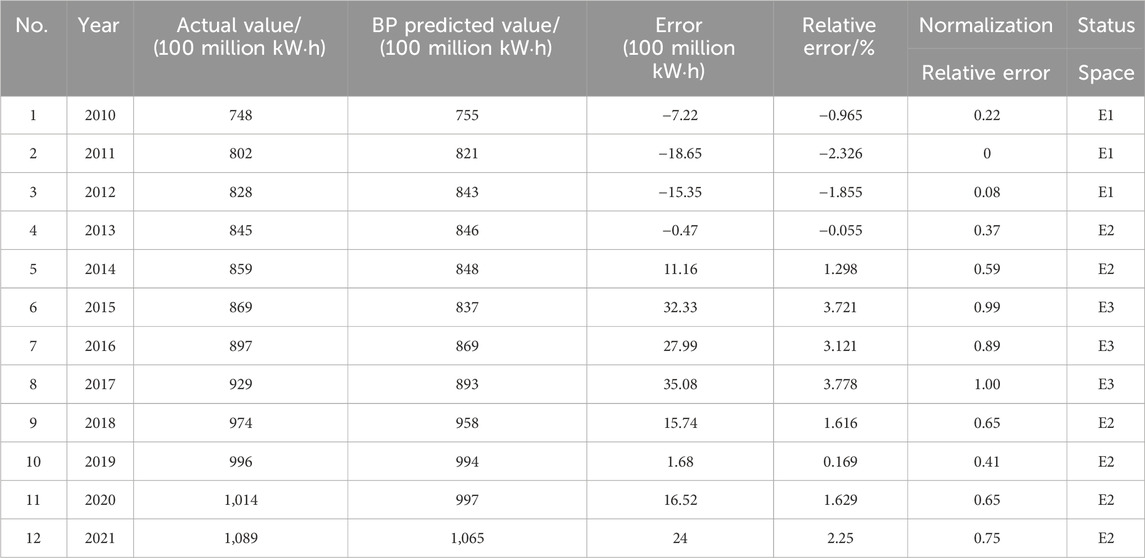
TABLE 1. Relative error and status space between the predicted value and actual value of the BP neural network.
The preliminary result of measurement is found, and then, the Markov method is used to correct the preliminary result of prediction. Then, the final predicted result is as follows:
where
3 Case analysis
With the 2022 edition of the China Heilongjiang Provincial Statistical Data Yearbook as the reference source, the whole caliber and whole society electricity consumption of the whole province during the 12 years from 2010 to 2021 is used. We refer to the data of six indicators, namely, gross domestic product (GDP), population, fixed asset investment of the whole society, disposable income of urban residents, total energy consumption, and industrial structure (see Table 1). The industrial structure is expressed in terms of the contribution rate of the output value of the secondary industry to GDP.
3.1 Preliminary forecast results of electricity consumption in Heilongjiang Province based on the BP neural network
Eleven pieces of data in MATLAB (R2020b) (Table 1) are used as training samples for BP neural network modeling. The number of nodes in the input layer is 6, and the number of nodes in the output layer is 1, that is, the total electricity consumption of the whole society. The number of nodes in the hidden layer can be calculated according to the following formula:
When the network input and output nodes are 6 and 1, the following nodes are selected: 2, 4, and 6. After many tests, when 2 is selected, the network training result is the best. Therefore, the network structure is determined as 6-2-1. The value 0.1 is set as the learning parameter, 0.0001 is set as the learning accuracy, and 1,000 is set as the number of training. The structure of the BP neural network is shown in Figure 2.
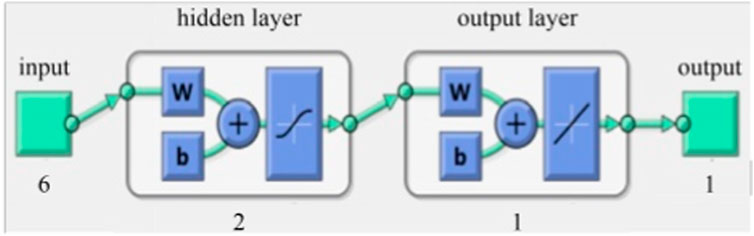
FIGURE 2. 6-2-1 BP neural network structure.
The Heilongjiang Provincial government attaches great importance to the forecast of power demand and the construction and improvement of the supply side of the power market, which is of great significance for the reasonable allocation of power grid resources, scientific and effective guidance of power investment, and improvement of the overall operating efficiency of the power system. In the past, the deviation of power consumption forecast in the northeast provinces was more than three percentage points. This paper included factors affecting regional power consumption, such as gross domestic product, population, and fixed asset investment of the whole society, into the research scope. There are many types of factors that affect the amount of electricity consumption, including the level of economic activity, industrial structure, scientific and technological progress, technological development, seasonal and climatic conditions, policies and regulations, population growth, and urbanization. This paper considers 12 sub-influencing factors under these six types of influencing factors and uses principal component analysis to select six factors that have a strong correlation with the power consumption of the provinces under study, namely, gross domestic product (GDP), population, fixed asset investment of the whole society, disposable income of urban residents, total energy consumption, and the contribution of the output value of the secondary industry to GDP. We mainly weigh the above different factors according to the principal component analysis method. Due to the limitation of the length of the article and the fact that it is not the focus of the article, the specific process is not shown in detail in this article. The six factors are directly analyzed. These data were substituted into the BP neural network system and the forecast was made (see Table 2).
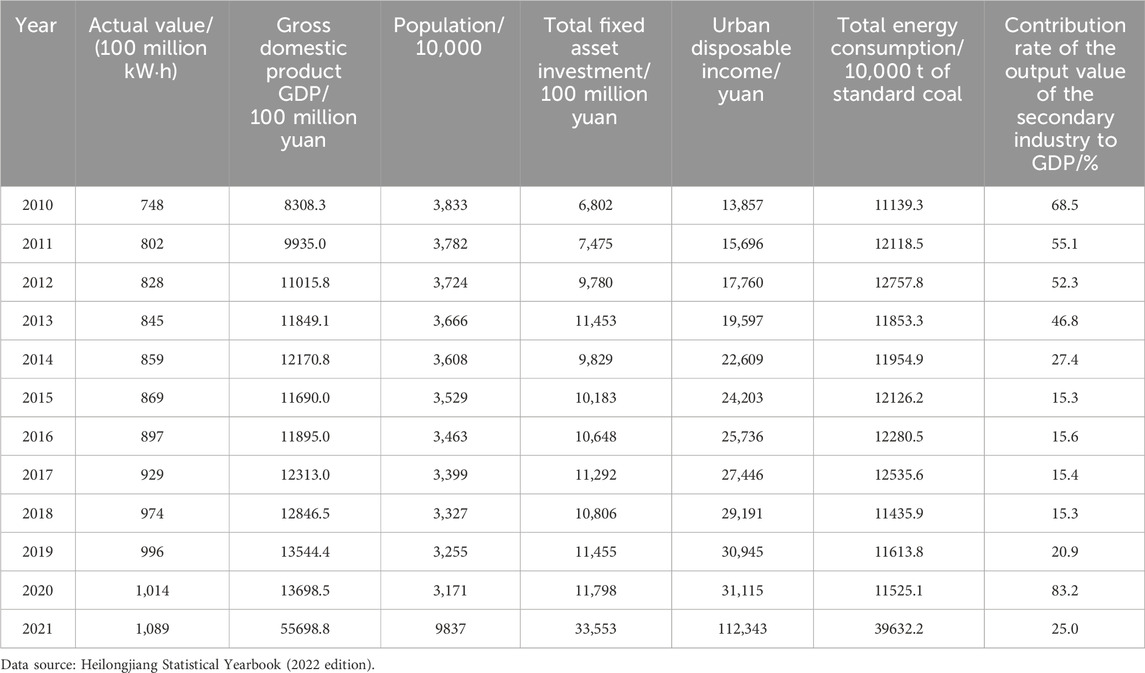
TABLE 2. Electricity consumption of Heilongjiang Province from 2010 to 2021 and its related influencing factors.
Then, the error analysis results of the BP neural network and the error curve of the BP neural network training are obtained. The BP neural network is used to calculate the predicted and actual value of electricity consumption to obtain the error, relative error, and normalized relative error (see Table 1). The latest public electricity consumption data of the Heilongjiang Statistical Yearbook are only of the last 12 years, and the experimental data are limited. The variance of the normalized relative error between the predicted value and the actual value obtained by the BP neural network is small, resulting in the state division of experimental data being limited, so the results of the state division are not very rich, but the classic golden section method is adopted. The golden section method is a heuristic method based on the principle of interval elimination; that is, two points
The predicted value and actual value of electricity consumption in Heilongjiang Province are drawn into a line chart, as shown in Figure 3.

FIGURE 3. Predicted value and actual value of electricity consumption in Heilongjiang Province by the BP neural network.
From the BP neural network predicted value and the actual value of Heilongjiang Province electricity consumption in Figure 3, it can be seen that there is room for further improvement in the accuracy of the prediction results. Below, we continue to use the Markov method to revise the preliminary prediction results.
3.2 Revision of the Heilongjiang Province electricity consumption forecast result based on the Markov chain
The key of the Markov correction method is to obtain the corresponding probability transfer matrix. The following is the error between the predicted value of electricity consumption and the actual value obtained using the BP neural network. The electricity consumption data of Heilongjiang Province from 2010 to 2021 are divided into states to obtain the Markov state transfer table. Then, the corresponding probability transfer matrix can be obtained, and the final predicted value can be obtained by Markov correction.
3.2.1 Division of data states
1) The relative error sequence e(t) is calculated from Table 2, and the mean value of its relative error ratio after normalization is
The status interval is
2) The states of the above interval is restored to the relative error rate interval,
Then, the restored interval is E1: [–2.33–0.319], E2: [–0.319–2.928], and E3: [2.928–3.78], and the state space division of the 11 years is shown in Table 1. At the same time, Table 3 can be obtained according to the transfer of different states.

TABLE 3. Markov state transition table.
3.2.2 Computing the probabilistic transition matrix
The Markov state transition matrix is as follows:
Then, using the Markov method to revise the preliminary result of prediction, and using Eqs 4 and 5, the predicted value and actual value of Heilongjiang Province electricity consumption modified by the BP neural network + Markov method can finally be obtained.
3.2.3 Final forecast of electricity consumption
By drawing the predicted value of Heilongjiang Province’s electricity consumption by the BP neural network + Markov modified method and the actual value into a line chart (see Figure 4), the forecast can be visually observed.
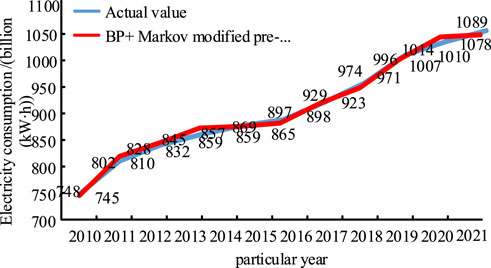
FIGURE 4. The BP neural network + Markov revised predicted value and actual value of Heilongjiang Province electricity consumption.
Figure 4 shows the final forecast result of electricity consumption after Markov correction. Compared with Figure 3, the fitting degree between the electricity consumption prediction curve and the actual electricity consumption curve after error correction by the Markov chain is significantly improved near the peak and valley of electricity consumption, and the prediction accuracy is also significantly improved.
Taking 2021 as the initial state
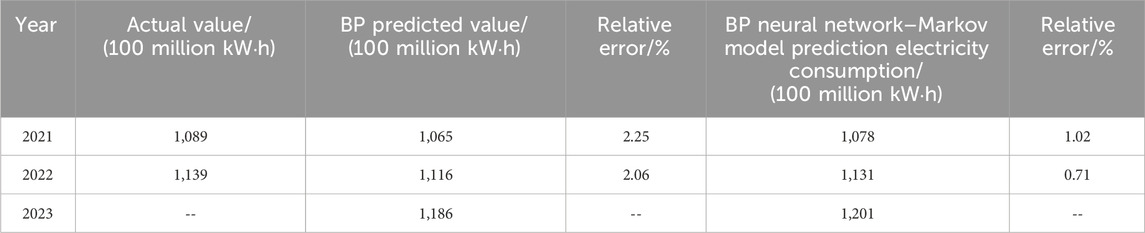
TABLE 4. Comparison of the BP predicted values with BP–Markov predicted values.
In the past, the deviation of the forecast of electricity consumption in the northeast provinces was more than three percentage points. In this paper, the BP neural network–Markov combination model is used to obtain the predicted value in the forecast model described above, where the forecast error rate in 2022 is reduced to 0.71%. At the same time, in the line chart of electricity consumption forecast from 2010 to 2021, the fit degree near the peak and valley has been significantly improved.
The model method adopted in this paper can take into account the different factors affecting electricity consumption in different provinces and select the square in the input layer.
On the other hand, different types of influencing factor’s data can be selected or added according to different situations in each region, and the method has both flexibility and self-applicability. It also has the reference value for the forecast of electricity consumption in other provinces or other regions of the old industrial base in northeast China.
There are many methods of Markov state division, including the arithmetic difference method, golden section method, maximum mean square error method, and fuzzy clustering algorithm. The time span of the historical data used in this paper is about 10 years, which is not long. The essence of the golden section method is to divide the interval into three sections. Only the proportion of the golden section makes the effect of the golden section method better, and it is widely used in painting and sculpture. It is a classical algorithm in optimization calculation, famous for its simple algorithm, uniform convergence speed, and good effect, and it is the basis of many optimization algorithms, which is suitable for convex functions in one-dimensional intervals.
In view of the Heilongjiang Statistical yearbook, the latest public electricity consumption selection data are only of the last 12 years; the time span is not large, resulting in less experimental data. In this paper, the BP neural network prediction model, which is better than the conventional prediction method in the case of a small sample size, is selected first. Then, the golden section method, which is not very rich but classical, is used to divide the states. Finally, Markov correction is used to reveal the internal variation law between the sample and the prediction error, which further improves the accuracy of the electricity consumption prediction. In the division of state space, the next step can be studied by using more multi-dimensional and three-dimensional division methods.
4 Conclusion and prospect
Northeast China is about to enter the heating season, and the pressure of coal and electricity consumption will further increase. Because of the influence of multiple factors of new situations at home and abroad on the whole society’s electricity load, the precision improvement of its forecast is particularly important. In this paper, the BP neural network prediction model is used to forecast the annual social electricity consumption in Heilongjiang Province, and the Markov method is used to correct the error. The prediction accuracy of annual electricity consumption in Heilongjiang Province is improved by more than 98.9%, and the fitting degree near the peaks and valleys is significantly improved, which can further ensure the accuracy of the error requirements and provide more accurate electricity consumption predictions.
As a key commodity grain and old industrial base in China, the precision of power demand forecasting in Heilongjiang Province will help accelerate the modern construction of agriculture, help the industrial chain to shift toward the direction of intensive processing, accelerate the transformation of energy structure, and help the old industrial base in northeast China to achieve the goal of “double carbon” and shift toward sustainable development. Continuously improving the power demand forecasting ability, strengthening the planning and layout of the power industry, and paying attention to and accelerating the construction and improvement of the power market are conducive to improving the safety, economy, and reliability of the overall power consumption of the whole society. It not only has a guiding role for the development of the electric power industry in Heilongjiang Province and even the northeast region but also has important significance for the revitalization of the northeast region.
Data availability statement
The original contributions presented in the study are included in the article/Supplementary Material; further inquiries can be directed to the corresponding author.
Author contributions
YY: investigation and writing–original draft. YS: investigation, writing–original draft, and supervision. DW: investigation and writing–original draft. ZY: investigation and writing–original draft. HM: investigation and writing–original draft. QL: investigation and writing–original draft. PL: investigation and writing–original draft.
Funding
The authors declare that financial support was received for the research, authorship, and/or publication of this article.
Conflict of interest
Authors YY, YS, DW, ZY, HM, QL, and PL were employed by China Power Information Technology Co., Ltd.
The authors declare that this study received funding from the Science and Technology Project of State Grid Co., Ltd., “Unified Data Base power data enrichment and improvement and power consumption structure and development trend analysis model Research” (0500308566). The funder had the following involvement in the study: study collection, interpretation of data, and the decision to submit it for publication.
Publisher’s note
All claims expressed in this article are solely those of the authors and do not necessarily represent those of their affiliated organizations, or those of the publisher, the editors, and the reviewers. Any product that may be evaluated in this article, or claim that may be made by its manufacturer, is not guaranteed or endorsed by the publisher.
References
Beccali, M., Cellura, M., and Brano, V. L. (2011). Short-term prediction of household electricity consumption: assessing weather sensitivity in a Mediterranean area. Renew. Sustain. Energy Rev. 25 (12), 2040–2065.
Chen, J. (2019). Application of grey theory and artificial neural network in medium and long term load forecasting of power system. Suzhou: Soochow University.
Cui, H., and Xu, P. (2015). Short-term electric load forecasting in Summer based on ARIMAX Model. Prot. Control Electr. Power Syst. 43 (4), 108–114.
Dergiades, T., and Tsoulfidis, L. (2008). Estimating residential demand for electricity in the United States1965-2006. Energy Econ. 30 (30), 2722–2730. doi:10.1016/j.eneco.2008.05.005
Guo, J. (2019). Prediction method of storage system performance based on improved artificial neural network. Comput. Sci. 46 (S1), 52–55.
He, X. (2021). Research and application of residential electricity consumption forecast based on Machine learning in Chengdu. Beijing: Beijing University of Posts and Telecommunications.
He, Y., Zhai, D., and Su, G. (2019). Medium and long term load forecasting of power grid based on PCA and improved BP neural network. Electr. Power Big Data 22 (5), 74–80.
Hondroyiannis, G. (2010). Estimating residential demand for electricity in Greece. Energy Econ. 10 (26), 319–334. doi:10.1016/s0140-9883(04)00011-8
Hu, J., Zhang, Z., and Zhang, H. (2017). Analysis of regional economy and power demand in Northeast China during the 12th Five-Year Plan. Jilin Electr. Power 45 (2), 1–5.
Jin, L., Liu, J., and Wang, J. (2011). Medium and long term load forecasting method using support vector Machine and Simulated annealing algorithm. Proc. CSEE 31 (16), 86–97.
Liu, D., Wang, W., and Zhang Hui, E. (2020). Application of Markov modified combined model in Medium and long term available electricity consumption forecast of wind power in Xinjiang. Power Grid Technol. 44 (9), 3290–3297.
Ma, T., and Wu, Y. (2021). Load forecasting of distribution network based on grey correlation analysis method and BP neural network. Rural. electrification 12, 17–20.
Onja, B., Yao, Y. Z. C., and SR, A. (2020). Hybrid ensemble intelligent model based on wavelettransform swarmintelligence and artificial neural network for electricity demand forecasting. Sustain. Cities Soc. 21, 66.
Qiao, L., Wang, J., Guo, W., Guowen, L. I., and Han, J. (2020). Medium and short-term electricity demand prediction based on random forests algorithm. J. Electr. Power Sci. AndTechnology 2, 150–156.
Shobha, P., and Balasaranya, K. (2012). Estimation of power consumption for household electric appliances. J. Asian Econ. 5, 18–22.
The garden (2015). Study on load characteristics of large urban power grid. Zhengzhou: Zhengzhou University.
Wang, W. (2005). Research on rural electricity consumption in Hebei Province under the goal of all-round well-off society. Baoding: North China Electric Power University.
Wu, X., Chao, X., and Xiao, F. (2023). Long-term electricity consumption forecasting model based on RF variable selection and LSTM regression. Electr. Drive 53, 5.
Wu, Y., Miao, F., and Dong, Z. (2022). A neural network mid-term and short-term electricity consumption forecast model based on multiple influencing factors. J. Electr. Eng. 10, 1–12. doi:10.12677/jee.2022.101001
Xu, F. (2020). Short-term load forecasting based on machine learning. Guangzhou: South China University of Technology.
Xu, X., Gong, M., and Huang, L. (2019). High precision Power load Prediction based on Temperature information and deep Learning. Internet Things Technol. 9 (9), 97–101.
Xu, Y., Fang, L. H., and Zhao, D. (2017). Electricity consumption prediction based on LSTM neural network. Electr. Power Big Data 20 (8), 25–29.
Xu, Y., Wu, Z., and Zhu, H. (2020). Short-term power load forecasting based on Multi-scale Convolutional neural networks. J. Shenyang Univ. Technol. 42 (6), 618–623.
Xu, Z., Wang, Y., and Hong, J. (2022). Research on residential electricity demand forecast based on GM (1, 1) model. Eng. Manag. 3 (1), 108–111.
Yan, Y. (2015). Research on Medium and long term forecast of household electricity consumption in Beijing. Beijing: North China Electric Power University.
Zeng, M., Chen, C., and Liu, Y. (2012). Research on annual Electricity consumption forecasting model based on H-P filter forecasting technology. Hydropower Energy Sci. 30 (8), 175–178.
Zhang, Y., Qian, A., and Lin, L. (2019). Regional level ultra-short term load forecasting method based on deep short term memory network. Power Grid Technol. 43 (6), 1884–1892.
Zhao, G. (2015). Prediction of urban electricity consumption based on grey correlation degree and set pair analysis. Energy Res. Util. 4, 23–25.
Zheng, B., Qiu, W., and Hou, S. (2020). Research and application of power consumption index based on power big data analysis. J. Electr. Appl. 21 (1), 66–71.
Keywords: power supply side structural reform, power rationing in northeast China, Heilongjiang Province electricity consumption, BP neural network, Markov correction
Citation: Yan Y, Shao Y, Wang D, Yang Z, Ma H, Li Q and Li P (2024) Prediction of the whole society electricity consumption in northeast China based on the BP neural network and Markov. Front. Energy Res. 12:1326525. doi: 10.3389/fenrg.2024.1326525
Received: 23 October 2023; Accepted: 12 January 2024;
Published: 05 February 2024.
Edited by:
Alberto Benato, University of Padua, ItalyReviewed by:
Yunting Yao, Nanjing Normal University, ChinaAdriana Tokar, Politehnica University of Timișoara, Romania
Copyright © 2024 Yan, Shao, Wang, Yang, Ma, Li and Li. This is an open-access article distributed under the terms of the Creative Commons Attribution License (CC BY). The use, distribution or reproduction in other forums is permitted, provided the original author(s) and the copyright owner(s) are credited and that the original publication in this journal is cited, in accordance with accepted academic practice. No use, distribution or reproduction is permitted which does not comply with these terms.
*Correspondence: Yan Shao, emhhbmd4aWxhaTIwQGRudWkuZWR1LmNu