- 1Exploration and Development Project Department of Mahu Area of Xinjiang Oilfield Company, Karamay, Xinjiang, China
- 2Research Institute of Engineering Technique Xinjiang Oilfield Company, Karamay, Xinjiang, China
- 3College of Petroleum Engineering, China University of Petroleum (Beijing), Peking, China
It is significant to clarify the proppant distribution pattern under real fracturing conditions to optimize the sand addition process in hydraulic fracturing of the Mahu tight conglomerate reservoir. However, the laboratory experiment is far from the real fracturing condition due to the limitations of scale, pumping scale, and stress conditions. In this paper, the proppant in cuttings and mud was obtained by screening and cleaning samples from the high-deviated coring well of the Mahu conglomerate reservoir in Xinjiang. The sphericity of particles was observed by a continuous variable magnification microscope, and the transparency (TR) of particles and the red-blue difference (RBD) of reflected light were followed by transmitted light. Considering these three factors, the proppant identification method in cuttings was established to obtain the spatial location and distribution of proppant along the whole well section. The effect of proppant transport and placement was evaluated. The results show that: (1) Compared with the formation of mineral particles, the proppant has better sphericity, TR>20%, and RBD > 30. Combined with the surface roughness, luster, and associated minerals, the particle can be evaluated as a proppant. (2) The content of proppant with small particle size (40/70 mesh) is significantly higher than that with large particle size (20/40 mesh), which ranges from 10‰ to 450‰ and 5‰ to 280‰, respectively. (3) Horizontally, 20/40 mesh proppant migrates approximately 10m, and 40/70 mesh proppant migrates approximately 23 m in the hydraulic fracture. (4) In the longitudinal fracture, 20/40 mesh proppant was concentrated at a 12 m vertical distance from the adjacent well, while 40/70 mesh proppant was placed at a larger longitudinal range, approximately 10 m above and 10 m below the adjacent well. The research results have certain reference significance for the improvement measures of the sand-adding process in the Mahu tight conglomerate reservoir.
1 Introduction
The conglomerate reservoir in the Mahu Depression of Junggar Basin is a deeply buried, non-homogeneous, and challenging-to-develop reservoir. The horizontal well volume fracturing technology has achieved production breakthroughs. However, the extraction cost is high, the fracture morphology is complex during fracturing, and the proppant placement effect in the fractured fractures significantly affects the post-fracturing production increase (Zou et al., 2021; He et al., 2022a; He et al., 2022b; Li, 2022; Wang et al., 2022; Xu et al., 2022; Xu et al., 2023).
The study of proppant transport placement in fractures is divided into indoor experiments and numerical simulations. For indoor experiments, Dayan et al. (2009) and Alotaibi and Miskimins (2018) built a small-scale experimental setup and studied proppant transport in multi-branch fractures. It was shown that the number of fracture branches is the main factor affecting proppant distribution for multi-stage complex fractures. Huang et al. (2019) investigated the effect of injection parameters (polymer concentration, injection rate, proppant concentration, proppant type, etc.) on proppant transport in rough fractures. It was shown that the greater the fracturing fluid viscosity, the more uniformly the proppant was spread in the fracture. Jiang et al. (2021) designed a rough fracture test apparatus independently. They conducted sand transport tests under different wall roughness, pump injection displacement, proppant mass fraction, and fracturing fluid viscosity by the controlled variable method to reveal the influence law of different construction parameters on proppant transport in rough fractures. For numerical simulation, Izadi et al. (2017) and Kumar and Ghassemi (2019) investigated the proppant transport law in fractures using the existing 3D fracture simulator and considering the coupling effect between artificial and natural fractures. It was found that natural fracture location, size, and fracture orientation were the key parameters affecting proppant distribution in fractures. Kou et al. (2019) used the CFD-DEM method to study the proppant placement pattern in complex fractures. The results showed that the ratio of proppant particle size to branch fracture width determines the proppant placement effect in branch fractures. Guo et al. (2022) used a coupled CFD-DEM method considering accurate capture of particle motion to establish a three-dimensional model of complex fractures and investigate the effects of injection flow rate, fracturing fluid viscosity, and proppant density on the proppant transport spreading pattern in complex fractures (branching seam location, angle, and number of stages).
Indoor experiments are small in scale and pumping intensity, and the stress state of proppant transport in the fracture differs significantly from the real fracturing conditions; numerical simulation experiments are mostly modeled by equivalent fluid methods, which cannot portray the mechanical effects between particles and between particles and fracture walls. Drilling core wells at mine sites has become essential to visualize proppant distribution under real fracturing conditions. A set of proppant cleaning, screening, and identification methods has been developed abroad recently, using high-resolution scanning imaging technology and machine learning methods to improve proppant identification efficiency and using SEM-EDS analysis technology to assist in validating proppant identification methods (Liu et al., 2015; Maity et al., 2018; Gale et al., 2019; Craig et al., 2021; Maity and Ciezobka, 2021; Debotyam and Jordan, 2021). Relevant studies based on core well analysis of proppant distribution in China are yet to be reported. To address the problem of volume fracturing in the Mahu conglomerate reservoir, this paper drills through core wells, obtains full-diameter cores of long well sections, collects follow-up rock chips and drilling mud, cleans and screens them, establishes a proppant identification method, obtains the spatial distribution of proppant in the whole well section, and then evaluates the proppant transport and placement effect. The research in this paper helps to optimize the volumetric fracturing parameters of the Mahu conglomerate reservoir and improve the fracturing effect.
2 Mine core extraction program
The conglomerate hydraulic fracturing test site (CHFTS) in the Mahu oil field of the Junggar Basin, with 12 horizontal wells deployed, developed two sets of T1b3 and T1b2 formations, seven wells in layer T1b3 with 100 m spacing and five wells in layer T1b2 with 150m spacing, drilled from north to south in a three-dimensional staggered deployment (see Figure 1). Large-slope coring wells were used to obtain 4-inch-diameter intact cores near the production wells in the T1b3 and T1b2 formations (Su et al., 2022).
Figure 1 shows the trajectory of the coring well with the adjacent producing horizontal wells. The coring well is shown as a blue straight line in Figure 1B. At T1b3 located between two fracturing wells H8 and H9, close to the middle of the horizontal section of the horizontal well laterally, the coring section is 18.6 m east of the nearest fracturing section of H8, sloping downward until the bottom of H9 at a vertical distance of 14.6 m. At T1b2 close to H4, the horizontal distance from the fracturing section of H4 ranges from 20.3 to 51.8 m. The slant well recovered a total of approximately 323.13 m of core, of which 293.71 m of a total of 48 cores were used for the study, with each core barrel measuring approximately 6.5 m. Cores 1 to 31 barrels were located at T1b3, approximately 194.95m, and cores 32 to 48 barrels were located at T1b2, approximately 98.76 m. During drilling operations, rock chip samples were collected every 2 m, during which mud and drill chip samples were collected to obtain additional proppant distribution and lithology information along the path of the core interval.
3 Proppant collection and identification methods
After cleaning and screening the rock chips and drilling mud, we establish the identification method of proppant in rock chips and mud, identify the samples obtained, obtain the spatial location and distribution of proppant in the whole well section, and then evaluate the effect of proppant transport and placement.
3.1 Collection of proppant
During the core well’s drilling process, each section’s sampling length was taken at a depth of 2 m. The returned drilling rock chips and mud were sampled. The location of the well depth was recorded and collected for preservation, in which approximately 300 g of rock chips and 5 L of drilling mud were taken from each section. After the rock chips were dried entirely, each rock chip and mud sample was weighed and recorded separately. The particles in the mud samples were separated using an 80-mesh stainless steel screen for the following experimental work.
For rock chip samples, since they contain more soil, they are initially cleaned by pouring the rock chip sample into clean water, filtering out the upper liquid, and repeating this process five to six times until most of the soil in the rock chip sample is rinsed away; then an oil cleaner is added and the rock chip samples are rinsed repeatedly for 10 min to remove the oily substances (crude oil and oily mud) attached to the particles, followed by which the rock chip particles are repeatedly rinsed with clean water for 10 min. In the next step, the cleaned rock chip particles are sieved by combining 20 mesh, 40 mesh, and 70 mesh screens from top to bottom, using this screen combination to screen the cleaned rock chip samples to produce 20/40 mesh particles and 40/70 mesh particles, which correspond to the 20/40 mesh proppant and 40/70 mesh proppant used in the fracturing site. After the screening was completed, the screened suspected proppant particles were individually placed in Petri dishes for air drying.
For the slurry samples, the granules were separated from the slurry using an 80-mesh screen. Since the particles in the slurry contained less soil, the particles were poured directly into a reagent bottle with an oil cleaner and rinsed repeatedly for 10 min to remove the oily substances attached to the particles, followed by repeated rinsing of the particles with water for 10 min. The cleaned granules were also screened and air-dried using a combination of 20 mesh, 40 mesh, and 70 mesh sieves. The suspected proppant pellets were weighed accurately and recorded after thorough air-drying using a high-precision electronic balance (0.001 g accuracy) and recorded.
3.2 Identification of proppant
The identification of proppant particles is done by using a high-resolution transparent imaging observation method. This method uses a low-magnification body microscope to observe and analyze the sample particles. When needed, the sample can be photographed through the electronic eyepiece to establish the identification of the proppant identification method; this method has the advantages of low cost and ease of operation, and at the same time, it can observe a more significant amount of samples to better reflect the sample, which is the real situation of the proportion of proppant in the particles. The nine-point sampling method was used to sample the cleaned and air-dried pellet samples, i.e., the sample was divided into nine areas using a nine-grid grid, and then a portion of the sample was taken out in each area with a sampling spoon, followed by a half-portion method until the final observed sample size was controlled at approximately 0.1 g.
In order to identify the proppant in the drilling chips and mud, the proppant particles and formation mineral particles used in the fracturing site were observed by a continuous zoom body microscope. The lower light source (transmitted light) was used to observe the transparency of the particles and the upper light source (reflected light) was used to observe the color of the particles. Figure 2 shows the photographed images of standard proppant particles and formation mineral particles under the irradiation of a lower light source (transmitted light) and an upper light source (reflected light), respectively. It can be seen that most of the proppants have good sphericity, and the ground mineral particles have poor sphericity and sharp angles; under transmitted light, the quartz proppant particles have good transmittance, high transparency, and fewer impurities, and the ground mineral particles have low transparency; under reflected light, the proppant particles have white color and certain glass luster, and the ground mineral particles show various colors, such as off-white, dark red, flesh red, and gray-black, and does not have a luster and rough surface.
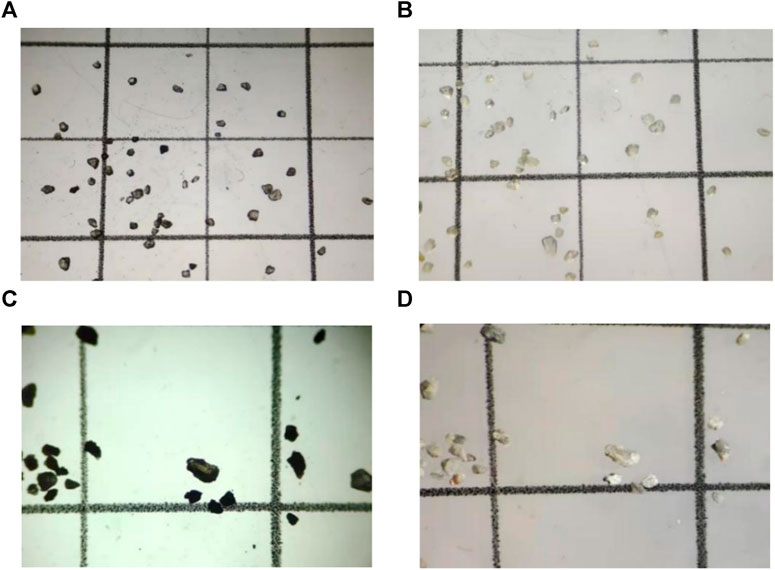
FIGURE 2. Image of particles. (A) Proppant particles under transmitted light, (B) Proppant particles under reflected light, (C) Formation mineral particles under transmitted light, and (D) Formation mineral particles under reflected light.
Combining the different characteristics of proppant particles and stratigraphic mineral particles under transmitted and reflected light, we decided to establish the identification criteria of proppant particles from the three main aspects of roundness, transparency, and color, and then combined with factors such as surface luster and roughness of the particles, we determined whether a particle is a proppant particle.
3.2.1 Degree of sphericity
Compared with the stratigraphic mineral particles, the proppant particles have better roundness. In this regard, the more mature Hough circle transform (CHT) was used to analyze the roundness of the sample particles to screen the suspected proppant particles from their appearance.
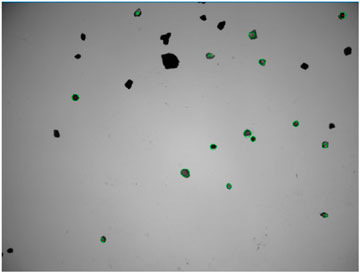
The Hough transform is a feature detection technique used to identify the features found in an object. Given an object and the kind of shape to be identified, the algorithm performs voting in the parameter space to determine the object’s shape, which is determined by the local maximum in the accumulation space. The Hoff circle transformation program is written for proppant particle identification, and the parameters are adjusted to make it more suitable for proppant identification. The result of the Hoff circle transformation is shown in Figure 3, where the particles marked with green circles have a better roundness and are suspected proppant particles.
3.2.2 Transparency
The most noticeable feature of the proppant particles is that they have a certain transparency in the case of transparent imaging. In contrast, the transparency of other mineral particles is very low. Hence, the level of transparency is an important indicator to identify whether the particles are proppant.
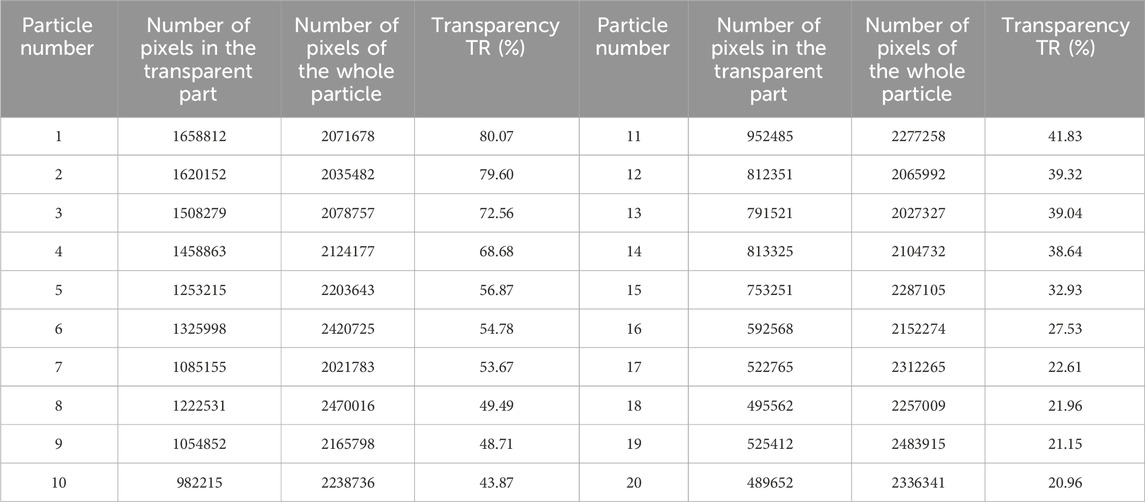
In order to quantify the transparency of the particles, the obtained images were processed using machine vision processing software, using a color range selector, taking the color sample as the color of the background illumination, with the tolerance set to 130, and defining the percentage of the highlighted transparent part of the particles to the whole particles as the transparency TR. Taking two types of proppant A and B and a stratum mineral particle C as an example, the relevant data of the obtained particles A, B, and C are shown in Table 1. The transparency visualization picture is shown in Figure 4; the white highlighted part is the transparent part of the particle, and the TR value can be obtained by calculating the percentage of the number of pixels of the highlighted part to the number of pixels of the whole particle.

FIGURE 4. Transparency visualization of (A) Proppant A, (B) Proppant B, and (C) formation mineral particles C.
By comparing the transparency of the above three particles A, B, and C, we found that the transparency of non-proppant particles is generally very low. Particle C only has 0.26% transparency, and then 20 proppant particles were analyzed for transparency testing; as shown in Table 2, the larger the number of particle pixels present the larger the particle size, and from the results, we can see that the larger the particle size of proppant the lower its transparency generally, but it still maintains a certain degree of transparency. After analyzing several quartz proppant particles, it was decided that the threshold value of transparency TR would be set as 20%.
3.2.3 Color tone
In addition to the transparency TR, proppant grains have a higher blue and a lower red hue in the photographed images. In comparison, other mineral grains, such as feldspar and shale grains, have a higher red hue, and their blue hue is relatively low. At the same time, the high iron content in the stratigraphy makes it possible to identify quartz proppants and stratigraphic natural quartz grains due to the high transparency of many stratigraphic natural quartz grains, which although containing more iron, have a distinct red color overall. In order to quantify this identification criterion, based on the identification method of chromatography of the identified object, the target particles are processed and analyzed using image processing tools to remove the background interference parts other than the particles. The red scale peak Rf and blue color scale peak Bf of the target particles are obtained using a color scale histogram (Figure 5). The red-blue difference RBD is defined to reflect the size of the red-blue color difference of the target particles. A larger RCD indicates a reddish tone of the particle. In comparison, a smaller RCD indicates a blue tone of the particle.

FIGURE 5. Particle color and color scale histogram of (A) proppant particle and (B) formation mineral particle.
Therefore, proppant particles’ RCD is lower while other particles’ RCD is higher. After calculating and comparing the RBD values of multiple proppant particles and other mineral particles, the final determination threshold is set at 30, i.e., when the RBD value of a particle is greater than 30, it is determined as other mineral particles. In summary, the RBD value can more accurately exclude some iron-rich natural quartz sand in the stratum.
3.2.4 Other factors
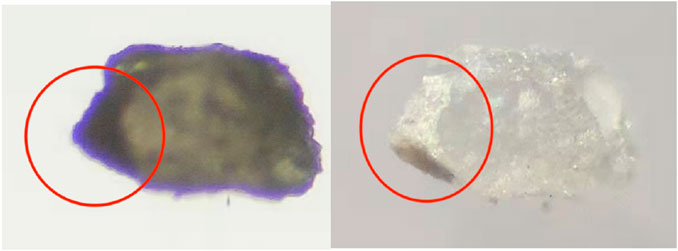
In addition to iron-rich red natural quartz grains, the stratum contains some translucent mineral grains similar to proppant grains in transparency and color. In order to distinguish these translucent mineral grains, the following conclusions were drawn based on extensive observation and analysis: (1) The particle size of translucent mineral grains is not uniform, and some even exceed 1,000 μm. (2) The translucent mineral grains have more surface angles of translucent mineral particles, and the roundness is generally poor. (3) Translucent mineral particles are mostly flaked off from large particles and are thin flakes. (4) Translucent stratigraphic particles contain more iron and other elements, showing red, yellow, and other colors. (5) Natural translucent particles of strata are often accompanied by other opaque minerals, which can be used as an essential sign to distinguish natural translucent particles from proppant (Figure 6).
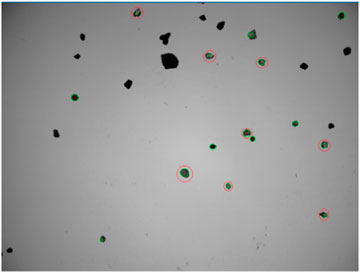
To summarize, in the identification of proppant particles, the sample particle images were first processed using the Hoff circle transformation program to identify particles with better roundness, and then the transparency TR and the red-blue difference RBD of the particles were observed to select particles with TR > 20% and RBD > 30. These three factors were considered comprehensively, with transparency as the primary consideration, and then the surface of the particle was combined with when the proppant particles were identified; the particle size was measured using the scale on the microscope to know whether the proppant was a 20/40 mesh (particle size of 850–425 um) proppant or a 40/70 mesh (particle size of 425–212 um) proppant. After the above steps, the proppant is judged together. After the above steps of the comprehensive identification evaluation, the final identification results are shown in Figure 7, where the particles circled in red are the proppant particles.
4 Analysis of proppant distribution results
4.1 Mineral particle content distribution with well depth
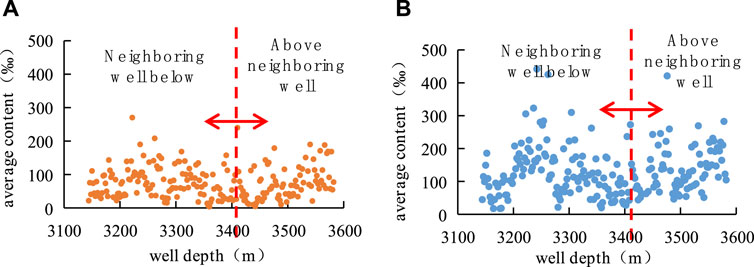
Based on the experimental results of sieving and washing rock chips with proppant in mud, the distribution of mineral particles from sieving and washing was analyzed. The content of 20/40 mesh particles in the rock chip ranged from 5‰ to 280‰, with a more uniform distribution and an average content of 76.94‰. The content of 40/70 mesh particles ranged from 10‰ to 450‰, peaking at a well depth of approximately 3240 m. Overall, the content of 40/70 mesh particles is also higher at the location with a higher content of 20/40 mesh particles, and the content of 40/70 mesh particles is higher than that of 20/40 mesh particles (Figure 8).
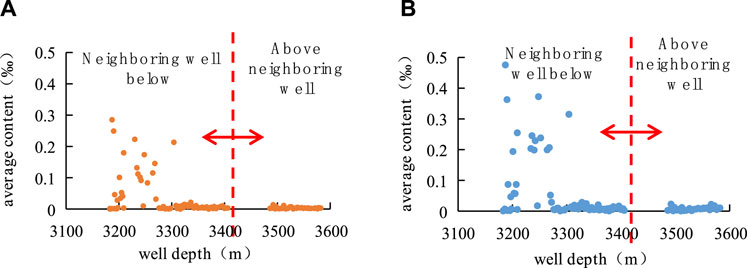
The content distribution of 20/40 mesh and 40/70 mesh particles in the mud is shown in Figure 9. The content of 20/40 mesh particles in the mud ranges from 0‰ to 0.27‰. The content of 40/70 mesh particles ranges from 0‰ to 1.4‰, concentrated and mainly distributed between the well depth of 3185m and 3270 m in line with 20/40 mesh and located at the side and bottom of the neighboring well H8. The peak occurs at approximately 3230m, and the content is very small after the well depth exceeds 3270 m. Overall, the average content of 40/70 particles is 0.0568‰, which is one time higher than the average 20/40 mesh particles.
4.2 20/40 mesh proppant content distribution with well depth
Figure 10 shows the distribution of 20/40 mesh proppant content with well depth in T1b3 and T1b2 formations, respectively; from the figure, it can be seen that the peak content of 20/40 mesh proppant in T1b2 formation is lower than that in T1b3 formation, with 46 grains/g, while that in T1b3 formation is 134 grains/g. The reason is that in the T1b2 formation, the core well is located above the fracture well H4 and the proppant settles below the fracture, and the core well gets relatively less proppant. In the T1b3 formation, the proppant content is higher due to the depth near the right side of fracture well H8 and the left side of fracture well H9.
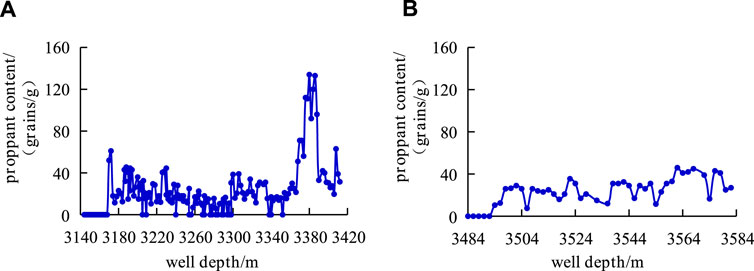
FIGURE 10. The relationship between proppant content and well depth in 20/40 mesh (A) T1b3 formation and (B) T1b2 formation.
From the point of particle content, the particle content of the cuttings sifted out is approximately 1,000 times that of the mud. It shows that the distribution of mineral particles from the cuttings is more representative. From the distribution of mineral particles in the cuttings screening, the distribution of mineral particles along the core well is relatively uniform, and there is no peak value. The main reason is that when the core well is drilled in the target layer, they are basically in the reservoir, and the reservoir rocks are lacustrine sedimentary in the same period. Hence, the distribution of rock mineral particles is not different. In contrast, there were spikes in proppant distribution along the entire wellbore. Although the migration distance of the proppant is shorter than the results of laboratory transport experiments, the distribution law is consistent with the current theoretical understanding.
4.3 40/70 mesh proppant content distribution with well depth
Figure 11 shows the distribution of 40/70-mesh proppant content with well depth in the T1b3 and T1b2 formation, respectively. The peak 40/70-mesh proppant content is lower in the B2 formation compared to T1b3, at 435 grains/g, while it is 789 grains/g in the T1b3 formation. At depths near the right side of frac well H8 (3189 m), left side of H9 (3369 m), and left side of H4 (3560 m), three peaks were observed. Overall, the content of 40/70 mesh proppant is significantly higher than that of 20/40 mesh proppant, approximately 10 times higher because the 40/70 mesh proppant has a smaller particle size and travels farther in the fracture, so the core well can capture more proppant.
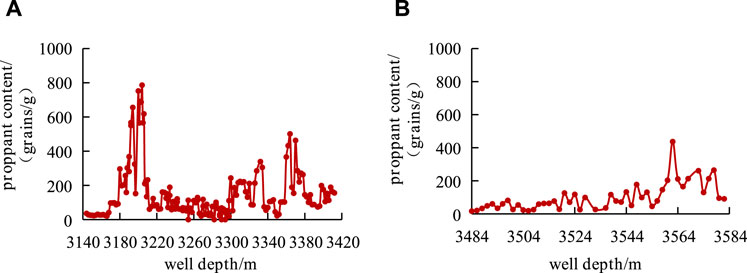
FIGURE 11. The relationship between proppant content and well depth in 40/70 mesh (A)T1b3 formation and (B) T1b2 formation.
4.4 The relationship between proppant content and horizontal distance of neighboring wells
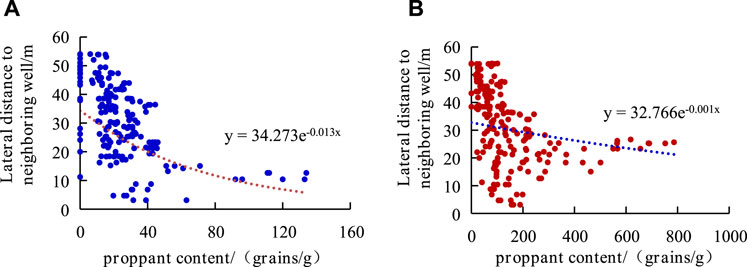
Figure 12 shows the relationship between the proppant content of different mesh sizes and the horizontal distance between the coring well and the neighboring fracturing well, where the vertical coordinate is the horizontal distance of this coring location from the neighboring fracturing well. The horizontal coordinate is the proppant content (unit: grain/g). As shown in the figure, the content of 20/40 mesh proppant with large particle size reached its peak at the position 10–12 m away from the adjacent well, indicating that a large number of 20/40 mesh proppant migrated horizontally in the hydraulic fracture by approximately 10 m. At the same time, the proppant content and the horizontal distance from the adjacent well showed an exponential function relationship. The function base was e−0.013, and the proppant content increased with the decrease in the horizontal distance from the adjacent well. The smaller 40/70 mesh proppant reached its peak value approximately 23–25 m away from the adjacent well, indicating that a large number of 40/70 mesh proppant migrated approximately 23 m horizontally in the hydraulic fracture. The exponential function base change was e−0.001.
4.5 The relationship between proppant content and longitudinal distance of neighboring wells
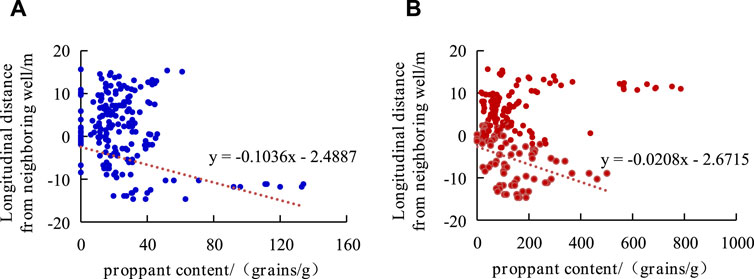
Figure 13 shows the relationship between the proppant content of different mesh sizes and the vertical distance between the coring and fracturing wells, where the vertical coordinate is the vertical distance of this coring location from the neighboring fracturing wells (where positive values are above the neighboring wells and negative values are below the neighboring wells). The horizontal coordinate is the proppant content (unit: grain/g). Due to the influence of gravity settlement, the 20/40 mesh proppant with large particle size was mainly concentrated at the vertical distance of 12 m from the adjacent well. The proppant content showed a negative linear relationship with the vertical distance of the adjacent well. The 40/70 proppant has a larger longitudinal placement area than the 20/40 proppant. There are two peaks of proppant content in the 40/70 mesh, approximately 10 m above and approximately 10 m below the adjacent well. The overall longitudinal coverage reaches 20 m, indicating that the smaller diameter proppant is conducive to placement in the fracture. The two peak functions are roughly linear and negatively correlated, but they are significantly different.
5 Conclusion
This paper establishes the proppant identification method for the volume fracturing of horizontal wells in the Mahu conglomerate. It analyzes the spatial distribution characteristics of proppant by drilling core well sampling, rock chip, and drilling mud cleaning and screening, and the main conclusions are as follows.
(1) A proppant identification method was established, that is, compared with the formation of mineral particles, the proppant has good sphericity, transparency TR>20%, and red-blue difference RBD > 30. Combined with the surface roughness, luster, and associated minerals, the particle can be evaluated as a proppant.
(2) By sieving mineral particles in rock chips and slurry, the 40/70 mesh proppant content is significantly higher than the 20/40 mesh proppant content. The mass ratio of 20/40 mesh proppant content in rock chips ranges from 5‰ to 280‰, and the mass ratio of 40/70 mesh proppant content ranges from 10‰ to 450‰; the mass ratio of 20/40 proppant content in slurry ranges from 0‰ to 0.27‰, and the mass ratio of 40/70 mesh proppant content ranges from 0‰ to 1.4‰. The quality ratio of 20/40 proppant content in slurry is between 0‰ and 0.27‰, and 40/70 proppant content is between 0 and 1.4‰.
(3) The content of the 40/70 mesh proppant in the fracture is significantly higher than that of the 20/40 mesh proppant, which transports farther in the fracture and has a more extensive spreading range in the longitudinal direction. Horizontally, 20/40 mesh proppant was transported approximately 10 m horizontally in the hydraulic fracture and 40/70 mesh at approximately 23m; vertically, 20/40 mesh proppant was concentrated at a vertical distance of 12 m from the lower part of the neighboring well, and 40/70 mesh proppant content was concentrated approximately 10 m above the neighboring well and approximately 10 m below the neighboring well.
Data availability statement
The raw data supporting the conclusion of this article will be made available by the authors, without undue reservation.
Author contributions
TW: Writing–original draft. JZ: Writing–original draft. YX: Writing–original draft. WT: Writing–original draft. SY: Writing–review and editing. YY: Writing–original draft. SS: Writing–original draft. YL: Writing–original draft.
Funding
The author(s) declare financial support was received for the research, authorship, and/or publication of this article. The author(s) disclosed receipt of the following financial support for the research, authorship, and/or publication of this article: The authors would like to acknowledge the financial support of the China National Petroleum Corporation’s major research project “Xinjiang Oilfield Shale Oil/Tight Oil and Gas Volume Transformation Technology Enhancement and Field Test” (2021CGCGZ006). Crude oil production capacity scheme and tracking research project of Xinjiang Oilfield New area.
Conflict of interest
Authors TW, JZ, WT, YY, SS, and YL were employed by Exploration and Development Project Department of Mahu Area of Xinjiang Oilfield Company. Author YX was employed by Research Institute of Engineering Technique Xinjiang Oilfield Company. Author SY was employed by China University of Petroleum (Beijing).
Publisher’s note
All claims expressed in this article are solely those of the authors and do not necessarily represent those of their affiliated organizations, or those of the publisher, the editors and the reviewers. Any product that may be evaluated in this article, or claim that may be made by its manufacturer, is not guaranteed or endorsed by the publisher.
References
Alotaibi, M. A., and Miskimins, J. L. (2018). Slickwater proppant transport in hydraulic fractures: new experimental findings and scalable correlation. SPE Prod. Operations, Soc. Petroleum Eng. 33 (02), 164–178. doi:10.2118/174828-pa
Craig, D. P., Hoang, T., Li, H., Magness, J., and Ginn, C. (2021). “Defining hydraulic fracture geometry using image logs recorded in the laterals of horizontal infill wells,” in Presented at the Unconventional Resources Technology Conference (URTeC), Houston, Texas.
Dayan, A., Stracener, S. M., and Clark, P. E. (2009). Proppant transport in slick-water fracturing of shale-gas formations. SPE125068.
Debotyam, M., and Jordan, C. (2021). A systematic interpretation of subsurface proppant concentration from drilling mud returns: case study from hydraulic fracturing test site (HFTS-2) in Delaware basin. Gas Technology Institute.
Gale, J. F. W., Elliott, S. J., Li, J. Z., and Laubach, S. E., 2019, Natural fracture characterization in the wolfcamp formation at the hydraulic fracture test site (HFTS), midland basin, Texas. URTeC 644 presented at URTeC, Denver, CO 22-24th July, 2019.
Guo, T. K., Gong, Y. Z., Liu, X. Q., Wang, Z. L., Xu, J. C., Sheng, M., et al. (2022). Numerical simulation of proppant transport and placement law in complex fractures. J. China Univ. Petroleum Nat. Sci. Ed. 46 (03), 89–95.
He, S., Qin, Q. R., Li, H., and Wang, S. L. (2022b). Deformation differences in complex structural areas in the southern sichuan basin and its influence on shale gas preservation: a case study of changning and luzhou areas. Front. Earth Sci. 9, 818155. doi:10.3389/feart.2021.818534
He, S., Qin, Q. R., Li, H., and Zhao, S. X. (2022a). Geological characteristics of deep shale gas in the silurian longmaxi formation in the southern sichuan basin, China. Front. Earth Sci. 9, 818543. doi:10.3389/feart.2021.818155
Huang, H., Babadagli, T., Andy Li, H. Z., Develi, K., and Wei, G. J. (2019). Effect of injection parameters on proppant transport in rough vertical fractures: an experimental analysis on visual models. J. Petroleum Sci. Eng. 180, 380–395. doi:10.1016/j.petrol.2019.05.009
Izadi, G., Hoeink, T., Gruz, L., Hughes, B., and Copeland, D. (2017). Numerical modeling of proppant transport in complex hydraulic fracture propagation[C]. SPE187355MS.
Jiang, T. X., Bian, X. B., Hou, L., Huang, H., Zhang, C., Li, H. Z., et al. (2021). Experiment on proppant transport and placement behavior in rough fractures. J. China Univ. Petroleum Nat. Sci. Ed. 45 (06), 95–101.
Kou, R., Moridis, G., and Blasingame, T. (2019). Bridging criteria and distribution correlation for proppant transport in primary and secondary fracture[R]. SPE 194319-MS,
Kumar, D., and Ghassemi, A. (2019). Modeling and analysis of proppant transport and deposition in hydraulic/natural fracture networks[C]. URTeC 243.
Li, H. (2022). Research progress on evaluation methods and factors influencing shale brittleness: a review. Energy Rep. 8, 4344–4358. doi:10.1016/j.egyr.2022.03.120
Liu, Y. Z., Li, Y. M., Li, Q., Bao, J., Hao, D. K., Zhao, Z. W., Song, D. X., et al. (2015). Micro-to nanoscale morphologies and chemical components of soils investigated by SEM-EDS for forensic science. J. Chem. 2015, 1–5. doi:10.1155/2015/734560
Maity, D., and Ciezobka, J. (2021). “Digital fracture characterization at hydraulic fracturing test site (HFTS – midland): fracture clustering, stress effects and lithologic controls,” in Presented at the Hydraulic Fracturing Technology Conference (HFTC), The Woodlands, Texas. SPE-204174-MS.
Maity, D., Ciezobka, J., and Eisenlord, S. (2018). “Assessment of in-situ proppant placement in SRV using through-fracture core sampling at HFTS,” in Presented at the Unconventional Resources Technology Conference (URTeC), Houston, Texas. doi:10.15530/ertec-2018-2902364
Su, T., Wang, J. R., Xie, Z. S., Kang, K. L., Cheng, P. F., and Duan, Z. G. (2022). Application of conformal coring technology for horizontal wells in the Ma02 well. Xinjiang Oil Gas 18 (03), 60–64.
Wang, Y., Wang, Y. J., Ma, N. L., Wang, Y. Z., Li, M. I., and Liu, Y. (2022). Optimization design of anti-slant drilling tool combination in Mahu area of Junggar Basin. Xinjiang Oil Gas 18 (03), 44–53.
Xu, C. Y., Zhang, H. L., Kang, Y. I., Zhang, J. Y., Bai, Y. R., and Zhang, J. (2022). Physical plugging of lost circulation fractures at microscopic level. Fuel 317, 123477. doi:10.1016/j.fuel.2022.123477
Xu, C. Y., Zhang, H. L., She, J. P., Jiang, G. B., Peng, C., and You, Z. J. (2023). Experimental study on fracture plugging effect of irregular-shaped lost circulation materials. Energy 276, 127544. doi:10.1016/j.energy.2023.127544
Keywords: Mahu conglomerate, mine coring, proppant identification, proppant migrates, proppant distribution
Citation: Wang T, Zhang J, Xiang Y, Tang W, Yin S, Ye Y, Shi S and Li Y (2024) Proppant distribution characteristics based on the coring well analysis. Front. Energy Res. 12:1324005. doi: 10.3389/fenrg.2024.1324005
Received: 19 October 2023; Accepted: 12 January 2024;
Published: 07 February 2024.
Edited by:
Chengyuan Xu, Southwest Petroleum University, ChinaReviewed by:
Hu Guo, China University of Petroleum, Beijing, ChinaHu Li, Southwest Petroleum University, China
Copyright © 2024 Wang, Zhang, Xiang, Tang, Yin, Ye, Shi and Li. This is an open-access article distributed under the terms of the Creative Commons Attribution License (CC BY). The use, distribution or reproduction in other forums is permitted, provided the original author(s) and the copyright owner(s) are credited and that the original publication in this journal is cited, in accordance with accepted academic practice. No use, distribution or reproduction is permitted which does not comply with these terms.
*Correspondence: Tao Wang, MjI0NjkwNDM1MEBxcS5jb20=
 Tao Wang
 Jizhuo Zhang1
