 Feng Xi
95% of researchers rate our articles as excellent or good
Learn more about the work of our research integrity team to safeguard the quality of each article we publish.
Find out more
ORIGINAL RESEARCH article
Front. Energy Res. , 22 February 2024
Sec. Sustainable Energy Systems
Volume 12 - 2024 | https://doi.org/10.3389/fenrg.2024.1321891
This article is part of the Research Topic Sustainable Transition for Urban Housing and Community View all 6 articles
This study examines the impact of urban management on the efficiency of regional innovation in China’s manufacturing industry, with a specific focus on modern sustainable energy. The research takes into consideration the regional diversity in innovation development across China’s three major regions and integrates common Frontier theory with the MSBM model. By employing a non-radial distance function approach, this study develops the MMSBMP model, incorporating various improved methods proposed by researchers. The Luenberger index methodology is utilized to assess the innovation efficiency of the national manufacturing industry from 2017 to 2021, enabling the identification of efficiency losses. The findings highlight significant disparities and opportunities for enhancing innovation efficiency across the three major regions, both at the common Frontier and the group Frontier. However, caution is advised due to the potential overestimation of regional Frontier efficiency values resulting from variations in technical reference datasets. Analysis of the Total Growth Rate (TGR) values reveals distinct development characteristics among the regions, with the eastern region exhibiting smaller extremes and the central and western regions displaying larger extremes. This comprehensive examination of China’s manufacturing industry emphasizes the influence of urban management. By investigating the consequences of urban management practices, this research provides insights into the relationship between urban development strategies and the performance, efficiency, and sustainable growth of the manufacturing industry. The study highlights the significance of urban management in shaping regional innovation efficiency and emphasizes the continual improvement of the industry’s innovation performance in the context of modern sustainable energy.
China’s manufacturing industry has played a central role in the country’s economic growth and transformation. In recent years, there has been a shift towards emphasizing the efficiency of regional innovation within the manufacturing sector, particularly regarding modern sustainable energy, as China strives for high-quality development and sustainability (Li et al., 2020; Wang and Feng, 2020; Yang and Leibold, 2020). Urban management, encompassing a range of policies and strategies aimed at creating a conducive environment for innovation, is a significant factor affecting innovation efficiency. Understanding the impact of urban management on regional innovation efficiency in China’s manufacturing industry is crucial for informed decision-making and policy development. This study seeks to examine the influence of urban management on the efficiency of regional innovation in China’s manufacturing industry, with a specific focus on modern sustainable energy (Xiao, 2016; Li et al., 2020; Wang and Feng, 2020; Yang and Leibold, 2020).
It recognizes the regional heterogeneity of innovation development across China’s three regions and employs a non-radial distance function approach to comprehensively evaluate innovation efficiency. The non-radial distance function approach allows for a simultaneous consideration of both input reduction and output increase, providing a more accurate measurement of efficiency (Wang, 2007; Zhang et al., 2016; Li et al., 2019). The development of China’s manufacturing industry has been a driving force behind its economic growth. To achieve high-quality development, understanding and improving regional innovation efficiency is crucial. Urban management plays a significant role in creating an environment conducive to innovation (Battese and Rao, 2002; ODonnell et al., 2008; Sharma and Thomas, 2008; Fritsch and Slavtchev, 2010). This study conducts a comparative analysis of regional innovation efficiency in China’s manufacturing industry, focusing on the consequences of urban management. By considering regional heterogeneity and employing the non-radial distance function method, this research provides a comprehensive evaluation of innovation efficiency, considering both input reduction and output increase simultaneously (Gayosa and Cabanda, 2014; Zou and Zhu, 2020; Feng et al., 2022). The results of this study contribute to enhancing our understanding of the role of urban management in promoting regional innovation efficiency in China’s manufacturing industry. By incorporating the non-radial distance function method, this study aims to capture the intricate dynamics and variations in innovation performance among different regions. Additionally, the research integrates common Frontier theory with the Malmquist-DEA-Slacks-Based Measure (MSBM) model and develops the Modified Malmquist-DEA-Slacks-Based Measure-Panel (MMSBMP) model. This methodological fusion facilitates a comprehensive analysis of innovation efficiency and its correlation with urban management (Zou and Zhu, 2020; Zou et al., 2022; Hou et al., 2023). The study employs the Luenberger index methodology to assess the innovation efficiency of China’s manufacturing industry within a specific time frame, enabling a differentiated evaluation of efficiency and identification of potential sources of efficiency losses. Through an examination of the impacts of urban management on innovation efficiency, the research aims to provide valuable insights for policymakers and stakeholders, supporting the formulation of effective strategies to enhance regional innovation capabilities (Tone, 2001; Zou et al., 2022; Hou et al., 2023). This comparative study aims to provide a comprehensive understanding of the regional innovation efficiency within China’s manufacturing industry, with a particular focus on the role of urban management in facilitating innovation. The findings from this research will contribute to the ongoing initiatives aimed at promoting high-quality development and enhancing the overall performance of China’s manufacturing sector. It is essential to note that fostering innovation-driven growth is a steadfast value pursued by the Chinese population in advancing high-quality economic development in the new era. Moreover, local governments collaborate to establish regional competitive advantages in support of innovation and economic progress (Farrell, 1957; Wu, 2006; Sharp et al., 2007; Hang et al., 2015; Li et al., 2023).
In 2021, industrial enterprises in China witnessed significant increases in spending on new product development and new product sales revenue. However, the regional manufacturing innovation gap continues to widen due to insufficient resources, low innovation efficiency in core technologies, and constraints imposed by financialization. It is crucial to scientifically evaluate the innovation efficiency, compare regional differences, and optimize resource allocation for high-quality development (Battese and Rao, 2002; Wang, 2007; Xiao, 2016; Zhang et al., 2016; Li et al., 2019; Wang and Feng, 2020). Many researchers have increasingly used Data Envelopment Analysis (DEA) to measure manufacturing innovation efficiency, both domestically and internationally. Various studies have employed DEA models to examine regional innovation efficiency in China and have provided valuable insights and policy recommendations for enhancing efficiency and reducing disparities (Gayosa and Cabanda, 2014; Zou and Zhu, 2020; Feng et al., 2022; Zou et al., 2022; Hou et al., 2023). Nevertheless, the existing body of literature that evaluates manufacturing innovation efficiency often neglects the importance of individual input or output indicators in the measurement process and fails to account for negative values associated with these indicators. As a result, scholars have made efforts to address these limitations., Tone (2001) proposed the Weighted Slacks-Based Measure (WSBM) model, which assigns varying weights to each input-output indicator while ensuring that the effective efficiency values of Decision-Making Units (DMUs) remain unaffected. Additionally, Sharp et al. (2007) introduced the Modified Slacks-Based Measure (MSBM) model, in which the objective function uses the extreme values of the input-output indicators as the denominator to reduce the average improvement ratio. This modification allows for the inclusion of negative values in each indicator. These advancements in methodology aim to enhance the accuracy and comprehensiveness of manufacturing innovation efficiency evaluation.
Building upon these advancements, this paper extends the research by combining common Frontier theory with the weighted MSBM model to construct the MMSBMP model. By fully considering the heterogeneity of the three major regions, this study aims to trace the sources of efficiency loss in innovation. Furthermore, a differentiated analysis of domestic manufacturing industry innovation efficiency from 2017 to 2021 is conducted to identify the causes of efficiency loss and provide region-specific calculation and decision-making information. Given the potential presence of negative values in production efficiency, the Luenberger index is adopted instead of the Malmquist index in this paper. This study focuses on the influence of urban management on regional innovation efficiency in China’s manufacturing industry, with a specific emphasis on modern sustainable energy. While the study provides valuable insights, there are several research gaps that need further exploration. Firstly, there is a need for a deeper examination of the specific urban management policies, strategies, and practices that affect innovation efficiency and the mechanisms through which they operate. Additionally, the study could delve more into the unique challenges and opportunities related to sustainable energy innovation within the manufacturing industry and how urban management practices impact this area. A more comprehensive analysis of efficiency losses, considering factors such as technological barriers, resource allocation, and policy implementation, is also necessary. Furthermore, exploring the regional heterogeneity in innovation development across China’s major regions and tailoring urban management practices to address regional disparities would enhance understanding. Lastly, incorporating comparative analysis with international cases would provide insights into best practices from other regions that have successfully fostered efficient innovation ecosystems. Addressing these research gaps would contribute to a more comprehensive understanding of the relationship between urban management and regional innovation efficiency, enabling effective strategies for sustainable growth in China’s manufacturing industry.
This study aims to investigate the regional innovation efficiency of China’s manufacturing industry by integrating common Frontier theory with the weighted MSBM model and constructing the MMSBMP model. It addresses the limitations of existing literature by considering the significance of individual input or output indicators and incorporating negative values. The aim of this study is to conduct a thorough analysis of innovation efficiency, pinpoint the factors leading to efficiency loss, and contribute to a deeper understanding of regional variations by examining the three major regions of China. The research introduces novelty by integrating these models, resulting in a more precise evaluation of efficiency. The application of the Luenberger index and the region-specific analysis further enhances the originality of the study. The results of this research have important implications for policymakers and stakeholders who are dedicated to enhancing regional manufacturing innovation efficiency and mitigating disparities.
Each region in China possesses unique technological characteristics, which include variations in the industrial base, technology level, and industrial structure. Recognizing regional heterogeneity is crucial when studying innovation efficiency and its measurement within Chinese industrial firms as shown in Figure 1. Previous researchers, such as Zou and Zhu, (2020), Zou et al. (2022), and Li et al. (2023), have taken into account the technological frontiers of different regions when assessing innovation efficiency and regional disparities. In this study, we adopt the nonparametric common Frontier model proposed by ODonnell et al. (2008) to examine innovation efficiency and regional differences. By doing so, we aim to mitigate potential biases in estimating production frontiers and innovation efficiency. Consequently, the method employed in this paper is the function-based approach. Let us assume that the DMUs v (
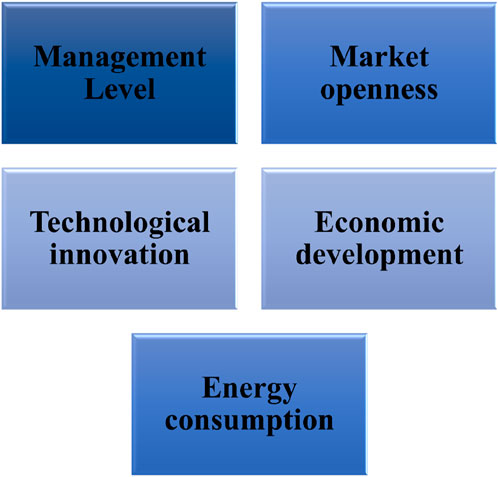
FIGURE 1. Varied enhancement trajectories of carbon emission efficiency in China’s provincial construction industry: An approach using fuzzy-set qualitative comparative analysis.
This study proposes three hypotheses. First, it posits that urban management practices have a significant impact on regional innovation efficiency in China’s manufacturing industry, specifically in the realm of modern sustainable energy. Second, it suggests that there are notable disparities in innovation efficiency across different regions of China, which can be attributed to variations in urban management strategies and policies. Lastly, the study proposes that the integration of common Frontier theory with the weighted Modified Slacks-Based Measure (MSBM) model, through the development of the Modified Malmquist-DEA-Slacks-Based Measure-Panel (MMSBMP) model, offers a more accurate assessment of innovation efficiency and facilitates the identification of sources of efficiency loss in the manufacturing industry, with a particular focus on modern sustainable energy.
On this basis, the MMSBMP model is obtained by reference to and refinement of the non-radial function model in order to measure efficiency. Here is the formula:
According to Farrell, (1957), the distance function measures the efficiency of the inputs to the production sector. This results in the following relational and inefficiency equations of 1–8 for the efficiency of cluster innovation:
For variable payoffs at scale, accounting for the slack enhancement component and introducing Archimedes infinitesimals, the objective function for the innovation inefficiency of the ith unit of production in defined as follows:
Similarly, the objective function for the innovation efficiency at the common Frontier, the inefficiency value, and the innovation inefficiency of the jth unit of production with varying returns to scale can be expressed as follows:
An example of a convex Frontier function is shown in Figure 2, where all production units are aggregated into 3 regional Frontier samples, which subsequently form a common Frontier. The group Frontier is contained within the boundary of the common Frontier. The innovation efficiency of production units is given by the following relational equation:
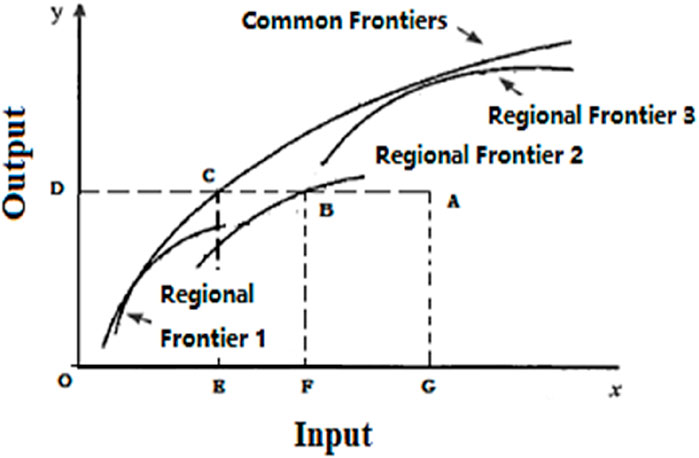
FIGURE 2. Common and regional Frontiers.
Figure 3 illustrates an innovative and tailored incentive mechanism specifically developed to effectively tackle the inherent conflicting tasks and management challenges encountered by thermal power generation enterprises. This mechanism aims to provide a structured framework that aligns the interests and objectives of various stakeholders within the industry, while simultaneously addressing the complex and multifaceted nature of thermal power generation operations. By implementing this incentive mechanism, the aim is to enhance overall performance, optimize resource allocation, promote sustainable practices, and foster a conducive environment for effective decision-making and management within the thermal power generation sector.
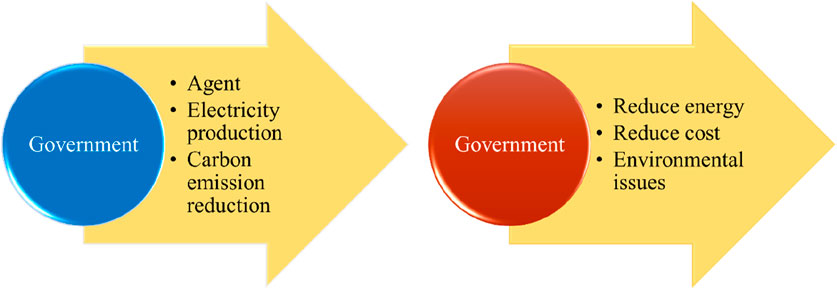
FIGURE 3. An incentive mechanism designed to address the conflicting tasks and management challenges faced by thermal power generation enterprises.
The Technical Gap Ratio (TGR) is the ratio of the innovation efficiency values of each unit of production at the two frontiers, reflecting the technology gap between the cluster Frontier and the common Frontier. It can be defined as:
The range of values of
For the purposes of this paper, the research sample consists of 31 provincial-level regions in China from 2017 to 2021, excluding Hong Kong, Macao and Taiwan for the time being, taking into account the accuracy factor of data acquisition1. With reference to the studies carried out by (Zou and Zhu, 2020; Zou et al., 2022), in this paper, we again divide the 31 provincial research subjects into three broad sample groups: eastern, central and western, taking into account the different technological frontiers that different regions face. The data sample includes the amount of R&D expenditure of industrial enterprises above the scale (ARDEIEAS), the price index of fixed asset investment (PIFAI), the full time equivalent of R & D personnel (FTERDP), the number of effective invention patents (NEIP), sales revenues of new products (SRNP) and the turnover of the technology market (TTM) and others from 2017 to 2021. The 2017 data are the data from the baseline period. All data in the sample are taken from the China Statistical Yearbook published by the National Bureau of Statistics and provincial statistical yearbooks for 2018 to 2023 or calculated from statistical data.
Figure 4 shows the scope of this academic study, a comprehensive dataset has been meticulously constructed to capture and encompass greenhouse gas (GHG) emissions directly associated with industrial processes. This dataset serves as a robust framework that systematically collects, organizes, and analyzes the emissions data emanating from various industrial activities. By establishing this dataset, researchers and policymakers gain access to a valuable resource that enables them to quantify, monitor, and evaluate the environmental impact of industrial processes in terms of GHG emissions. This framework facilitates a deeper understanding of the sources, trends, and patterns of GHG emissions within the industrial sector, thereby providing a solid foundation for evidence-based decision-making, policy formulation, and the implementation of targeted emission reduction strategies.
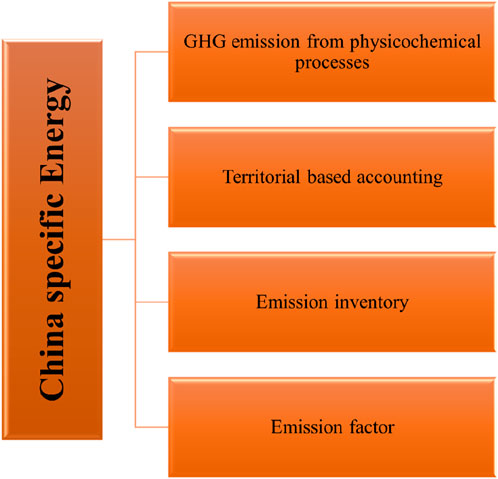
FIGURE 4. A dataset comprising greenhouse gas (GHG) emissions related to industrial processes has been established within the framework.
The construction of the GHG emissions dataset related to industrial processes involves a systematic and rigorous process. It begins with the identification and selection of relevant industries and sectors that contribute significantly to GHG emissions. This encompasses a wide range of industries, including but not limited to manufacturing, energy production, transportation, and agriculture. Once the industries and sectors are determined, data collection methodologies are employed to gather emissions data from various sources. These sources may include government reports, industry surveys, emissions inventories, and scientific literature. The collected data encompasses different types of GHGs, such as carbon dioxide (CO2), methane (CH4), nitrous oxide (N2O), and fluorinated gases. To ensure the accuracy and reliability of the dataset, quality control measures are implemented. This involves data validation, verification, and reconciliation to identify and address any inconsistencies or discrepancies. Data gaps are filled through estimation techniques or by referring to established emission factors and conversion methods. The dataset is then organized and structured in a consistent format, allowing for easy access, retrieval, and analysis. It may be stored in a centralized database or a data repository specific to the research project or academic institution. The dataset’s structure typically includes information such as industry sector, emissions source, GHG type, temporal coverage, and geographical location. Once the dataset is established, it becomes a valuable resource for researchers, policymakers, and other stakeholders. It provides a foundation for conducting detailed analyses and assessments of industrial GHG emissions, enabling the identification of emission hotspots, trends, and patterns. This information is crucial for developing effective mitigation strategies, setting emission reduction targets, and monitoring progress towards climate goals. Furthermore, the dataset can be utilized for modeling exercises, scenario analysis, and policy simulations to evaluate the potential impacts of different interventions and measures. It also serves as a benchmark for comparing emissions performance across industries, regions, and time periods, fostering transparency and accountability in addressing climate change.
Figure 5 shows an analysis that focuses on the evaluation of the efficiency of green technology innovation within China’s industrial sector. This evaluation is conducted through the utilization of correlation network analysis, which allows for a comprehensive examination of the interrelationships and connections between different factors related to green technology innovation. Also, Figure 5 shows valuable insights into the efficiency of these innovations and their impact on China’s industrial sector, ultimately contributing to a better understanding of the overall landscape of sustainable technological advancements in the country.
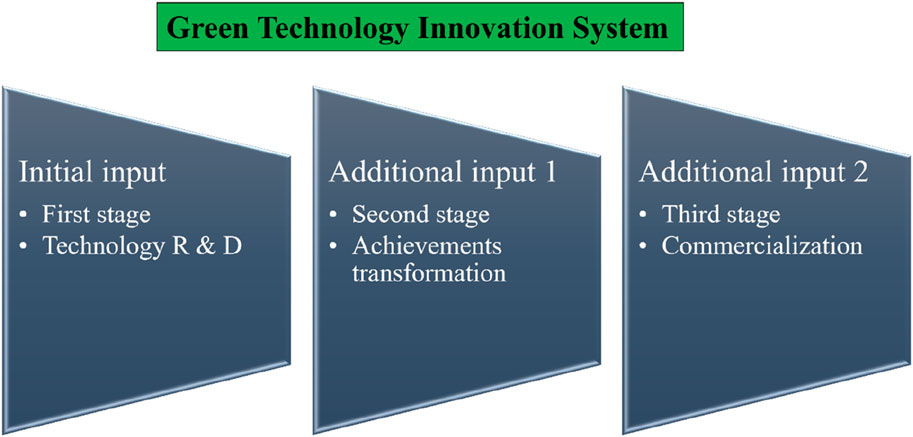
FIGURE 5. Examining the efficiency of green technology innovation in China’s industrial sector through correlation network analysis.
To construct the indicator system for measuring manufacturing innovation efficiency, this study adopts the Cobb-Douglas production function as a guiding framework. The initial step involves selecting economic variables, such as capital and labor, which are commonly used in existing research to facilitate comparisons with relevant literature. Specifically, regarding manufacturing capital inputs, the choice of variable indicators is influenced by prior studies. Wu, (2006) shows the time lag between inputs and outputs of technological innovation, indicating that R&D expenditure in the current year impacts subsequent innovation. Building upon this understanding, this paper draws upon the works of Zhang et al. (2016) and Zou and Zhu, (2020) and employs the annual capital stock of industrial firms above a certain scale (ACSIES) as a measure of the capital invested in manufacturing industry innovation. The measurement of ACSIES utilizes the perpetual inventory method:
In terms of labor inputs for manufacturing, this study takes into account previous research conducted (Zou and Zhu, 2020; Feng et al., 2022; Zou et al., 2022; Hou et al., 2023). Following their insights, we utilize the Full-Time Equivalent Research and Development Personnel (FTERDP) as an indicator of manpower investment in research and experimental development activities for industrial firms above a certain scale. When considering output variables for manufacturing innovation, the direct reflection of the current market value of innovations through patent application data is deemed insufficient. Additionally, researchers discovered a significant time lag in patent grant data. Given these factors, this paper employs the New-to-Existing Patent Ratio (NEIP) to represent the level of innovation in the current period. Scholars generally agree that the Share of Resources for New Products (SRNP) and Total Technological Milestones (TTM) are more appropriate indicators for assessing the current level of innovation in a region (Zou and Zhu, 2020; Zou et al., 2022). Thus, the output variables for manufacturing innovation in this study encompass indicators such as NEIP, SRNP, and TTM. Furthermore, all indicator data is adjusted to the base period level. In constructing the factor indicators using the non-radial distance function, this paper draws inspiration from the ideas presented by Li and Xu, (2018) and Wu and Lin, (2022). In line with their approaches, equal importance is given to both input and output indicators. Their weights are set at 1/2 respectively. Without a priori information, the weights for the various input-output indicators are averaged. The weight vector of input-output variables in this paper is
Table 1 shows a statistical overview of the input-output indicators for the three major regions of China from 2017 to 2020.
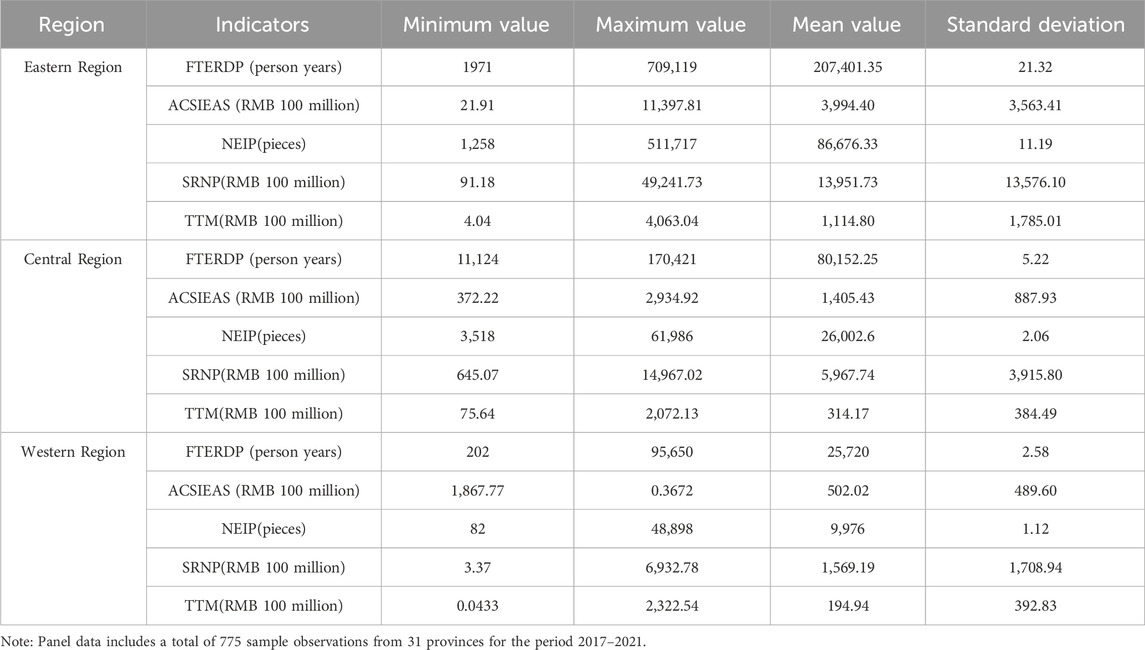
TABLE 1. Statistical description of input-output indicators (2017–2021).
It is evident that the eastern region consistently exhibits significantly higher average values for both input and output indicators compared to the central and western regions. On average, the central region tends to have higher mean values compared to the western region. These findings highlight clear regional disparities in terms of input and output indicators.
In this paper, the input-output profile of the sample in 2017 is used as the base period data to construct a production Frontier function. The author measures the regional innovation efficiency values of China’s manufacturing industry from 2018 to 2021 under the regional Frontier and common Frontier respectively. The paper adopts the nonparametric Mann-Whitney U method to test differences in efficiency and observe the characteristics of variation and regional differences in manufacturing innovation efficiency. The results of the statistical description are shown in Table 2.
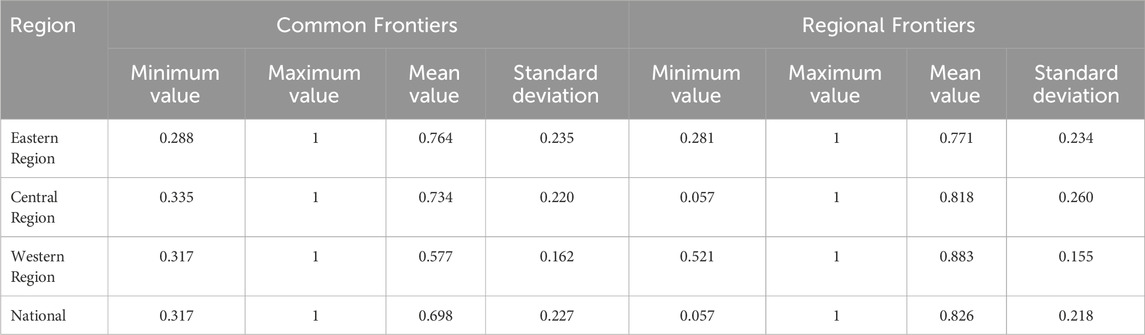
TABLE 2. Statistical description of regional manufacturing innovation efficiency in China (2018–2021).
From 2018 to 2021, China’s overall level of innovation efficiency has shown improvement. However, it is still insufficient, and significant regional disparities persist. Over the sample period, the average regional innovation efficiency in China, calculated using the common Frontier approach, was 0.698. This value is higher than the 0.634 reported by Zou et al. (2022) for the period 2009–2013, indicating an improvement in regional innovation efficiency over the past decade. Interestingly, the data reveals that even if national innovation inputs were reduced by 30.2% each, the innovation output target under the common Frontier could still be met. On a positive note, the Western region’s innovation efficiency, as measured by the regional Frontier (0.883), surpasses the national average of 0.826. This suggests that the Western region is making faster progress and performing effectively in terms of innovation.
In terms of regional comparison, the average innovation efficiency values under the common Frontier, in descending order, are Eastern, Central, and Western regions. Notably, the Western region’s innovation efficiency value of 0.577 under the common Frontier is significantly lower than the national average. Conversely, when considering the regional Frontier, the efficiency values of the three regions, in descending order, are Western, Central, and Eastern. This could indicate a potential overestimation of efficiency values in the Central and Western regions. Moreover, the regional innovation efficiency values are significantly higher under the cluster Frontier compared to the common Frontier. In the Western region, the regional Frontier yields an innovation efficiency of 0.883, leaving 11.7% room for improvement, while the efficiency under the common Frontier is 0.577, leaving 42.3% room for improvement. The difference between these two categories of progressive space is substantial, suggesting a need for further verification of the variability of their efficiency values. The p-values for the three regions (East, West, and Central) are less than 0.05 for both the common Frontier and the regional Frontier, indicating a rejection of the null hypothesis and a departure from normal distribution. Consequently, this study employs the non-parametric Mann-Whitney U method to test the differences in efficiency values under the two frontiers. The results can be observed in Table 3.
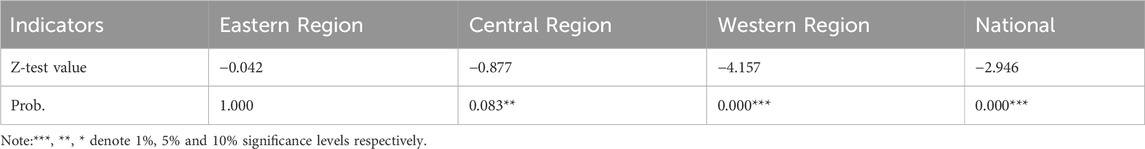
TABLE 3. Results of Mann-Whitney U test for differences in regional innovation efficiency under two Frontiers.
Based on the table provided, it is observed that the p-value for both the Western region and the national innovation efficiency values is less than 0.01, while the p-value for the Central region’s innovation efficiency values is less than 0.05. As a result, the original hypothesis is rejected, and it can be concluded that there is a significant difference between the innovation efficiency values of these groups, and the differences are statistically significant. These results suggest that the Central and Western regions exhibit a higher level of innovation efficiency when considering their own talent pool, technological conditions, and resource environment. However, their efficiency levels are lower when compared to the national level. Therefore, the innovation efficiency values derived using the cluster Frontier in the Midwest may be overestimated. In contrast, the p-value for innovation efficiency in the Eastern region does not meet the significance threshold for either the regional Frontier or the common Frontier. Consequently, the original hypothesis is accepted. These results indicate that the Eastern region continues to demonstrate the highest level of regional innovation in China and maintains its leading position during the sample period.
The innovation efficiency gap in the three major regions of China for 2017–2021 can be analyzed by calculating and comparing their TGR and tested by the Kruskal-Wallis H-test. The results are shown in Tables 4, 5.
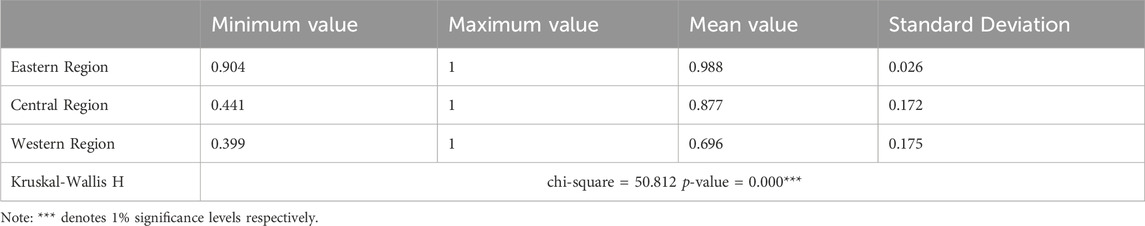
TABLE 4. Statistical description and difference test results of TGR of regional innovation efficiency in China.
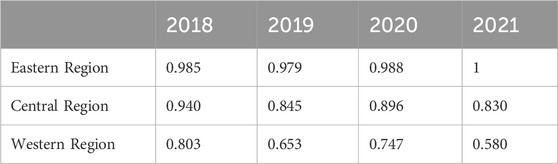
TABLE 5. Annual data on TGR of regional innovation efficiency in China.
According to Table 4, the chi-square test value for the difference in efficiency among the three major regions is found to be asymptotically significant at the 1% level (p = 0.000). Therefore, the paper rejects the initial hypothesis and concludes that the regional disparities in their Total Factor Efficiency (TGR) are highly significant, indicating a substantial technology gap between regions. Firstly, the average TGR scores reveal that the Eastern region exhibits a relatively high level of innovation input utilization, with a score of 0.988. This implies that, given a constant level of innovation output, the utilization of innovation inputs in the Eastern region can reach 98.8%. On the other hand, the TGR scores for the Central and Western regions are 0.877 and 0.696, respectively, leaving room for improvement in regional innovation efficiency by 12.3% and 30.4%. Secondly, the magnitude of extreme differences in TGR scores is relatively small in the Eastern region, whereas significant disparities exist in the Midwest. These findings indicate that while the average difference in innovation efficiency between provinces in the Eastern region is not substantial, there is a considerable average difference within the Central and Western regions. This suggests an imbalance in the development of innovation within these regions. The results highlight significant regional differences in terms of innovation efficiency and indicate the presence of a technology gap between regions. The Eastern region demonstrates higher innovation input utilization, while the Central and Western regions have room for improvement and exhibit larger disparities in innovation efficiency.
Based on the data presented in Table 5, the TGR for the Eastern region consistently remains above 0.97, exhibiting a fluctuating pattern. These findings suggest that the Eastern region benefits from a more favorable institutional arrangement for innovation, resulting in a higher level of innovation efficiency. In contrast, the TGR values for the Central region peaked in 2018 before declining, possibly indicating a greater impact from external factors like the COVID-19 pandemic in recent years, leading to a slight decrease in innovation efficiency. The TGR in the Western region shows a tendency to fluctuate between high and low values, with a widening gap between the Western region and the Eastern and Central regions. This suggests that the Western region still faces challenges in creating an environment conducive to innovation and maintaining stable innovation efficiency. Overall, these observations highlight the advantages of favorable institutional arrangements for innovation in the Eastern region, leading to consistently high levels of innovation efficiency. The decline in innovation efficiency in the Central region is likely influenced by external factors such as the COVID-19 pandemic. The Western region, on the other hand, struggles with establishing an innovation-friendly environment and ensuring stable innovation efficiency.
A more comprehensive investigation of the significant decline in the TGR observed in the central region during 2019, followed by a subsequent recovery, necessitates attributing this fluctuation to the impacts of the COVID-19 pandemic. Although the analysis acknowledges the influence of the pandemic, further inquiry is warranted to comprehend the reasons behind the divergence of the central region’s trend from that of other regions, despite the shared external disruption caused by COVID-19. Factors such as disparities in regional economic structure, industry composition, policy responses, or specific local conditions might have contributed to the distinctive trajectory observed in the central region. For instance, the central region, which might have a higher concentration of industries such as tourism or hospitality that were more severely affected by the pandemic, could experience a more significant decline in the TGR compared to regions with a more diverse industry base. Additionally, the central region’s recovery could be influenced by the implementation of specific policies, such as targeted financial support or infrastructure investments, aimed at revitalizing the local economy. Undertaking comprehensive research and analysis is imperative to unveil the underlying factors driving the divergent trend in the central region and to attain a comprehensive understanding of its specific dynamics in relation to the impacts of COVID-19. The concentration of industries such as tourism or hospitality may potentially account for the decline in the Total Growth Rate (TGR) observed in the central region. Sectors heavily reliant on travel and in-person interactions, including tourism and hospitality, experienced substantial repercussions from the COVID-19 pandemic due to constrained mobility and reduced consumer demand. If the central region exhibits a greater prevalence of such industries relative to other regions, it is conceivable that a more pronounced contraction in the TGR would occur. The heightened dependence on tourism and hospitality sectors renders the central region more susceptible to external shocks, exemplified by the pandemic, consequently precipitating a notable economic downturn. Consequently, the concentration of industries like tourism or hospitality could plausibly contribute to the observed decline in the TGR within the central region during the pandemic.
Based on the preceding analysis, it is evident that the overall regional innovation efficiency of China’s manufacturing industry has not yet reached an optimal level, and significant regional disparities exist. Therefore, it becomes crucial to delve deeper into the underlying causes of efficiency losses in regional manufacturing. In this study, we employ Eqs 9 and 10, 11 to conduct a two-dimensional decomposition of the regional innovation efficiency loss (LIE). Specifically, we decompose LIE into technology gap ratio inefficiency (TGRI) and management inefficiency (MI). By examining the data on the proportion of TGRI and MI in different regions, we can make cross-sectional comparisons of efficiency losses. The results of this analysis are presented in Table 6.

TABLE 6. Decomposition and weighting data of regional innovation efficiency losses in China.
Table 6 shows that the average innovation efficiency loss in China’s manufacturing industry is 0.316, with TGRI and MI accounting for 44.94% and 55.06% respectively. Notably, the area where efficiency losses are more pronounced is MI. This can be attributed to various factors, such as uneven regional development, variations in the strength of regional government policies, competition for investment, differing business environments across regions, and challenges in coordination and management. Specifically, in the Eastern region, the average innovation efficiency loss in the manufacturing sector is 0.236, primarily driven by MI, which constitutes 97.03% of the total loss.
In the Central region, the efficiency loss of 0.266 stems from both MI and TGRI, accounting for 68.42% and 31.58% respectively. In the Western region, the efficiency loss is 0.422, predominantly attributed to TGRI (72.27%), but also influenced by MI (27.73%). These findings indicate that the regional innovation efficiency of the manufacturing industry in the Eastern region is close to the national optimal level. The primary sources of efficiency loss in this region include inadequate internal management decisions, constraints in scientific and technological R&D management, and insufficient development of enterprise innovation culture. In the Central region, efficiency loss is primarily driven by internal management factors, along with a lack of technical skills. In the Western region, the major contributors to efficiency loss are insufficient technological levels, followed by internal management factors.
Regional innovation efficiency plays a crucial role in China’s manufacturing industry as it directly influences the overall productivity and competitiveness of different regions. Understanding and improving regional innovation efficiency is essential for achieving balanced and sustainable development across the country. The manufacturing industry in China exhibits significant regional disparities in terms of innovation performance. Some regions have achieved remarkable progress in innovation, while others lag behind. Identifying the factors that contribute to regional differences in innovation efficiency and developing strategies to enhance it are of paramount importance. This article examines the determinants of regional innovation efficiency in China’s manufacturing industry, including factors such as technological capabilities, human capital, infrastructure, and institutional support. By analyzing data at the regional level and employing appropriate econometric techniques, this study aims to provide insights into the key drivers of regional innovation efficiency and propose policy recommendations to foster innovation and enhance the overall competitiveness of China’s manufacturing industry. In order to address the issue of heterogeneity in manufacturing innovation efficiency and promote balanced regional development, it is imperative to enhance the exchange and collaboration among regional manufacturing industries. Efforts should be directed towards gradually narrowing the gap in innovation development across different regions. To achieve this, it is crucial to steadfastly implement strategic initiatives such as the “Rise of Central China” and the “Strategy for the Development of Western China.” These initiatives aim to provide increased support for scientific and technological innovation in the central and western regions, thereby strengthening their innovation capabilities and reducing the innovation gap with the more advanced Eastern region. Moreover, manufacturing enterprises in the Eastern region should take the lead by benchmarking against global leaders. They should actively promote the spillover and diffusion of technology by sharing their knowledge and expertise. This will contribute to stimulating and facilitating the innovative development of manufacturing enterprises in the Central and Western regions. Leveraging their “latecomer’s advantage,” manufacturing enterprises in the Western region should focus on adopting new technologies and management models through a combination of imitation and innovation. By doing so, they can effectively catch up with more advanced regions and enhance their overall innovation performance (Tone, 2001; Gayosa and Cabanda, 2014; Zou and Zhu, 2020; Feng et al., 2022; Zou et al., 2022; Hou et al., 2023).
By embracing these approaches, they can gradually bridge the gap in innovation and enhance their competitiveness. In summary, by fostering collaboration, providing targeted support, and promoting technology spillover and diffusion, efforts can be made to narrow the regional innovation development gap in the manufacturing sector and achieve more balanced and inclusive growth across regions. Based on the different directions of manufacturing innovation efficiency loss, manufacturing innovation in the three major regions needs to implement differentiated innovation initiatives. Manufacturing innovation in the eastern region to the management of efficiency. Efficiency analysis and the study of innovation performance have received significant attention in research. Battese and Rao, (2002) introduced the concept of a stochastic metafrontier function to examine the technology gap and efficiency, emphasizing the importance of considering heterogeneity across regions or firms when evaluating efficiency. Building on this framework, ODonnell et al. (2008) developed metafrontier frameworks to analyze firm-level efficiencies and technology ratios, allowing for a comprehensive understanding of efficiency performance and the impact of technology on productivity. Sharma conducted (Sharma and Thomas, 2008) an inter-country analysis of R&D efficiency, utilizing data envelopment analysis to gain insights into research and development efficiency across different countries. Fritsch and Slavtchev, (2010) focused on the relationship between industry specialization and the efficiency of regional innovation systems, highlighting both positive and negative effects of industry specialization on innovation efficiency and emphasizing the importance of considering specific regional innovation characteristics. Gayosa and Cabanda, (2014) conducted a Frontier analysis of manufacturing efficiency in the Philippines, using data envelopment analysis to assess efficiency and identify areas for improvement. Feng et al. (2022) conducted a quantitative empirical study to identify key research areas and emerging trends in the marine industry, drawing from Chinese and foreign literature. Zou and Zhu, (2020) investigated innovation performance in the diverse Yangtze Economic Belt region in China, examining the impact of regional heterogeneity on innovation performance. These studies provide valuable insights into efficiency and innovation, including factors influencing efficiency performance, the impact of industry specialization, the role of regional heterogeneity, and the evaluation of innovation performance. Based on these results, the present research aims to examine the influence of urban management on regional innovation efficiency in China’s manufacturing industry, with a specific focus on modern sustainable energy. This study utilizes a non-radial distance function method to explore this relationship. By contributing to the existing literature, this research aims to provide valuable insights into the connection between urban management, innovation efficiency, and sustainable energy practices, benefiting policymakers and practitioners in their efforts to promote sustainable energy systems and enhance regional innovation efficiency. In order to drive manufacturing innovation in different regions of China, specific strategies and approaches are needed. The eastern region should prioritize the deepening of management reform in manufacturing enterprises, emphasizing a sense of responsibility and mission among staff members, and focusing on quality management and efficiency improvement to achieve lean production. In the central region, manufacturing innovation should encompass both internal and external aspects, with a strong emphasis on technology introduction and learning, as well as the promotion of management innovation. In the western region, manufacturing innovation should leverage the benefits of technology and prioritize improving the innovation environment, stabilizing innovation initiatives, and enhancing the technological level of regional innovation. Across all regions, it is important to encourage the development of “specialty and newness” in manufacturing innovation, enabling more “small giant” firms to thrive with their innovative capabilities. The guiding principles of “two unwavering” and the objectives outlined in “Made in China 2025” and the “Outline of the National Innovation-driven Development Strategy” should be adhered to, while continuously optimizing the innovation environment and implementing service-oriented reforms. Additionally, a gradient cultivation approach should be adopted, providing precise support and tailored services to important “small giant” businesses. Strengthening intellectual property protection and environmental regulations, optimizing the mix of factor inputs in the manufacturing industry, and avoiding the pitfalls of relying solely on scientific and technological resources or following the old path of “polluting first and then treating later” are also crucial considerations.
Sun et al. (2022) investigates regional variations and the threshold effect of clean technology innovation on industrial green total factor productivity, providing insights into the relationship between technological innovation and environmental sustainability in different regions. The article acknowledges several limitations that point to areas for future research. It focuses primarily on the impact of urban management on regional innovation efficiency in China’s manufacturing industry, specifically in the context of sustainable energy. The study suggests that exploring the influence of other factors such as government policies, technological advancements, and market dynamics on innovation efficiency would be valuable (Li and Xu, 2018; Sun et al., 2022; Wu and Lin, 2022). Additionally, expanding the analysis to include international cases would provide cross-country insights into fostering efficient innovation ecosystems. This study suggests exploring alternative methodologies and models for efficiency evaluation to validate the results. Several studies have been conducted in the fields of innovation, technological forecasting, environmental sustainability, healthcare planning, and transportation scheduling. These studies cover a wide range of topics within these fields. Researchers have proposed models and methods to enhance semantic matching tasks (Zheng et al., 2022a; Zheng et al., 2022b; Zheng and Yin, 2022). They have also investigated the correlation between social perception and urban noise dynamics (Guo et al., 2022), analyzed regional innovation ability and inequality (Xu et al., 2022), and examined the impact of green patent policies on innovation and environmental sustainability (Xu et al., 2024). Furthermore, other studies have focused on improving technological innovation efficiency in the medical manufacturing sector (Qiu et al., 2023), understanding innovation inequality (Xu et al., 2023), addressing the challenges in achieving environmental sustainability (Li et al., 2023), implementing low-carbon city initiatives, and exploring the role of institutional investors in promoting sustainable innovation practices. Researchers have also explored global innovation networks, examined the effects of policy incentives on technological innovation in new energy vehicle enterprises, studied digital technology adoption and innovation efficiency in manufacturing enterprises (Zhao et al., 2023; Hu et al., 2023; Wu et al., 2023). Additionally, they have investigated remanufacturing processes, intelligent transportation scheduling, healthcare spatial accessibility, the relationship between administrative hierarchy and intercity connections (Jiang and Xu, 2023a; Jiang and Xu, 2023b; Guo et al., 2024), and the carbon sink potential in urban buildings. Many of these studies offer valuable insights and empirical evidence in their respective fields, providing guidance for further research and practical applications (Chen et al., 2023; Mou et al., 2023; Pan et al., 2023). The models and methods proposed in these studies contribute to the advancement of semantic matching tasks by incorporating deep learning techniques, optimizing semantic representations, and leveraging relational information. Their aim is to improve accuracy, robustness, and performance in various applications that require semantic understanding and matching (Zhao et al., 2023; Luo et al., 2023). Longitudinal studies are recommended to observe trends and changes in innovation efficiency over time, as the research relies on data from a specific timeframe. Lastly, addressing potential overestimation of regional efficiency values by utilizing standardized and consistent data sources would enhance the accuracy of the findings. The future research should consider these limitations and delve deeper into the multifaceted aspects of urban management and innovation efficiency for a more comprehensive understanding of the topic.
In conclusion, this comparative study provides valuable insights into the regional innovation efficiency of China’s manufacturing industry, focusing on the impact of urban management. By considering the regional heterogeneity of innovation development across China’s three major regions, this research combines common Frontier theory with the MSBM model to analyze the innovation efficiency landscape. Through the application of the non-radial distance function method and the construction of the MMSBMP model, incorporating various improved methods proposed by scholars, the study assesses the innovation efficiency of the national manufacturing industry from 2017 to 2021. The utilization of the Luenberger index methodology helps identify sources of efficiency losses. The findings reveal significant variations in the innovation efficiency of the manufacturing industry across the three major regions, both at the common Frontier and the group Frontier. However, it is important to note that the innovation efficiency values at the regional frontiers may be affected by variations in technical reference datasets, which can potentially lead to overestimation. Furthermore, the analysis of the TGR values shows distinct development characteristics among the three regions during the sample period. The eastern region exhibits smaller extremes in TGR, indicating a more stable development pattern, while the central and western regions experience larger extremes, suggesting greater fluctuations in their innovation performance. Importantly, this research emphasizes the significance of urban management in shaping regional innovation efficiency. It underscores the need for continuous improvement in the manufacturing industry’s innovation performance, considering the opportunities for enhancement identified in this study. The results contribute to our understanding of regional innovation efficiency in China’s manufacturing industry and provide a basis for further exploration and policy interventions aimed at promoting balanced and sustainable innovation across the regions.
The original contributions presented in the study are included in the article/supplementary material, further inquiries can be directed to the corresponding author.
FX: Conceptualization, Investigation, Project administration, Writing–original draft, Writing–review and editing.
The author(s) declare financial support was received for the research, authorship, and/or publication of this article. Tianjin Philosophy and Social Science Planning Funded Project (TJYY18-028).
I would like to express my sincere gratitude and appreciation to the Urban Construction Management Institute at Tianjin University of Commerce, Tianjin, China, for their valuable support and contribution to this research.
The author declares that the research was conducted in the absence of any commercial or financial relationships that could be construed as a potential conflict of interest.
All claims expressed in this article are solely those of the authors and do not necessarily represent those of their affiliated organizations, or those of the publisher, the editors and the reviewers. Any product that may be evaluated in this article, or claim that may be made by its manufacturer, is not guaranteed or endorsed by the publisher.
1The east includes Beijing, Tianjin, Hebei, Liaoning, Shandong, Shanghai, Jiangsu, Zhejiang, Fujian, Guangdong and Hainan; the centre includes Heilongjiang, Jilin, Shanxi, Henan, Anhui, Jiangxi, Hubei and Hunan; the west includes Inner Mongolia, Shaanxi, Gansu, Ningxia, Qinghai, Xinjiang, Tibet, Sichuan, Chongqing, Guizhou, Guangxi and Yunnan.
Battese, G. E., and Rao, D. P. (2002). Technology gap, efficiency, and a stochastic metafrontier function. Int. J. Bus. Econ. 1 (2), 87.
Chen, L., Chen, T., Lan, T., Chen, C., and Pan, J. (2023). The contributions of population distribution, healthcare resourcing, and transportation infrastructure to spatial accessibility of health care. INQUIRY: J. Health Care Organ. Provis. Financing 60, 004695802211460. doi:10.1177/00469580221146041
Farrell, M. J. (1957). The measurement of productive efficiency. J. R. Stat. Soc. Ser. A Statistics Soc. 120 (3), 253–281. doi:10.2307/2343100
Feng, X., Zhang, Z., Du, J., and Su, A. (2022). The development vein and frontier hot spot of marine industry research--A quantitative empirical study of Chinese and foreign literature based on CNKI and WOS. United States: SSRN.
Fritsch, M., and Slavtchev, V. (2010). How does industry specialization affect the efficiency of regional innovation systems? Ann. Regional Sci. 45, 87–108. doi:10.1007/s00168-009-0292-9
Gayosa, E. S., and Cabanda, E. (2014). Frontier analysis of the Philippine manufacturing efficiency. Int. J. Inf. Decis. Sci. 6 (1), 87–108. doi:10.1504/ijids.2014.059733
Guo, L., Cheng, S., Liu, J., Wang, Y., Cai, Y., and Hong, X. (2022). Does social perception data express the spatio-temporal pattern of perceived urban noise? A case study based on 3,137 noise complaints in Fuzhou, China. Appl. Acoust. 201, 109129. doi:10.1016/j.apacoust.2022.109129
Guo, Y., Wang, L., Zhang, Z., Cao, J., Xia, X., and Liu, Y. (2024). Integrated modeling for retired mechanical product genes in remanufacturing: a knowledge graph-based approach. Adv. Eng. Inf. 59, 102254. doi:10.1016/j.aei.2023.102254
Hang, Y., Sun, J., Wang, Q., Zhao, Z., and Wang, Y. (2015). Measuring energy inefficiency with undesirable outputs and technology heterogeneity in Chinese cities. Econ. Model. 49, 46–52. doi:10.1016/j.econmod.2015.04.001
Hou, S., He, J., and Song, L. (2023). Fiscal science and technology expenditure and the spatial convergence of regional innovation efficiency: evidence from China’s province-level data. Econ. research-Ekonomska istraživanja 36 (1), 1848–1866. doi:10.1080/1331677x.2022.2094436
Hu, F., Qiu, L., Wei, S., Zhou, H., Bathuure, I. A., and Hu, H. (2023). The spatiotemporal evolution of global innovation networks and the changing position of China: a social network analysis based on cooperative patents. R&D Manag. doi:10.1111/radm.12662
Jiang, Z., and Xu, C. (2023a). Policy incentives, government subsidies, and technological innovation in new energy vehicle enterprises: evidence from China. Energy Policy 177, 113527. doi:10.1016/j.enpol.2023.113527
Jiang, Z., and Xu, C. (2023b). Disrupting the technology innovation efficiency of manufacturing enterprises through digital technology promotion: an evidence of 5G technology construction in China. Lithuania: IEEE Transactions on Engineering Management.
Li, C., Yao, Q., Wu, J., and Wang, D. (2019). Financialization and risk taking of non-financial corporations empirical evidence from Chinese listed companies. J. Appl. Finance Bank. 9 (3), 79–107.
Li, J., and Xu, B. (2018). Curse or blessing: how does natural resource abundance affect green economic growth in China. Econ. Res. J. 53 (09), 151–167. doi:10.1111/1467-8489.12423
Li, T., Shi, Z., Han, D., and Zeng, J. (2023a). Agglomeration of the new energy industry and green innovation efficiency: does the spatial mismatch of R&D resources matter? J. Clean. Prod. 383, 135453. doi:10.1016/j.jclepro.2022.135453
Li, X., Wang, F., Al-Razgan, M., Mahrous Awwad, E., Zilola Abduvaxitovna, S., Li, Z., et al. (2023b). Race to environmental sustainability: can structural change, economic expansion and natural resource consumption effect environmental sustainability? A novel dynamic ARDL simulations approach. Resour. Policy 86, 104044. doi:10.1016/j.resourpol.2023.104044
Li, Z., Zhou, X., Jung, S., and Li, J. (2020). China’s 40-year road to innovation. Chin. Manag. Stud. 14 (2), 335–357. doi:10.1108/cms-01-2019-0019
Luo, J., Wang, Y., and Li, G. (2023). The innovation effect of administrative hierarchy on intercity connection: the machine learning of twin cities. J. Innovation Knowl. 8 (1), 100293. doi:10.1016/j.jik.2022.100293
Mou, J., Gao, K., Duan, P., Li, J., Garg, A., and Sharma, R. (2023). A machine learning approach for energy-efficient intelligent transportation scheduling problem in a real-world dynamic circumstances. IEEE Trans. Intelligent Transp. Syst. 24 (12), 15527–15539. doi:10.1109/tits.2022.3183215
ODonnell, C. J., Rao, D. P., and Battese, G. E. (2008). Metafrontier frameworks for the study of firm-level efficiencies and technology ratios. Empir. Econ. 34, 231–255. doi:10.1007/s00181-007-0119-4
Pan, J., Deng, Y., Yang, Y., and Zhang, Y. (2023). Location-allocation modelling for rational health planning: applying a two-step optimization approach to evaluate the spatial accessibility improvement of newly added tertiary hospitals in a metropolitan city of China. Soc. Sci. Med. 338, 116296. doi:10.1016/j.socscimed.2023.116296
Qiu, L., Yu, R., Hu, F., Zhou, H., and Hu, H. (2023). How can China's medical manufacturing listed firms improve their technological innovation efficiency? An analysis based on a three-stage DEA model and corporate governance configurations. Technol. Forecast. Soc. Change 194, 122684. doi:10.1016/j.techfore.2023.122684
Sharma, S., and Thomas, V. (2008). Inter-country R&D efficiency analysis: an application of data envelopment analysis. Scientometrics 76 (3), 483–501. doi:10.1007/s11192-007-1896-4
Sharp, J. A., Meng, W., and Liu, W. (2007). A modified slacks-based measure model for data envelopment analysis with ‘natural’negative outputs and inputs. J. Operational Res. Soc. 58 (12), 1672–1677. doi:10.1057/palgrave.jors.2602318
Sun, H., Zhang, Z., and Liu, Z. (2022). Regional differences and threshold effect of clean technology innovation on industrial green total factor productivity. Front. Environ. Sci. 10, 985591. doi:10.3389/fenvs.2022.985591
Tone, K. (2001). A slacks-based measure of efficiency in data envelopment analysis. Eur. J. operational Res. 130 (3), 498–509. doi:10.1016/s0377-2217(99)00407-5
Wang, E. C. (2007). R&D efficiency and economic performance: a cross-country analysis using the stochastic frontier approach. J. Policy Model. 29 (2), 345–360. doi:10.1016/j.jpolmod.2006.12.005
Wang, H., and Feng, J. (2020). Influences of dynamic capability on breakthrough innovation: evidence from China’s manufacturing industry. Chin. Manag. Stud. 14 (3), 565–586. doi:10.1108/cms-03-2019-0099
Wu, B., Gu, Q., Liu, Z., and Liu, J. (2023). Clustered institutional investors, shared ESG preferences and low-carbon innovation in family firm. Technol. Forecast. Soc. Change 194, 122676. doi:10.1016/j.techfore.2023.122676
Wu, R., and Lin, B. (2022). Environmental regulation and its influence on energy-environmental performance: evidence on the Porter Hypothesis from China's iron and steel industry. Resour. Conservation Recycl. 176, 105954. doi:10.1016/j.resconrec.2021.105954
Wu, Y. (2006). R&D and productivity: an empirical study on Chinese manufacturing industry. Econ. Res. J. 11, 60.
Xiao, L. (2016). Foreign technology introduction and local innovation growth: complementary or alternative. Chine’s Ind. Econ. J. 9, 75–92.
Xiaoqing, D., Jian, Z., and Pengwei, Y. (2014). Research on innovation efficiency loss of state-owned enterprises: an empirical analysis in China based on DEA. Comput. Model. New Technol. 18, 883–889.
Xu, A., Qiu, K., Jin, C., Cheng, C., and Zhu, Y. (2022). Regional innovation ability and its inequality: measurements and dynamic decomposition. Technol. Forecast. Soc. Change 180, 121713. doi:10.1016/j.techfore.2022.121713
Xu, A., Qiu, K., and Zhu, Y. (2023). The measurements and decomposition of innovation inequality: based on Industry − University − Research perspective. J. Bus. Res. 157, 113556. doi:10.1016/j.jbusres.2022.113556
Xu, A., Song, M., Xu, S., and Wang, W. (2024). Accelerated green patent examination and innovation benefits: an analysis of private economic value and public environmental benefits. Technol. Forecast. Soc. Change 200, 123105. doi:10.1016/j.techfore.2023.123105
Yang, M., and Leibold, J. (2020). Building a “double first-class university” on China's qing-zang plateau: opportunities, strategies and challenges. China Q. 244, 1140–1159. doi:10.1017/s030574102000106x
Zhang, F., Huang, J. L., and Wang, R. (2016). Government regulation informal sector and firm innovation: empirical evidence from manufacturing industries. Manag. World 2, 95–111.
Zhao, R., Huang, X., Xue, J., and Guan, X. (2023b). A practical simulation of carbon sink calculation for urban buildings: a case study of Zhengzhou in China. Sustain. Cities Soc. 99, 104980. doi:10.1016/j.scs.2023.104980
Zhao, S., Shi, A., An, H., Zhou, H., and Hu, F. (2023a). Does the low-carbon city pilot contribute to the blue sky defense? Evidence from China. Environ. Sci. Pollut. Res. 30 (35), 84595–84608. doi:10.1007/s11356-023-28262-w
Zheng, W., Tian, X., Yang, B., Liu, S., Ding, Y., Tian, J., et al. (2022b). A few shot classification methods based on multiscale relational networks. Appl. Sci. 12 (8), 4059. doi:10.3390/app12084059
Zheng, W., and Yin, L. (2022). Characterization inference based on joint-optimization of multi-layer semantics and deep fusion matching network. PeerJ Comput. Sci. 8, e908. doi:10.7717/peerj-cs.908
Zheng, W., Zhou, Y., Liu, S., Tian, J., Yang, B., and Yin, L. (2022a). A deep fusion matching network semantic reasoning model. Appl. Sci. 12 (7), 3416. doi:10.3390/app12073416
Zou, L., and Zhu, Y. W. (2020). Research on innovation performance in heterogeneous region: evidence from Yangtze economic Belt in China. Complexity 2020, 1–9. doi:10.1155/2020/8659134
Keywords: regional innovation efficiency, China’s manufacturing industry, urban management, non-radial distance function method, Luenberger index methodology, innovation performance
Citation: Xi F (2024) Examining the impact of urban management on regional innovation efficiency in China’s manufacturing industry with a focus on modern sustainable energy: utilizing a non-radial distance function method. Front. Energy Res. 12:1321891. doi: 10.3389/fenrg.2024.1321891
Received: 15 October 2023; Accepted: 26 January 2024;
Published: 22 February 2024.
Edited by:
Zhengxuan Liu, Delft University of Technology, NetherlandsReviewed by:
Lu Li, Syracuse University, United StatesCopyright © 2024 Xi. This is an open-access article distributed under the terms of the Creative Commons Attribution License (CC BY). The use, distribution or reproduction in other forums is permitted, provided the original author(s) and the copyright owner(s) are credited and that the original publication in this journal is cited, in accordance with accepted academic practice. No use, distribution or reproduction is permitted which does not comply with these terms.
*Correspondence: Feng Xi, eGlmZW5neDEyMzRAdGpjdS5lZHUuY24=
Disclaimer: All claims expressed in this article are solely those of the authors and do not necessarily represent those of their affiliated organizations, or those of the publisher, the editors and the reviewers. Any product that may be evaluated in this article or claim that may be made by its manufacturer is not guaranteed or endorsed by the publisher.
Research integrity at Frontiers
Learn more about the work of our research integrity team to safeguard the quality of each article we publish.