 Dong Pan1
 Xin Zhang
- 1Economic and Technological Research Institute of State Grid Anhui Electric Power Company, Hefei, China
- 2School of Electrical and Information Engineering, Tianjin University, Tianjin, China
In order to address the planning problem of integrated energy system (IES) under the goal of “dual-carbon”, this paper proposes a multi-objective planning method for IES with carbon trading mechanism based on CVaR (Conditional Value at Risk). Firstly, this paper establishes the IES energy supply equipment model and the improved stepped carbon trading model. Moreover, this paper proposes the IES multi-objective two-layer planning model based on the consideration of carbon trading cost. The upper layer of the planning model takes the optimization of economy and environmental as the goal to realize the rational planning of the integrated energy system. The lower layer model takes the minimum operating cost as the goal to optimize the system operating conditions and verify the rationality of the planning results. Then, the uncertainty model based on mean-CVaR is established for the uncertainty of carbon trading price and new energy output in the planning process. Finally, this paper sets up cases and solves the model using non-dominated sorting genetic algorithm-II (NSGA-II) and solver, which shows that the proposed method can realize the IES low-carbon planning while guaranteeing the economy.
1 Introduction
Since the first industrial revolution in the 1860s, greenhouse gases brought about by the massive use of fossil fuels have been emitted, leading to a year-on-year increase in global temperatures and bringing about more serious ecological consequences. At present, in the context of the increasingly prominent global environmental problems, energy saving and emission reduction has become the consensus of the world, and green low-carbon development has become an important trend for countries around the world to cope with the deterioration of the climate (Zhang et al., 2022). On the process of low-carbon development in the world, developed countries and organizations such as the European Union, the United States, Japan, South Korea and other countries and organizations have successively formulated low-carbon transition strategies and emission reduction policies (Cheng et al., 2018). In 2020, China formally put forward the “dual-carbon” goal, striving to reach the peak of carbon emissions by 2030, and striving to achieve carbon neutrality by 2060. With the proposal of the “dual carbon” goal and the new power system, it means that the energy and power industry, as the main force of carbon emission reduction, will face new difficulties and challenges (Kang, 2021; Li, 2021; Zhuang, 2021).
Integrated energy system has the advantages of multi-energy complementarity and energy gradient utilization. And IES has the main characteristics of interconnection and interaction (Lv et al., 2021). Integrated energy system has developed significantly due to its advantages in meeting diversified energy demand and improving energy utilization efficiency (Wang et al., 2023). At home and abroad, many cases of IES demonstration projects have confirmed the safety and reliability of IES and its potential for energy saving and emission reduction (Peng et al., 2017). Due to the complexity and diversity of energy types and energy conversion equipment in IES, the study of IES layout planning and equipment configuration in the region is of great significance (Cheng et al., 2019).
Planning, as the basis and foundation for the development and utilization of integrated energy systems, is directly related to the economy and environmental protection of system operation. In recent years, the planning and operation of integrated energy systems have received extensive attention from scholars at home and abroad. Lei et al. (2021) proposed a multi-stage scenario tree generation method and energy price upper and lower boundary determination method, and established a multi-stage stochastic planning model that can analyze and solve the uncertainty of energy load growth and long-term fluctuation of energy price. Farrokhifar et al. (2020) summarized the joint planning problem of coordinating reliability and economics for electric and natural gas systems. Pourakbari-Kasmaei et al. (2019) constructed an integrated energy source with the objective of economic optimization. Zhang et al. (2023) analyzed the planning ideas to avoid high energy consumption and pollution from an agricultural perspective. Fu and Zhou, (2022) proposed a synergistic optimization method for energy systems adapted to rural areas based on the consideration of energy demand and meteorological information. Zhao et al. (2020) taked into account the energy storage benefits and proposed a method for IES planning in a long time scale with the objective of minimizing the annual investment and operating cost of IES. Fan et al. (2023) introduced the user satisfaction index and user variance in the IES planning model considering incentive-based demand response to balance the economics of the IES planning scheme with user satisfaction. Liu et al. (2021) constructed an energy system planning model considering load characteristics, and proposed an alternate optimization method for the layout of energy stations, energy supply ranges and energy pipe-line networks, and finally verified the validity of the model and its solution through examples. All of the above literature examines planning issues with the objective of economics, with less consideration of environmental factors such as carbon emission.
With the development of the carbon market, the carbon trading mechanism is considered an effective means to reduce carbon emissions and take into account the economy, and the studies considering carbon emissions have gradually increased (Wang et al., 2022). Qin et al. (2018) and Wei et al. (2022) applied the carbon trading mechanism to power system power supply planning models to alleviate the contradiction between the economy and low carbon of low-carbon energy generation. Ding et al. (2022) considered carbon target constraints in the IES multi-stage planning model, and proposed a long-term planning model for regional integrated energy system considering optimal construction timing and demand response. Hu et al. (2020) proposed a carbon emission right allocation scheme with carbon emission intensity and regional carbon emissions as indicators to achieve the optimal allocation of carbon resources. Qu et al. (2018) considered the difference between the actual carbon emissions and carbon emission quotas, and used the traditional carbon trading mechanism to construct an integrated energy system scheduling model that takes into account the carbon trading cost. The above literature simply considered the carbon trading mechanism in the planning and operation of IES, but did not consider the disadvantages of the stepped carbon trading cost as a segmented function, the fixed trading cycle and the high settlement cost, and few studies focus on the treatment of carbon trading cost. Existing research on integrated energy system planning mainly focuses on how to make the system capacity configuration more economical. Practical engineering applications also emphasize economic efficiency and lack of consideration for environmental protection of the system.
In addition, carbon trading price and PV output are often volatile and difficult to accurately predict due to multiple factors such as policy, total carbon emissions and seasonal climate. Value at Risk (VaR) and Conditional Value at Risk (CVaR) models are able to reflect the relationship between uncertainties and political factors, energy prices, abnormal weather and other factors (Zhou et al., 2012; Sheng et al., 2016). CVaR can better portray the tail loss of random factors, and deal with the problem that the probability distribution of random variables does not conform to the normal distribution. So currently CVaR is used more often. Zhao et al. (2020) used CVaR to study the contractual relationship between risk-averse grid operators and electricity suppliers, and to realize supply chain coordination. Gong (2017) combined the problem of wind power system operation and scheduling with risk theory, and introduced CVaR into the system operation risk analysis. Chi et al. (2022) used CVaR theory to measure the impact of electricity price fluctuation on the system, proposed a wind power-pumped storage joint scheduling model based on IGDT-CVaR, and formulated risk avoidance strategies and opportunity seeking strategies according to the risk preferences of decision makers. In summary, CVaR theory is an effective method to deal with uncertainty problems. However, fewer studies have utilized the CVaR theory to study the planning problem of IES system based on the consideration of carbon trading mechanism. And the results obtained by applying CVaR theory are too conservative.
In this end, this paper proposes a multi-objective two-layer planning method for integrated energy system based on mean-CVaR on the basis of existing literature. Firstly, this paper constructs a costing model for an improved stepped carbon trading mechanism of integrated energy system. Second, a multi-objective two-layer planning model for IES is established, and the carbon trading cost is introduced into the planning model. Then, a computational model of mean-CVaR is established to take uncertainty into account in the objective function. Then, the NSGA-II method is used to solve the multi-objective planning model in the upper layer, and the CPLEX is used to solve the operational model in the lower layer. Finally, the study analyzes the impact of carbon trading cost on the planning of integrated energy system and the impact of uncertainty on the planning cost and carbon trading cost of the system, which verifies the positive effect of the method proposed in this paper on the planning cost as well as the environmental friendliness.
The main contributions of this paper are as follows:
(1) The uncertainty of carbon trading price and PV output is taken into account in the model of integrated energy system planning. In the real scenario, the carbon trading price and PV output are affected by multiple factors such as national policy and seasonal climate, which show a certain degree of volatility and are more difficult to predict accurately. In this paper, the mean-CVaR method is used to describe the operating cost function, and the IES planning model considering uncertainty is established.
(2) In the carbon trading cost calculation, an improved stepped carbon trading model is established. It changes the trading model with fixed price in the same carbon quota interval, and further optimizes the treatment in each carbon trading quota interval. And the price increases with the increase of carbon trading volume as a penalty for high carbon emissions.
(3) The two key elements considered in the planning level objective function are economic costs and carbon emissions. The planning program is feasible when the planning results of the IES have economic benefits, and carbon emissions should also be considered in the planning process in order to respond to sustainable development.
2 Structure and models of IES
2.1 Structure of the IES
Integrated energy system is a comprehensive system integrating energy production, conversion, storage and consumption, which can realize the coordination and optimization of different energy sources in the process of energy system planning and operation. And it can make the user’s energy demand satisfied while combining the guidance of carbon trading to promote its own low-carbon economic operation. The structure of the IES established in this paper is shown in Figure 1.
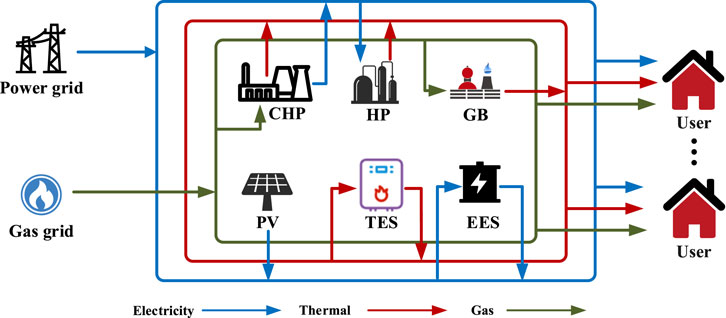
FIGURE 1. Structure of IES.
The main equipment within the IES studied in this paper are combined heat and power unit (CHP), heat pumps (HP), gas boilers (GB), photovoltaics (PV), electrical energy storage (EES) and thermal energy storage (TES). Each equipment supplies the load demand on the customer side through the production, conversion and storage of the multi-energy system.
2.2 Energy station equipment model
(a) Combined heating and power (CHP) is generally based on micro-gas turbine, internal combustion engine and other equipment, which can not only produce electricity, but also utilize the high temperature steam emitted during the production process for heat supply, and are the core energy conversion equipment of distributed energy stations (Geidl Anderson, 2005). The research in this paper focuses more on the overall energy conversion characteristics of multiple devices coupled together. The expression is given in Eq. (1).
where
(b) Heat pump (HP) is capable of converting hard-to-utilize low-level heat energy into high-level heat energy by means of a reverse cycle, which has a high conversion efficiency. The expression is given in Eq. (2).
where
(c) Gas boiler (GB) can produce heat energy by burning natural gas, which has high environmental benefits compared with traditional coal-fired heating. At the same time, the configuration of gas boiler in distributed energy stations can also be used with CHP unit to supply heat when the electricity price is high and the demand of electric load is low, which can further improve the economy of the system. The expression is given in Eq. (3).
where the
(d) Energy storage is an important way to maintain the balance problem between supply and utilization of energy systems, and also a reliable means to enhance the consumption of renewable energy. In this paper, two forms of energy storage, electrical and thermal, are planned based on load characteristics. The expressions for electrical and thermal energy storage are shown in Eqs (4) and (5).
① Electrical energy storage
where the
② Thermal energy storage
where the
(e) Photovoltaic (PV) power generation is a renewable energy generation technology that utilizes the most abundant energy sources to create the cleanest electricity, and belongs to the energy supply portion of the energy station, which is particularly important for promoting the clean and reliable use of energy. The output power of PV depends on the degree of radiation received per unit area of the photovoltaic panels, and the specific relationship is as follows Eq. (6):
where
3 IES carbon trading cost model
At present, many places are experimenting with carbon trading markets, and a sound carbon trading market can, to a certain extent, promote low-carbon emission reduction in various industries. Under the carbon trading mechanism, carbon emissions are a commodity that can be traded freely based on the difference between the carbon emission allowances allocated by the government and the actual carbon emissions. The regulator will issue free carbon emission allowances to IES. When the carbon emissions generated by IES are lower than the quota, the remaining quota can be taken to the carbon trading market to be sold, and otherwise, it is necessary to purchase the excess quota (Qin et al., 2018). The above carbon trading mechanism is mainly composed of the following three parts: the initial carbon emission right quota, the actual carbon emission and the carbon trading cost.
3.1 Carbon emission quota calculation methodology
In the electricity sector, the current predominant approach for initial allocation of carbon emission allowances is uncompensated distribution (Qu et al., 2018). Utilizing the integrated energy system model depicted in Figure 1, this study considers the entire electricity procured from the higher-level power grid to be exclusively sourced from thermal power generation. The benchmark method (Zhang et al., 2020) is employed to ascertain the uncompensated carbon emission quotas for the system, emphasizing external electricity procurement, combined heat and power cogeneration facilities, and gas boilers as the primary contributors to carbon emissions. Hence, the allocation of uncompensated emission allowances for carbon trading is be described as Eqs (7)–(10):
where
3.2 Actual carbon emission calculation methodology
In this paper, it is set that all purchased electricity is produced by thermal power units. Therefore, the carbon emissions of the integrated energy system include carbon emissions from purchased electricity and heat, and equipment using natural gas as primary energy, which emits CO2. In addition, the sale of excess electricity to the grid reduces carbon emissions to a certain extent. The actual carbon emissions of the system are shown in Eq. (11).
where
Equipment in the IES that uses natural gas as a fuel includes CHP and GB, and the carbon emissions formula for natural gas-fueled equipment in the IES can be described as Eq. (12):
where
The formula for indirect CO2 emissions caused by IES purchasing electricity from the superior grid is shown in Eq. (13):
where
3.3 Carbon trading cost calculation model
In the process of calculating carbon trading costs, the trading volume of IES in the carbon trading market is determined by IES carbon emission quota and actual carbon emissions. The carbon trading volume is calculated based on the initial allocation of carbon emission quota in the system and the actual carbon emissions. The expression is given in Eq. (14).
Calculate the total carbon trading cost based on the carbon trading quota. The traditional stepped carbon trading mechanism calculates the carbon trading cost by setting a stepped carbon price in different carbon trading quota intervals, thus limiting the carbon emissions of the system. Whenever the carbon trading volume is raised by one interval, the carbon trading base price of the corresponding interval will be raised to achieve the purpose of limiting carbon emissions. The traditional carbon trading mechanism results in high settlement costs due to the segmented function of the carbon trading cost calculation method. The improved stepped carbon trading is further optimized and processed within each carbon trading amount interval on the basis of the traditional model with the following formula (15):
where
From the above, it can be seen that the carbon trading price in the improved carbon trading mechanism will not be fixed in the carbon emission range, but will increase with the growth of trading volume. The comparison between the traditional ladder carbon trading mechanism and the improved ladder carbon trading mechanism established in this paper is shown in Figure 2.
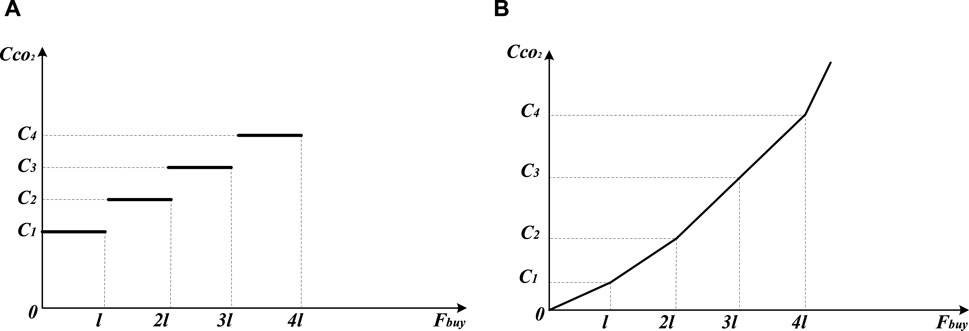
FIGURE 2. Comparison of carbon trading mechanisms. (A) Traditional stepped carbon trading mechanism. (B) Improved stepped carbon trading mechanism.
4 IES equipment configuration model with carbon trading mechanism
IES planning and operational optimization are the foundation for the sustainable development of an integrated energy system. Additionally, the planning optimization of IES is crucial to ensure optimal operation and address important challenges during the initial establishment of the IES. This paper first analyzes the capacity planning of the IES, considering economic costs and carbon emissions as optimization objectives. An upper level capacity planning optimization model for IES is constructed. Next, the operation of the IES is analyzed with the system operating cost as the optimization objective, and a lower level operational optimization model for regional integrated energy systems is developed.
4.1 Planning layer model
In the upper layer model for planning, the system economy is the first indicator to be considered, and the second key element is the carbon emission, which is generated by the system in the operation process, and the high environmental cost will be paid for the excess emission or over-emission. Therefore, in order to fully guarantee the economic and environmental benefits of the system, the upper layer establishes a multi-objective planning model with the economic cost of the system and carbon emissions as the optimization objective.
4.1.1 Economic objective function
At the IES capacity planning level, the economic optimization criterion is followed. In this paper, the minimization of the planning cost over the entire life cycle of the IES is taken as the objective function at the planning level. The integrated cost involves the annual construction investment cost of the integrated energy equipment, the operating cost, and the cost of the equipment’s residual value. The expression is given in Eq. (16).
where
(1) The cost of the initial investment includes the sum of the investment costs of equipment such as photovoltaic power generation units, energy storage equipment, combined heat and power units, heat pumps, and gas boilers. The expression is given in Eq. (17).
where
(2) Operating costs can be affected by factors such as operating conditions, fuel prices and carbon trading prices. Carbon trading price has uncertainty and its fluctuation will have a greater impact on the operating cost, while the operating cost, as a part of the total cost of planning, will directly affect the results of integrated energy system planning. The operating cost can be described as Eq. (18):
where
(3) The salvage cost of equipment is the depreciation cost of equipment within the energy supply system, calculated as a fixed percentage of the original investment cost. The expression is given in Eq. (19).
where
4.1.2 Environmental objective function
Carbon emissions are also one of the key considerations during the capacity planning phase of an integrated energy system. Compared with a single energy system, the integrated energy system can better reduce the greenhouse gas emissions. In this paper, carbon emission is taken as one of the objective functions for energy station planning, and the expression is shown in Eq. (20):
4.2 Operational layer model
The lower level operational optimization model is optimized based on the upper level system capacity planning scheme. The optimization model is optimized with the objective of minimizing the system operating cost.
The objective function of the runtime layer is described above. As part of the integrated cost of the planning layer objective function, the results of the search for economic optimization in the operational layer will support the search for optimization in the planning layer.
The cost of energy consumption includes the cost of consuming natural gas and the cost of purchasing energy from upper units. The expression is given in Eq. (21).
where
Maintenance costs include the maintenance costs of the energy supply equipment and the maintenance costs of the energy storage equipment. Their expressions are described as Eqs (22)–(23):
where
The expression for the revenue from electricity sales can be described as Eq. (24):
where
4.3 Constraint condition
4.3.1 Planning layer constraint condition
The integrated energy system planning layer constraints mainly include the initial system construction investment cost constraints and equipment capacity planning constraints. The expression is given in Eqs (25) and (26).
where
4.3.2 Operating layer constraint condition
IES operation constraints mainly include power balance constraints and security operation constraints for each device in the energy station.
4.3.2.1 Power balance constraints
Power balance constraints are categorized into electrical and thermal power balances. The expression is given in Eqs (27) and (28).
where
4.3.2.2 Security operational constraints
The safe operation constraints of the equipment are designed to ensure the safe operation of all types of equipment and the reliability of the integrated energy system. The main consideration is the power upper limit constraints and climbing constraints of each equipment.
The constraints for energy supply equipment and energy storage equipment are as follows Eqs (29)–(34).
where
where
5 Uncertainty model based on the Mean-CVaR method
5.1 CVaR risk measurement criteria
Carbon trading price and PV output have uncertainty during operation due to policy and climate conditions, and carbon trading mechanism and PV equipment add uncertainty to the planning of the system. CVaR is a commonly used tool in risk metrics, which can make up for the shortcomings of VaR, and can more accurately describe the tail risk compared to VaR (Khaloie et al., 2020; Anderson et al., 2020). Therefore, in order to better measure and reduce the risk caused by carbon trading price and PV output forecast bias, this paper uses CVaR to quantify the risk after considering carbon trading price and PV output uncertainty.
VaR is the value of the maximum possible loss that an asset or portfolio may suffer at a given confidence level, describing the quantile of the corresponding loss distribution, but it is unable to estimate the additional loss beyond the maximum loss, does not take into account the extreme cases, and does not portray the tail risk well. CVaR predicts the extreme risk cases, describing the average of the excess loss over the portion of the VaR value.
Let
where
Let the confidence level be
Then the expected value of operating cost over VaR value at this confidence level (CVaR function) is shown in Eq. (37):
where
In order to solve the CVaR function, this paper uses Monte-Carlo sampling to draw
5.2 Mean-CVaR model
Based on the definition of the CVaR function, it can be seen that the CVaR criterion can make the calculation too conservative. This is because under the CVaR criterion, when the confidence level is small, it cannot reflect the degree of risk aversion of the integrated energy system. When the confidence level is large, the cost of the integrated energy system increases dramatically. The use of the mean-CVaR method allows for the integration of planning cost and uncertainty. The formula for the mean-CVaR method is shown in Eq. (40):
where
When
The model takes into account carbon trading price and PV output uncertainty, and then rederives the operating costs through mean-CVaR. A model that takes into account uncertainty is more realistic.
6 Solution method
Based on the above two-layer optimization model, it can be seen that the upper layer capacity planning of the model is a typical complex multi-objective optimization problem aiming at economy and environmental protection. According to the characteristics of the model, an improved non-dominated sorting genetic algorithm-II (NSGA-II) is used in this paper to solve the planning model. In addition, the lower level operation optimization is a typical mixed integer problem, which is solved by CPLEX solver.
Traditional multi-objective methods use weighting factors to transform multiple objectives into a single objective, so the selection of weighting factors seriously affects the optimization results. And the determination of weight factors is itself an optimization problem. The biggest advantage of NSGA-II algorithm based on Pareto solution set is that there is no need to consider the weighting problem. The NSGA-II algorithm can compare multiple objectives to obtain the Pareto optimal solution, which is not unique, and all the Pareto solutions form a uniformly distributed set of Pareto optimal solutions, from which the one that best meets the requirements can be selected according to different purposes.
In the upper capacity planning stage of this paper, the multi-objective functions of economic cost and carbon emission as well as the planning constraints are considered. And NSGA-II algorithm is used to solve the multi-objective optimization problem to get the pareto solution set based on economic cost and carbon emission. In the NSGA-II algorithm solution process of this paper, the initial population size is set to 500, the number of iterations is 100, the crossover rate is set to 0.85, and the variance rate is set to 0.2 (Wang et al., 2019). Figure 3. Shows the flowchart of NSGA-II algorithm.
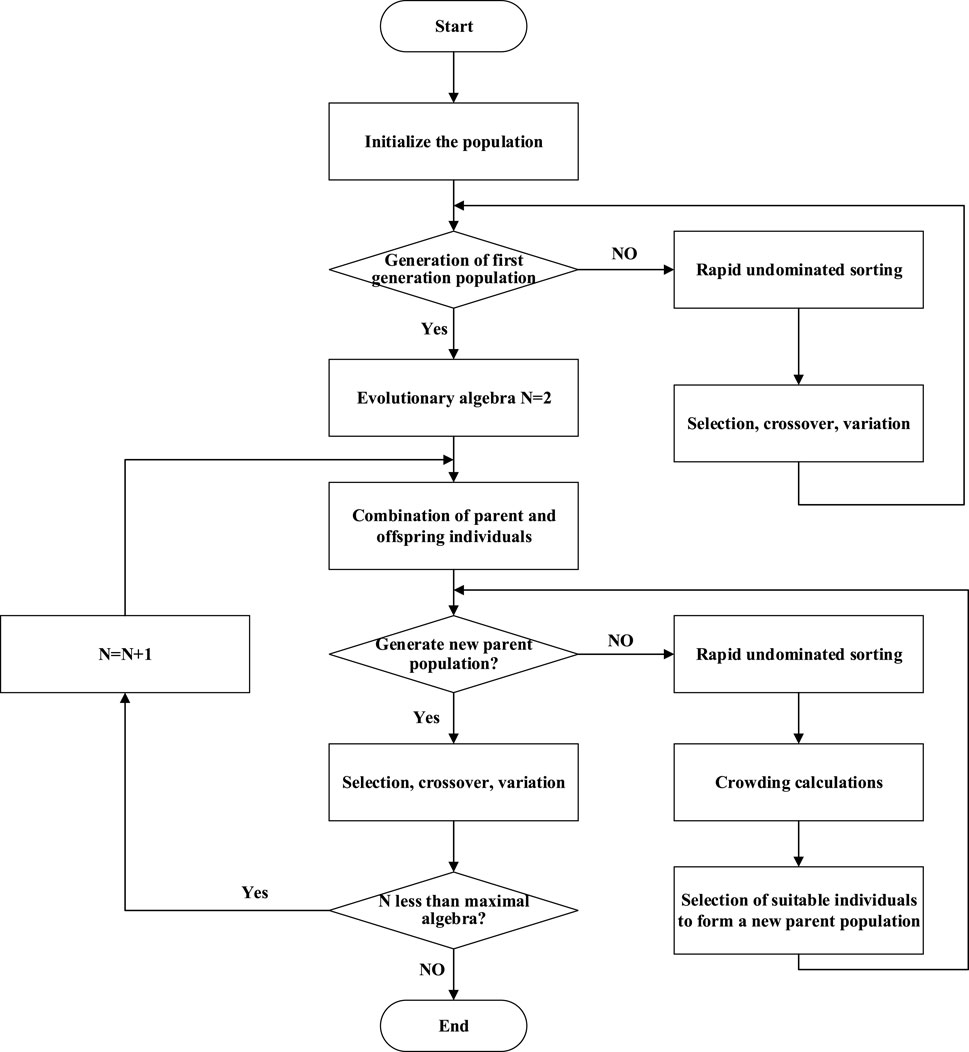
FIGURE 3. Flowchart of NSGA-II algorithm.
The process of solving the multi-objective capacity planning problem based on NSGA-II can be divided into system initialization, population initialization, genetic operations, population combination and output results. The optimal configuration result as well as the operating cost is obtained by selecting the process of crossover, mutation and population combination.
In the two-layer optimization process, the decision variable in the upper planning layer is the capacity configuration of each device. After initializing the capacity of each device, if it satisfies the constraints in the planning layer, it is substituted into the operation layer as a known parameter value for optimization. The decision variables in the lower operation layer are the output power of each device and the storage and discharge power of the energy storage device. The configured capacity of each device is substituted into the values of the decision variables in the upper layer. Under the premise of satisfying the constraints in the operation layer, the power of each equipment and the power of the energy storage device are optimized to obtain the optimal objective function in the operation layer. After that, the decision variables in the operation layer and the system operating costs are returned as known parameter values and substituted into the planning layer for calculation to obtain the adaptation value under the planning scheme. Afterwards, the cycle continues to reach the overall optimization, and the capacity planning results are obtained through the interaction of the upper and lower layers.
7 Case study
7.1 Basic data
In this paper, a typical integrated energy system is selected as the research object. The two-layer optimization model established in this paper is applied to simulate the capacity planning optimization as well as the operation state optimization of the system in order to verify the reliability and accuracy of the model established in this paper.
The basic parameters required for the simulation mainly include the alternative capacity of the system equipment, the investment cost per unit of power, the operating cost per unit of power, the load demand curve, the energy price, the carbon emission coefficient, and the light intensity. Figure 4 shows the typical daily electrical and thermal loads and light intensity curves, Figure 5 shows the time-of-use electricity price curves. And the types of equipment to be planned and their parameters are shown in Table 1. The price of natural gas is 3.50 CNY/m3, which is converted to 0.34 CNY/kWh according to the unit calorific value (Zhu et al., 2023).
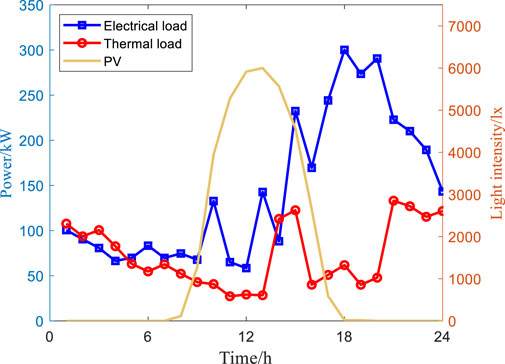
FIGURE 4. Typical daily electrical and thermal loads and light intensity curves.
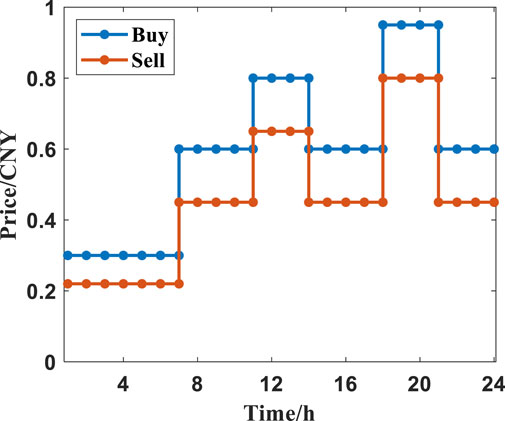
FIGURE 5. Time-of-use electricity price.
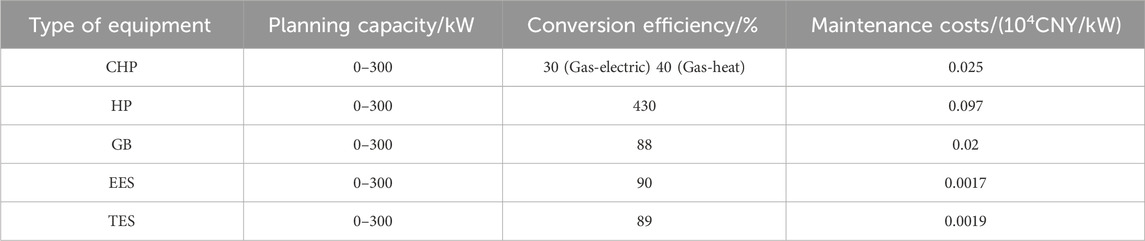
TABLE 1. Types and parameters of equipment to be planned.
In order to prove the effectiveness of the method proposed in this paper, the following five scenarios are set up for comparative analysis. The descriptions of the scenarios are shown in Table 2.
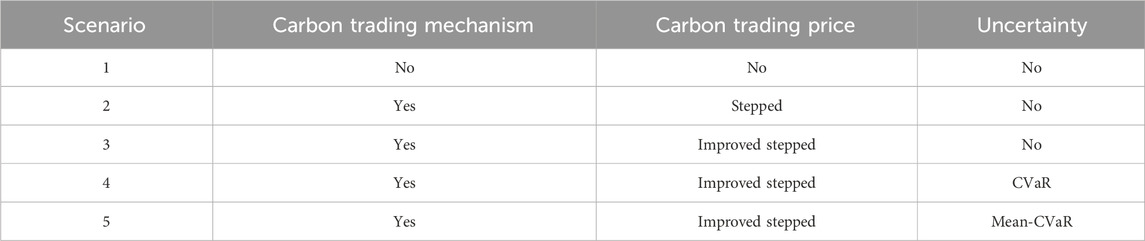
TABLE 2. The IES planning scenarios setting.
7.2 Benefit analysis of multi-objective planning
The pareto front obtained for scenario 1 and scenario 2 based on the two objectives of planning cost and carbon emission are given in Figure 6.
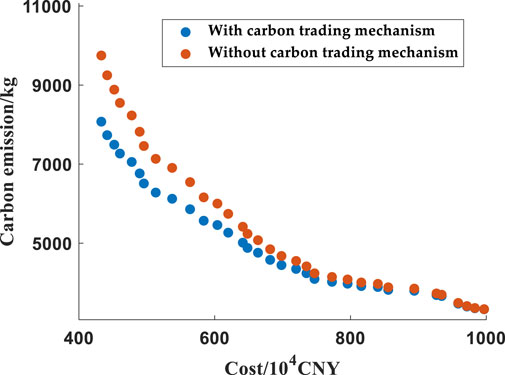
FIGURE 6. Pareto front.
Compared with Scenario 1, Scenario 2 introduces a carbon trading mechanism that changes the planning results of the integrated energy system. The carbon emissions of the system are constrained when the carbon trading mechanism is considered, because the introduction of the carbon trading mechanism will increase the additional carbon trading cost, and the system will look for lower carbon operation and planning schemes in order to reduce the planning cost. In addition, when the system’s carbon emissions are at a low level, the planning results under the two scenarios tend to overlap. This is because at this time the decision maker focuses too much on carbon emissions, which will increase the total cost regardless of whether there is a carbon trading mechanism or not. When the system planning cost is at a low level, it is because the carbon trading cost becomes part of the planning cost after the introduction of carbon trading mechanism. Although the decision makers only want to minimize the planning cost, they still need to reduce the carbon trading cost by reducing carbon emissions, which in turn reduces the planning cost.
From the figure, the economics and environmental friendliness of the system are contradictory, with more environmentally friendly (lower carbon emissions) IES incurring more economic costs. In the capacity planning process, only considering carbon emissions is not comprehensive, and the carbon trading mechanism should also be considered to constrain from the economic aspect. It can be seen that introducing the carbon trading mechanism into the integrated energy system planning model and taking the planning cost and carbon emission as the objective function at the same time can make the IES minimize the carbon emission.
In summary, the multi-objective two-layer model with carbon trading mechanism constructed in this paper has advantages in environmental protection and is more in line with the need of the whole society for the environmental protection of the IES.
7.3 Benefit analysis of improved stepped carbon trading mechanism
In order to study the impact of stepped carbon trading mechanism on integrated energy system planning, Table 3 compares the planning cost, carbon trading cost and carbon emissions of integrated energy system under two scenarios.
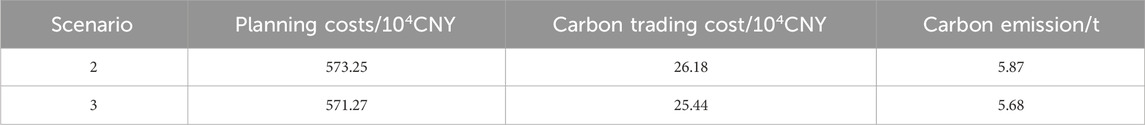
TABLE 3. Implications of stepped carbon trading mechanism for IES planning.
Comparing scenario 2 and scenario 3, it can be seen that the results of planning cost and carbon emissions are different under different carbon trading mechanism. After adopting the improved stepped carbon trading mechanism, the carbon emissions will further decrease, indicating that the improved stepped carbon trading mechanism can guarantee the strictest control effect on carbon emissions, and the system will purchase natural gas with lower carbon emissions for energy supply as much as possible to achieve the purpose of emission reduction, so that the improved stepped carbon trading mechanism can promote the system to carry out carbon emission reduction while taking into account the operation economy of the system.
The above comparison reveals that the improved stepped carbon trading cost calculation model is significant in reducing the carbon emissions of the system and making the integrated energy system more low-carbon.
7.4 Benefit analysis of Mean-CVaR theory
The weight
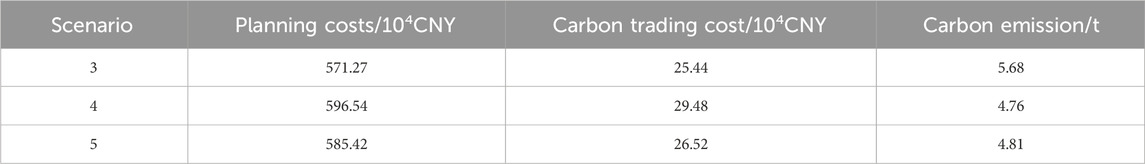
TABLE 4. Impact of mean-CVaR theory on IES planning.
Comparing scenario 3 and scenario 4, the impact of uncertainties on integrated energy system planning is analyzed. Compared with scenario 4, scenario 3 is too “ideal” because it does not take into account the uncertainty of carbon trading price and PV output. However, scenario 4 uses the traditional CVaR theory to construct the uncertainty model, which makes the planning scheme of the integrated energy system more conservative, and therefore the planning cost is higher. Scenario 5 uses the improved mean-CVaR theory to construct the uncertainty model, which effectively reduces the planning cost when the carbon emissions are almost unchanged, and thus scenario 5 is the optimal scenario in this paper.
In order to further study the influence of the selection of weight and confidence level on IES planning, Figure 7 compares and analyzes the optimization results of IES planning model with different weights and confidence levels, using confidence level as the independent variable.
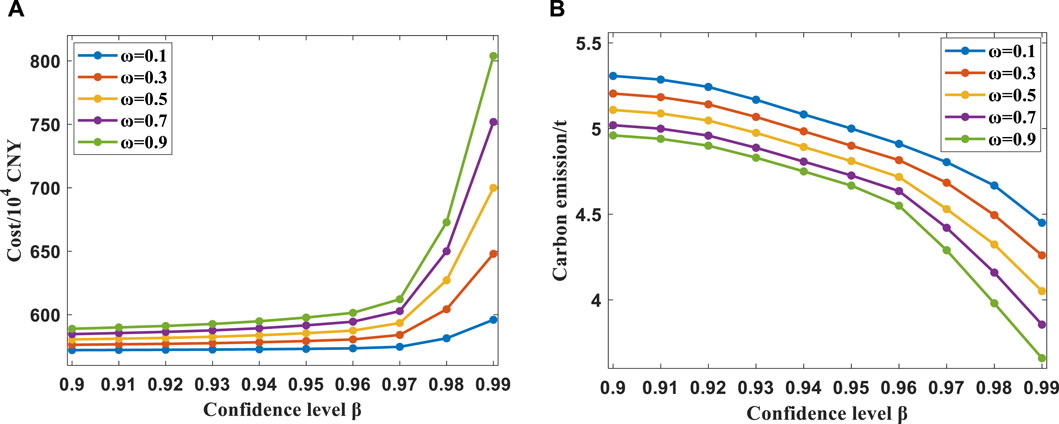
FIGURE 7. Planning cost and carbon emission at different confidence levels. (A) Planning cost. (B) Carbon emission.
Figure 7 reflects the comparative analysis of planning cost and carbon emissions of integrated energy system under different weights and confidence levels. As can be seen from Figure 7A, the planning cost is positively correlated with the weight ω and confidence level, and the upward trend is more and more obvious when the confidence level is at the position of 0.96; and as can be seen from Figure 7B, the carbon emission is negatively correlated with the weight ω and confidence level, and the downward trend is more and more obvious when the confidence level is at the position of 0.96. With the increase of confidence level and weight, the decision maker is more inclined to avoid the risk generated by the uncertainty of carbon trading price and PV output, which makes the low carbon emission power source or unit output increase continuously, and then makes the system planning cost increase and carbon emission decrease.
7.5 Analysis of simulation results
This section analyzes the operational simulation for scenario 5, which is the model proposed in this paper.
7.5.1 Selection of the optimal solution
The application of multi-objective planning will result in the existence of multiple sets of capacity allocation options for the integrated energy system that meet the planning needs. In a multi-objective optimization problem, it is necessary to obtain the optimal solution from the Pareto front based on different metrics. Since each solution from the Pareto frontier is a feasible solution for system planning, the solution selection process is necessary to determine the optimal solution for planning. The Technique for Order Preference by Similarity to an Ideal Solution (TOPSIS) is widely used to select the optimal solution based on the distance between the ideal solution and the negative ideal solution, which are computed from the Pareto frontier and the metrics’ preferences (Peng et al., 2022).
In this paper, the TOPSIS method is used to select the optimal solution by setting the weights of each evaluation objective to be the same, and both indicators follow the assumption of 1/2. The pareto front of scenario 5 is shown in Figure 8, and the results of the optimal ideal solution and the negative ideal solution based on the TOPSIS method are obtained by calculation as shown in Table 5.
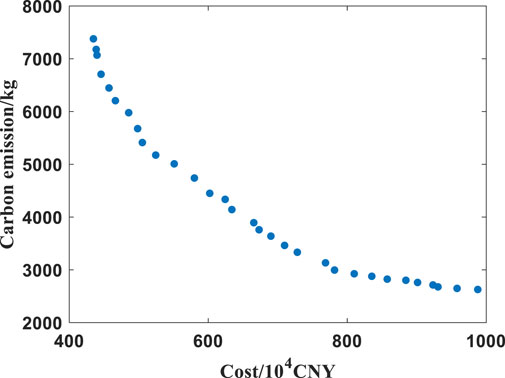
FIGURE 8. Pareto front of scenario 5.
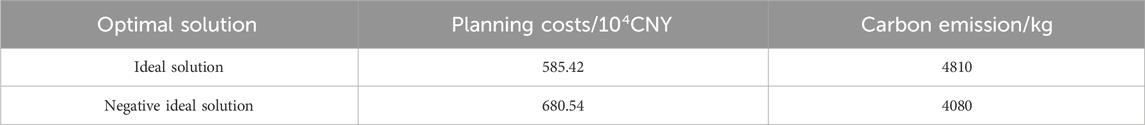
TABLE 5. Comparison of optimal solution schemes.
In the ideal solution case, the capacity allocation of each device in the IES is shown in Figure 9.
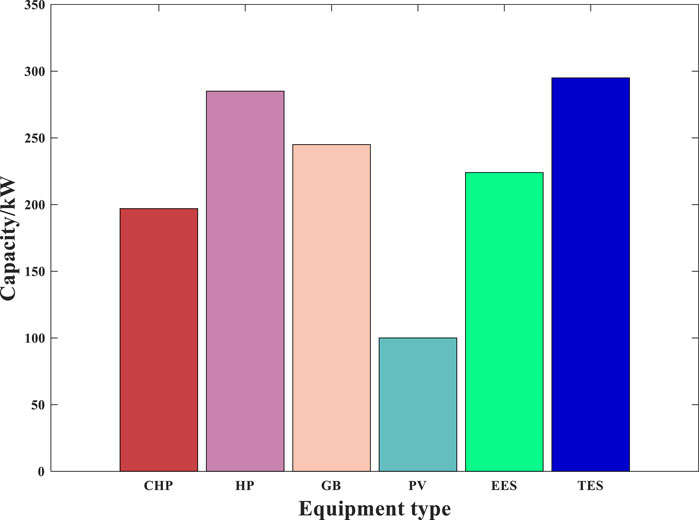
FIGURE 9. Planning results.
According to Figure 9, it can be seen that CHP, GB, and HP have larger installed capacity in the configuration results. This is due to the fact that CHP is the main power source other than PV. GB and HP are the main energy supply devices for thermal loads. In addition, PV is planned to have some capacity due to the absence of consumption and environmental costs, although it is very expensive, which indicates that the energy station tends to maximize the use of renewable energy sources. Energy storage is also well planned as a key device for coordinating the consumption of renewable energy sources and utilizing peak shaving to improve system economics. However, due to the higher unit cost and shorter service life of electric energy storage, the planned capacity is lower compared to thermal energy storage.
7.5.2 Results of the typical day operation
In the planning process, the accuracy of capacity allocation is mainly reflected in the two aspects of system operation state and system economy. In this section, on the basis of system planning, the operation optimization simulation of the system is carried out to analyze the operation state of the system under the optimal planning scheme to ensure the reasonableness of the capacity allocation and the economic operation of the system. For the upper level capacity planning scheme, this paper selects the typical daily electric and thermal loads and light data for the system operation simulation, and obtains the typical daily electric power balance scheduling results and thermal power balance scheduling results, as shown in Figures 10, 11, respectively.
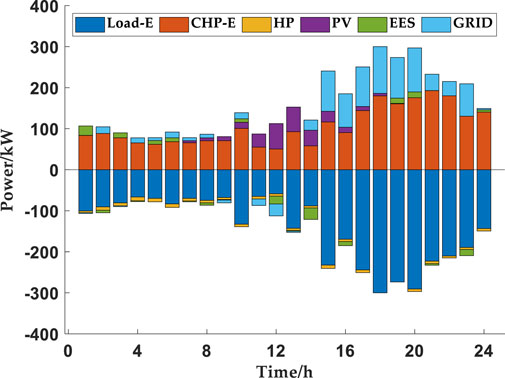
FIGURE 10. Electric energy scheduling results on a typical day.
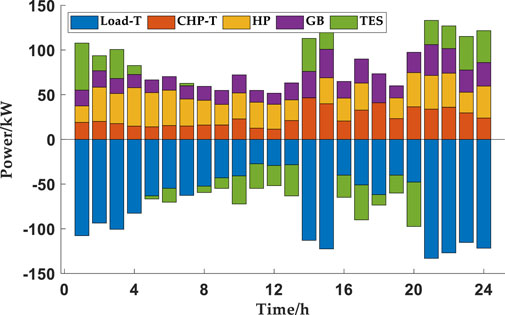
FIGURE 11. Thermal energy scheduling results on a typical day.
In terms of the overall trend, as natural gas prices are more favorable than electricity prices most of the time. And CHP can generate electricity and heat energy at the same time, with higher comprehensive energy utilization rate and economy, it has become the main energy supply equipment for electricity and heat loads. However, due to the influence of time-sharing tariffs and the limitations of capacity and operation status, CHP cannot completely supply all the energy demand during peak loads. Therefore, it needs to be supplemented by the power grid or other equipment on the basis of merit and coordinated with each other.
In terms of electricity, PV, CHP and the grid collaborate to supply electricity, and electric storage regulates charging and discharging to cooperate with the optimized operation of the system. In the order of power supply, because renewable energy in the operation process only exists in equipment operation and maintenance costs and more environmentally friendly, so the planning results become the preferred supply equipment. However, due to environmental factors and capacity constraints, it is difficult to meet the demand of all power loads, and the remaining portion needs to be supplemented by CHP and the grid. The typical daily supply situation is shown in Figure 10. Combined with Figure 10, it can be seen that due to the impact of energy prices, the grid mainly cooperates with the power supply when the CHP output reaches the upper limit or when the output is small, and is used to supplement the higher power demand.
In terms of heat, thermal loads are mainly supplied through HP, CHP, and GB, with thermal storage cooperating with them to achieve optimal operation. When the thermal demand is not high and the purchase price of electricity is low, thermal loads are first supplied through HP, while HP is utilized for thermal energy storage when the electricity is sufficient. On the contrary, when the heat demand increases and the price of electricity is high, CHP supplies electricity and heat at the same time, which is more economical than other methods. Therefore, CHP is preferred for heat supply and thermal energy storage is used in conjunction with it. HP has a higher heat production efficiency than GB, and can produce more heat energy by consuming the same cost of energy, so if the CHP output reaches the upper limit and still fails to satisfy the thermal demand, HP is firstly put into operation to supplement the heat supply, and if it still fails to satisfy the demand, then it will be supplemented by GB.
8 Conclusion
In this paper, a multi-objective planning method based on mean-CVaR for IES with carbon trading mechanism for integrated energy system is proposed. With the objectives of minimizing the economic cost of the system and minimizing the carbon emission, a two-layer planning model of IES considering the carbon trading mechanism is constructed. And the following conclusions are drawn through the comparison and analysis of cases.
(1) According to the set of multi-objective pareto front solutions, economy and environmental friendliness are not compatible. Economy is inversely related to environmental friendliness, and IES with higher environmental friendliness have higher economic costs.
(2) Carbon trading mechanism utilizes market means to achieve carbon emission control, so that each subject takes the initiative to reduce carbon emissions to reduce the cost of carbon trading. The introduction of the improved stepped carbon trading mechanism optimizes the traditional carbon trading calculation method, and the carbon reduction effect of the system is significantly improved. At the same time, the method takes into account the economy of the system, so that the planning results are more in favor of the allocation of equipment with lower carbon emissions.
(3) In the actual IES planning process, carbon trading price and PV power generation have uncertainties. In order to effectively characterize their impacts on planning, this paper uses the mean-CVaR method to recapture the operating costs and builds a planning model that takes uncertainty into account. As the confidence level increases, IES tends to be in a risk-averse state, which leads to a decrease in carbon emissions and thus an increase in planning costs. In addition, after considering the uncertainty in the IES planning process, the scheme proposed in this paper can balance the economy and low carbon.
This paper investigates the planning and operational design of a single integrated energy system, and does not address the coupling relationship between multiple regional integrated energy systems and the modeling study of energy transmission aspects of power grids and natural gas pipeline networks. The synergistic planning between pipeline network modeling and multiple regional integrated energy systems can be further studied in the future.
Data availability statement
The original contributions presented in the study are included in the article/supplementary material, further inquiries can be directed to the corresponding author.
Author contributions
DP: Conceptualization, Writing–review and editing. LZ: Formal Analysis, Writing–review and editing. BW: Formal Analysis, Supervision, Writing–original draft. JJ: Data curation, Investigation, Writing–original draft. ZS: Methodology, Writing–review and editing. XZ: Formal Analysis, Writing–review and editing.
Funding
The author(s) declare financial support was received for the research, authorship, and/or publication of this article. This research was funded by Economic and Technological Research Institute Project of State Grid Anhui Electric Power “Research on the key technologies and commercial operation mode of station-grid synergistic optimization planning of regional integrated energy system to adapt to the synergistic development of ‘electricity–carbon’ market”, 521209220002.
Conflict of interest
Authors DP, LZ, BW, JJ, and ZS were employed by Economic and Technological Research Institute of State Grid Anhui Electric Power Company.
The remaining author declares that the research was conducted in the absence of any commercial or financial relationships that could be construed as a potential conflict of interest.
Publisher’s note
All claims expressed in this article are solely those of the authors and do not necessarily represent those of their affiliated organizations, or those of the publisher, the editors and the reviewers. Any product that may be evaluated in this article, or claim that may be made by its manufacturer, is not guaranteed or endorsed by the publisher.
References
Anderson, E., Xu, H., and Zhang, D. (2020). Varying confidence levels for cvar risk measures and minimax limits. Math. Program. 180, 327–370. doi:10.1007/s10107-018-01359-8
Cheng, H., Hu, X., Wang, L., Liu, Y., and Yu, Q. (2019). Review on research of regional integrated energy system planning. Automation Electr. Power Syst. 43 (7), 2–13. doi:10.7500/AEPS20180416006
Cheng, Y., Zhang, N., Wang, Y., Yang, J., Kang, C., and Xia, Q. (2018). Modeling carbon emission flow in multiple energy systems. IEEE Trans. Smart Grid 10 (4), 3562–3574. doi:10.1109/tsg.2018.2830775
Chi, K., Li, H., Zhang, J., Zhang, Z., Wang, T., Lin, L., et al. (2022). Research on wind power and pumped hydro storage based on IGDT-CVaR. Adv. Technol. Electr. Eng. Energy 41 (07), 1–9. doi:10.12067/ATEEE2111001
Ding, X., Zhang, X., and Wang, S. (2022). Low-carbon planning of regional integrated energy system considering optimal construction timing under dual carbon goals. High. Volt. Eng. 48 (7), 2584–2596. doi:10.13336/j.1003-6520.hve.20220138
Fan, H., Lu, J., and Lu, X. (2023). Coordinated planning of multi-region integrated energy system considering incentive demand response. Electr. Meas. Instrum. 60 (09). doi:10.19753/j.issn1001-1390.2023.09.017
Farrokhifar, M., Nie, Y., and Pozo, D. (2020). Energy systems planning: a survey on models for integrated power and natural gas networks coordination. Appl. Energy 262, 114567. doi:10.1016/j.apenergy.2020.114567
Fu, X., and Zhou, Y. (2022). Collaborative optimization of PV greenhouses and clean energy systems in rural areas. IEEE Trans. Sustain. Energy 14 (1), 642–656. doi:10.1109/tste.2022.3223684
Geidl, M., and Andersson, G. (2005). “Optimal power dispatch and conversion in systems with multiple energy carriers,” in Proc. 15th Power Systems Computation Conference, Liage, August 22-26, 2005 (IEEE).
Gong, H. (2017). Study on optimal power system dispatch with wind power integrated based on conditional value-at-risk thesis for master degree. China: Shandong University.
Hu, J. Z., Wang, X., Jiang, Z. W., and Cong, H. (2020). Optimal tiered carbon trading price of power system considering equilibrium of regional carbon emission. Autom. Electr. Power Syst. 44, 98–107. doi:10.7500/AEPS20190611005
Kang, C. (2021). Energy internet promotes the realization of “dual carbon” goals. J. Glob. Energy Interconnect. 4 (3), 205–206. doi:10.16418/j.issn.1000-3045.20220215001
Khaloie, H., Mollahassani-Pour, M., and Anvari-Moghaddam, A. (2020). Optimal behavior of a hybrid power producer in day-ahead and intraday markets: a bi-objective cvar-based approach. Ieee Trans. Sustain. Energy 12 (2), 931–943. doi:10.1109/tste.2020.3026066
Lei, Y., Wang, D., Jia, H., Li, J., Chen, J., Li, J., et al. (2021). Multi-stage stochastic planning of regional integrated energy system based on scenario tree path optimization under long-term multiple uncertainties. Appl. Energy 300, 117224. doi:10.1016/j.apenergy.2021.117224
Li, J. (2021). Dual carbon’ goals point out the direction for energy and power development. China: State Grid.
Liu, H., Zheng, N., Ge, S., Liu, J., Zhang, Q., and Hu, Y. (2021). Station and network coordinated planning of integrated energy systems considering of load complementation characteristic. Proc. CSEE 41 (01). doi:10.1016/j.gloei.2021.03.004
Lv, J., Zhang, S., Cheng, H., Han, F., Yuan, K., Song, Y., et al. (2021). Review on district-level integrated energy system planning considering interconnection and interaction. Proc. CSEE 41 (12), 4001–4021. doi:10.13334/j.0258-8013.pcsee.201592
Peng, C., Chen, S. W., Xu, J., Sun, H., and Zhang, P. (2022). Low carbon economic scheduling for integrated energy systems with mixed timescale and multi-objective reinforcement learning. Power Syst. Technol. 46 (12), 4914–4923. doi:10.1016/j.jclepro.2023.137922
Peng, K., Zhang, C., Xu, B., Chen, Y., and Zhao, X. (2017). Status and prospect of pilot projects of integrated energy system with multi-energy collaboration. Electr. Power Autom. Equip. 37 (6), 3–10. doi:10.16081/j.issn.1006-6047.2017.06.001
Pourakbari-Kasmaei, M., Asensio, M., Lehtonen, M., and Contreras, J. (2019). Trilateral planning model for integrated community energy systems and pv-based prosumers—a bilevel stochastic programming approach. Ieee Trans. Power Syst. 35 (1), 346–361. doi:10.1109/tpwrs.2019.2935840
Qin, T., Liu, H., Wang, J., Feng, Z., and Fang, W. (2018). Carbon trading based low-carbon economic dispatch for integrated electricity-heat-gas energy system. Automation Electr. Power Syst. 42 (14), 8–13. doi:10.7500/AEPS20171220005
Qu, K., Huang, L., Yu, T., and Zhang, X. (2018). Decentralized dispatch of multi-area integrated energy systems with carbon trading. Proc. CSEE 38, 697–707. doi:10.13334/j.0258-8013.pcsee.170602
Sheng, S., Li, L., and Meng, L. (2016). Low carbon economic dispatch of power system integrated with wind farms by considering uncertainties factors. Mod. Electr. Power 33 (2), 77–83. doi:10.19725/j.cnki.1007-2322.2016.02.013
Wang, Y., Hu, J., and Liu, N. (2023). Energy management in integrated energy system using energy–carbon integrated pricing method. IEEE Trans. Sustain. Energy 14, 1992–2005. doi:10.1109/tste.2023.3295573
Wang, Y., Wang, Y., Huang, Y., Yu, H., Du, R., Zhang, F., et al. (2019). Optimal scheduling of the regional integrated energy system considering economy and environment. Ieee Trans. Sustain. Energy 10 (4), 1939–1949. doi:10.1109/tste.2018.2876498
Wang, Z., Teng, Y., Yan, J., Jin, H., and Chen, Z. (2022). A new rural energy system planning method with consideration of energy resource cost and carbon emission trading benefit synergies. Proc. Chin. Soc. Electr. Eng., 7074–7087. doi:10.13334/j.0258-8013.pcsee.211613
Wei, Z., Ma, X., Guo, Y., Wei, P., Lu, B., and Zhang, H. (2022). Optimized operation of integrated energy system considering demand response under carbon trading mechanism. Electr. Power Constr. 43 (1), 11000–97229. doi:10.33619/2414-2948/81/38
Zhang, S., Wang, D., Cheng, H., Song, Y., and Yuan, K. (2022). Key technologies and challenges of low-carbon integrated energy system planning for carbon emission peak and carbon neutrality. Autom. Electr. Power Syst. 46 (08), 189–207. doi:10.7500/AEPS20210703002
Zhang, X., Fu, X., Xue, Y., Chang, X., and Bai, X. (2023). A review on basic theory and technology of agricultural energy internet. IET Renew. Power Gener. doi:10.1049/rpg2.12808
Zhang, X., Liu, X., and Zhong, J. (2020). Integrated energy system planning considering a reward and punishment ladder-type carbon trading and electric-thermal transfer load uncertainty. Proc. CSEE 40 (19), 6132–6142. doi:10.13334/j.0258-8013.pcsee.191302
Zhao, J., Yong, J., and Huan, J. J. (2020). Stochastic planning of park-level integrated energy system based on long time-scale. Electr. Power Autom. Equip. 40 (3), 62–67. doi:10.16081/j.epae.202003008
Zhou, R., Yao, L., Tong, X., Peng, S., and Li, S. (2012). Security economic dispatch in wind power integrated systems using a conditional risk method. Chin. Soc. Electr. Eng. 32, 56–63. doi:10.13334/j.0258-8013.pcsee.2012.01.012
Zhu, L., Zhang, L., Wang, B., Jia, J., Song, Z., Zhang, X., et al. (2023).Optimized operation of integrated energy system with carbon trading mechanism based on IGDT, 3rd International Conference on Energy Engineering and Power Systems (EEPS), 28 30 July 2023, USA. IEEE. doi:10.1109/EEPS58791.2023.10257031
Keywords: IES, multi-objective planning, carbon trading, low carbon, uncertainty
Citation: Pan D, Zhang L, Wang B, Jia J, Song Z and Zhang X (2024) Multi-objective planning of integrated energy system based on CVaR under carbon trading mechanism. Front. Energy Res. 12:1310301. doi: 10.3389/fenrg.2024.1310301
Received: 09 October 2023; Accepted: 22 January 2024;
Published: 14 February 2024.
Edited by:
Wenlong Fu, China Three Gorges University, ChinaReviewed by:
Hongxun Hui, University of Macau, ChinaYunning Zhang, China Three Gorges University, China
Copyright © 2024 Pan, Zhang, Wang, Jia, Song and Zhang. This is an open-access article distributed under the terms of the Creative Commons Attribution License (CC BY). The use, distribution or reproduction in other forums is permitted, provided the original author(s) and the copyright owner(s) are credited and that the original publication in this journal is cited, in accordance with accepted academic practice. No use, distribution or reproduction is permitted which does not comply with these terms.
*Correspondence: Xin Zhang, eGluemhhbmcyMDAwMTAyNkAxNjMuY29t