 Cai Shukai
 Guo Meng
- School of Economics and Management, Anhui Polytechnic University, Wuhu City, China
Firstly, based on the data of 40 cities in the Yangtze River Delta from 2010 to 2019, the paper uses the Unexpected Super-SBM model to estimate the green innovation efficiency of each city. On this basis, the paper establishes a Geographically Weighted Regression model to explore the spatial-temporal heterogeneity of the effects of influencing factors on green innovation efficiency. The findings indicate that: The direction and strength of each influencing element on the green innovation efficiency of the Yangtze River Delta cities are varied at the urban spatial scale. The degree of opening up significantly boosts the green innovation efficiency, but the impact intensity shows spatial differences. The green innovation efficiency is promoted by government technology support, but its intensity tends to weaken. In addition, financial support has a negative impact on most cities. Over time, the impact of economic development level on urban green innovation efficiency has changed from inhibition to promotion, and the impact intensity tends to weaken. Industrial structure and environmental regulation tend to show two effects of promotion and obstruction in different cities from weak inhibition. Industrial structure and environmental regulation tend to show two effects of promotion and obstruction in different cities from weak inhibition. The research conclusion of this paper has important theoretical significance and practical value for accelerating the construction of a green, low-carbon and circular economic system in the Yangtze River Delta region, and achieving the “dual carbon” goal.
1 Introduction
The Yangtze River Delta is one of China’s areas with the fastest economic growth, greatest degree of openness. It significantly affects the Chinese economy. High intensity development has led to very serious ecosystem damage and environmental pollution in it. Under these circumstances, with ever-stricter environmental regulations, the green innovation has become a crucial choice for regions to achieve economic growth and acquire competitive advantages since it is a crucial component to achieving a win-win aim of environmental conservation and technological advancement.
Fussler et al. (Fussler and James, 1996) originally put up the concept of green innovation in 1996. Its core refers to the profitable operations carried out by businesses to lessen environmental degradation. Efficiency in green innovation catalyzes regional economic development, which then influences the rate of national economic growth. And the carbon reduction effect of green innovation is not only highly valued by countries, but also increasingly receiving widespread attention from the academic community. Promoting green technology innovation and achieving green and low-carbon transformation has become an inevitable choice for China to build a new development pattern and adapt to the new stage of development. Therefore, it is crucial to investigate the driving forces behind the green innovation efficiency, which has drawn significant attention from academics. In addition, there are significant variances in the Yangtze River Delta’s prefecture-level cities’ levels of resource endowment, environmental conditions, technical advancement, and economic growth (Yunliang et al., 2021). Then what is the heterogeneity of the effect of each driving factor on green innovation efficiency in cities of the Yangtze River Delta? In this regard, most studies on heterogeneity are based on regional heterogeneity, industry heterogeneity and quantile-based heterogeneity. Yun Yang and Ying Wang explored the effect of environmental regulation on green innovation efficiency from the perspective of regional heterogeneity. The results showed that there was an obvious U-shaped relationship between environmental regulation and green innovation efficiency in China and the central and eastern regions. And the impact of environmental regulation on green innovation efficiency in the central and western regions was not obvious (Yang and Wang, 2021a). Tong Zhao et al. found that green finance, environmental regulations, and green innovation efficiency in the eastern region had a significant indigenous impact on regional heterogeneity. The ratio of the output value of the tertiary industry to the efficiency of green innovation in the central region had a significant impact, passing the significance test of 1% (Zhao et al., 2022). Feng Wu et al. divided the Yangtze River economic belt into “upstream, midstream and downstream”. They explored whether environmental regulation has an impact on the heterogeneity of green innovation production efficiency (Wu et al., 2022). Yongcan Yan et al. measured the green innovation efficiency of 29 manufacturing industries in China. The analysis found that the green innovation efficiency of 29 manufacturing industries differed significantly. And the convergence also differed in varying degrees (Yan et al., 2021). Chun Yang Liu et al. used the Quantile Regression method to study the influence degree and regional differences of various influencing factors on the green innovation efficiency of China’s high-tech industry under different quantiles. The results showed that in each cluster region, the factors that significantly affect the green innovation efficiency of high-tech industries were different and the impact of each factor on the innovation efficiency of different quantiles was also different (Liu et al., 2019). Scholars’ discussion of heterogeneity is still based on the assumption of homogeneity. Most of them use regression to explore heterogeneity by grouping samples, and the exploration of heterogeneity is insufficient. They also ignore the differences of the samples themselves, that is, the differences in the effects of various driving factors on the efficiency of green innovation caused by the different spatial and geographical locations of the samples.
The marginal contribution of this paper lies in: Based on the research of scholars, this paper incorporates the geographical location of each city into the regression parameters and uses the Geographically Weighted Regression model. Further, the temporal and spatial heterogeneity of the effects of various driving factors on green innovation efficiency is explored at the level of cities. Accurately grasping the spatial-temporal differences and dynamic evolution of green innovation efficiency determinants can help different cities determine the differentiated green development path, provide theoretical guidance for the creation of collaborative regional green innovation development policies, and have significant practical importance for t the cross regional collaborative improvement of innovation ability.
The other parts of this paper are organized as follows: Section 2 is the literature review of related topics. Section 3 is the Research Design. Section 4 is about measuring the efficiency of green innovation and analyzing its evolution patterns. Section 5 is empirical analysis. Section 6 is the policy recommendations and the shortcomings of this paper.
2 Literature review
Green innovation has “double externalities” (Feng and Chen, 2018) compared to conventional innovation, which can gain a “win-win" of economic progress and environmental advantages. Consequently, it is crucial to investigate the drivers for green innovation. The elements that motivate efficient green innovation have been extensively researched. Most scholars are based on national, regional, provincial (Liming et al., 2018; Yongfeng et al., 2020), and urban spatial scales. Other scholars start from specific industries (Feng et al., 2018; Luo et al., 2019). From the perspective of research content, it can be mainly divided into three categories. One is the linear impact of relevant factors on the efficiency of green innovation, mainly focusing on factors such as economic development level (Chengchao et al., 2020a), financial support (Liu et al., 2022), government science, and technology support (Yi et al., 2020). Lv Chengchao studied the impact of relevant factors on green innovation efficiency and found that research funding, financial development scale, the proportion of the secondary and tertiary industries inhibited the improvement of green innovation efficiency in China, while the number of research personnel, financial development efficiency, and per capita GDP could promote the efficiency of green innovation in China (Chengchao et al., 2020b). On this basis, some scholars based on environmental regulation (Yi et al., 2020; Yang and Wang, 2021b), foreign direct investment (Hongbin and Wenwen, 2020; Fei et al., 2021), and other factors which have a “two-way impact” mechanism on green innovation efficiency studied their influence mechanism with the threshold model and intermediary effect model. Peng Wenbin and Cheng Fangfang explored the threshold effect of formal and informal environmental regulations on green innovation from the perspective of optimal planning of provincial environmental costs, and concluded that there was a “U” shaped relationship between formal environmental regulations and green innovation efficiency, while informal environmental regulations had an inverted “U” shaped relationship with green innovation (Wenbin et al., 2017). Fan Fei and Zhang Xuerong used a mediation effect model to study and found that strengthening environmental regulations had a promoting effect on the efficiency of green innovation in cities along the Yangtze River Economic Belt, with a “N-shaped" relationship, in which FDI played a partial mediating role (Fei et al., 2021). Tian Hongbin and Hao Wenwen explored the impact of FDI inflows on green innovation efficiency under three types of environmental regulations based on the GML index, using threshold models and mediation effects models (Hongbin and Wenwen, 2020). The third type of research considers the possible spatial effects of green innovation efficiency, and studies the impact of various factors on green innovation efficiency by constructing a spatial econometric model. Zeng Bing constructed a spatial Durbin model to verify that the efficiency of inter provincial green innovation in China exhibited a significant positive spatial autocorrelation, and that per capita GDP had a significant negative spatial spillover effect with formal environmental regulations, while marketization had a significant positive spatial spillover effect (Bing, 2018). Similarly, the research results of He Yujing and Cai Danyang indicated that the efficiency of green technology innovation in industrial enterprises in the Yangtze River Delta had been increasing year by year and there was already a spatial agglomeration effect (Yujing and Danyang, 2021).
Researchers have explored the factors on green innovation efficiency from multiple perspectives and levels, and have drawn useful conclusions. However, there are still some deficiencies in the current research. First, the majority of the existing research is based on the provincial perspective. And the empirical research on the urban level needs to be further increased and enriched. The city is the most important space carrier to break through the innovative ecological structure. Second, most scholars’ studies are based on the assumption of homogeneity. Most studies on heterogeneity are based on regional heterogeneity (Yang and Wang, 2021b), industry heterogeneity (Jie and Huali, 2021) and quantile-based heterogeneity (Liu et al., 2019). The research on the influence of various factors on the heterogeneity of green innovation efficiency is insufficient. Therefore, the paper measures the green innovation efficiency and uses the GWR model to study the heterogeneous effects of relevant influencing factors on it of Yangtze River Delta’s prefecture-level cities.
3 Research Design
3.1 Research method
3.1.1 Unexpected Super-SBM model
The conventional DEA model emphasizes the same proportion change of input-output indicators, and it can only determine if a decision-making unit is DEA effective. On this basis, Tone proposed an SBM model taking relaxation variables into account. Assume there are n decision-making units (DMUs) with
where
(1) Determine input-output indicators and select representative input-output indicators such as energy consumption, human capital, etc.
(2) Constructing an unexpected output frontier: Using Data Envelopment Analysis (DEA) method to construct a production frontier guided by expected output.
(3) Calculate super efficiency value: By comparing the distance between each decision-making unit and the unexpected output front, calculate their relative super efficiency value.
From this, the efficiency values of each decision-making unit can be obtained, which represents the relative efficiency of each decision-making unit.
3.1.2 Kernel density estimation
By comparing the Kernel density function curves of different time periods, which represents the dynamic growth process of variables, it is possible to describe the absolute difference of them. The specific calculation formula is as follows:
Among them,
3.1.3 Standard deviation ellipse
Lefever first suggested the standard deviation ellipse, which is currently used to characterize the distribution and movement characteristics of geographical features in two-dimensional space. Using the center, major axis, and minor axis as its fundamental characteristics, it is primarily used to statistically define geographic features. The specific calculation formula is as follows:
Average center:
The Standard deviation of X-axis:
The Standard deviation of Y-axis:
(
3.1.4 Geographically weighted regression (GWR)
Brunsdon et al. suggested the GWR model. The main concept is to include the data’s location in the regression parameters, and observe the parameter changes caused by the change of spatial location. The GWR approach effectively extends the conventional linear regression model by estimating parameters using global information (Fei et al., 2021), making the estimation results more accurate.
Among them,
3.2 Variables selection
3.2.1 Variable being explained
In the paper, the Unexpected Super-SBM is used to measure the green innovation efficiency of cities. In this paper, gie represents it.
For investment index selection, the paper draws on the practices of Wu et al. (Chao et al., 2018), and Lv et al. (Chengchao et al., 2020a). The full-time equivalent of R&D personnel is used as personnel input, internal expenditure of R&D funds is used as financial input, and the total energy consumption (converted into standard tons of coal) is used as energy input. Considering the lag effect of capital investment, the paper uses the perpetual inventory method (Yanwei et al., 2020) to calculate the stock of R&D expenditure in cities as financial input.
For the expected outputs, the paper adopts the number of green patent applications and new product sales revenue. For the undesirable output, the paper incorporates the three industrial wastes as undesirable outputs into the model based on academic research. Besides, considering the strategy of “carbon peak” and “carbon neutrality”, carbon emissions are also included in the model.
3.2.2 Explanatory variable
Industrial structure. It plays a decisive role in alleviating the pressure on regional environment, and is closely related to the development of green technology innovation (Sun Yanming, 2021). The internal structure adjustment and transformation, industrial upgrading are beneficial to accelerating the growth of green technological innovation in local industries (Zhen et al., 2021). Industrial structure is an important explanatory variable in this model, measured by the ratio of the output value of the secondary and tertiary industries, and represented by ind.
Environmental regulation intensity. According to Porter’s Hypothesis, the “innovation compensation” benefit of appropriate environmental regulation is sufficient to compensate for cost effectiveness and increase corporate competitiveness. According to Jaffe and Palmer’s “weak Porter hypothesis”, green innovation is incentivized by environmental regulations, but the benefits that environmental regulations bring to enterprises are uncertain (Jaffe and Palmer, 2006). Based on the research of the aforementioned scholars, the carbon emissions per unit of GDP this year is selected as a proxy indicator for the environmental regulation, and represented by er.
The level of opening up. It has brought in foreign sophisticated technology and top-notch individuals, which is helpful in fostering an environment that encourages creativity and technical advancement. Some scholars also believe that foreign investment will have a “pollution shelter” effect, adding an environmental burden, and thus have a negative impact on the green innovation efficiency (Zaman and Moemen, 2017). The proportion of foreign direct investment utilized in the current year to GDP is used as a proxy variable for it, and its impact on the efficiency of green innovation is examined in this paper, and represented by fdi.
Level of economic development. It can provide the original impetus for green innovation efficiency (Chengchao et al., 2020a). When it grows, more resources, infrastructure, and top-tier talent will be made accessible to carry out green innovation activities, which may effectively stimulate the expansion of regional green innovation (Chengchao et al., 2020a). To investigate how it affects the green innovation efficiency, this study incorporates per capita GDP as a proxy variable for it into the model, and represented by PGDP.
Finance support. Financial assistance is crucial throughout the whole life cycle of innovative activities, from R&D investment through accomplishment transition to industrial production (Jian and Xiaofang, 2019). Financial assistance was added as an essential component in the model by Lv (Chengchao et al., 2020a), and other research, and the results showed that financial support had a considerable beneficial influence on green innovation efficiency. The fraction of loans from financial institutions in local GDP is used as a proxy variable in this article, and represented by fin.
Government’s technological support. The government directs market participants to engage in innovation activities and promotes regional green innovation efficiency via direct or indirect financial assistance (Yanwei et al., 2020). Yet, government R&D funding may have a “crowding out impact” on businesses (Junhong and Yuanchao, 2015), which is counterproductive to boosting the efficacy of green innovation. Based on this, this paper views government technical assistance as an element influencing the green innovation efficiency, and it utilizes the amount of money spent on science and technology in the overall government budget as its proxy variable, and represented by ti.
3.2.3 Control variable
The urbanization rate and population density of cities are different, and the innovative atmosphere and driving force are also different. Therefore, urban urbanization rate and population density are taken as control variables. The urbanization rate is calculated by the National Bureau of Statistics, that is, “urbanization rate = urban resident population/total population”. Population density is measured by the ratio of resident population to the administrative area.
3.3 Data sources
The study object for this paper is 40 cities in the Yangtze River Delta. Most of the data mainly comes from “China City Statistical Yearbook”, “Zhejiang Science and Technology Statistical Yearbook”, “Jiangsu Science and Technology Statistical Yearbook”, the statistical yearbook of prefecture-level cities, and related statistical bulletin, and the relevant data provided by the science and technology bureau of prefecture-level cities. The data on green patents comes from China National Patent Office. The latitude and longitude data used in the Geographically Weighted Regression model comes from the latitude and longitude query network in urban areas. Missing data are estimated by multiple linear interpolation method in STATA. The time window is 2010–2019.
4 The spatial-temporal evolution of green innovation efficiency
4.1 Temporal Evolution of green innovation efficiency
The paper measures the green innovation efficiency values of 40 cities, as shown in Table 1:
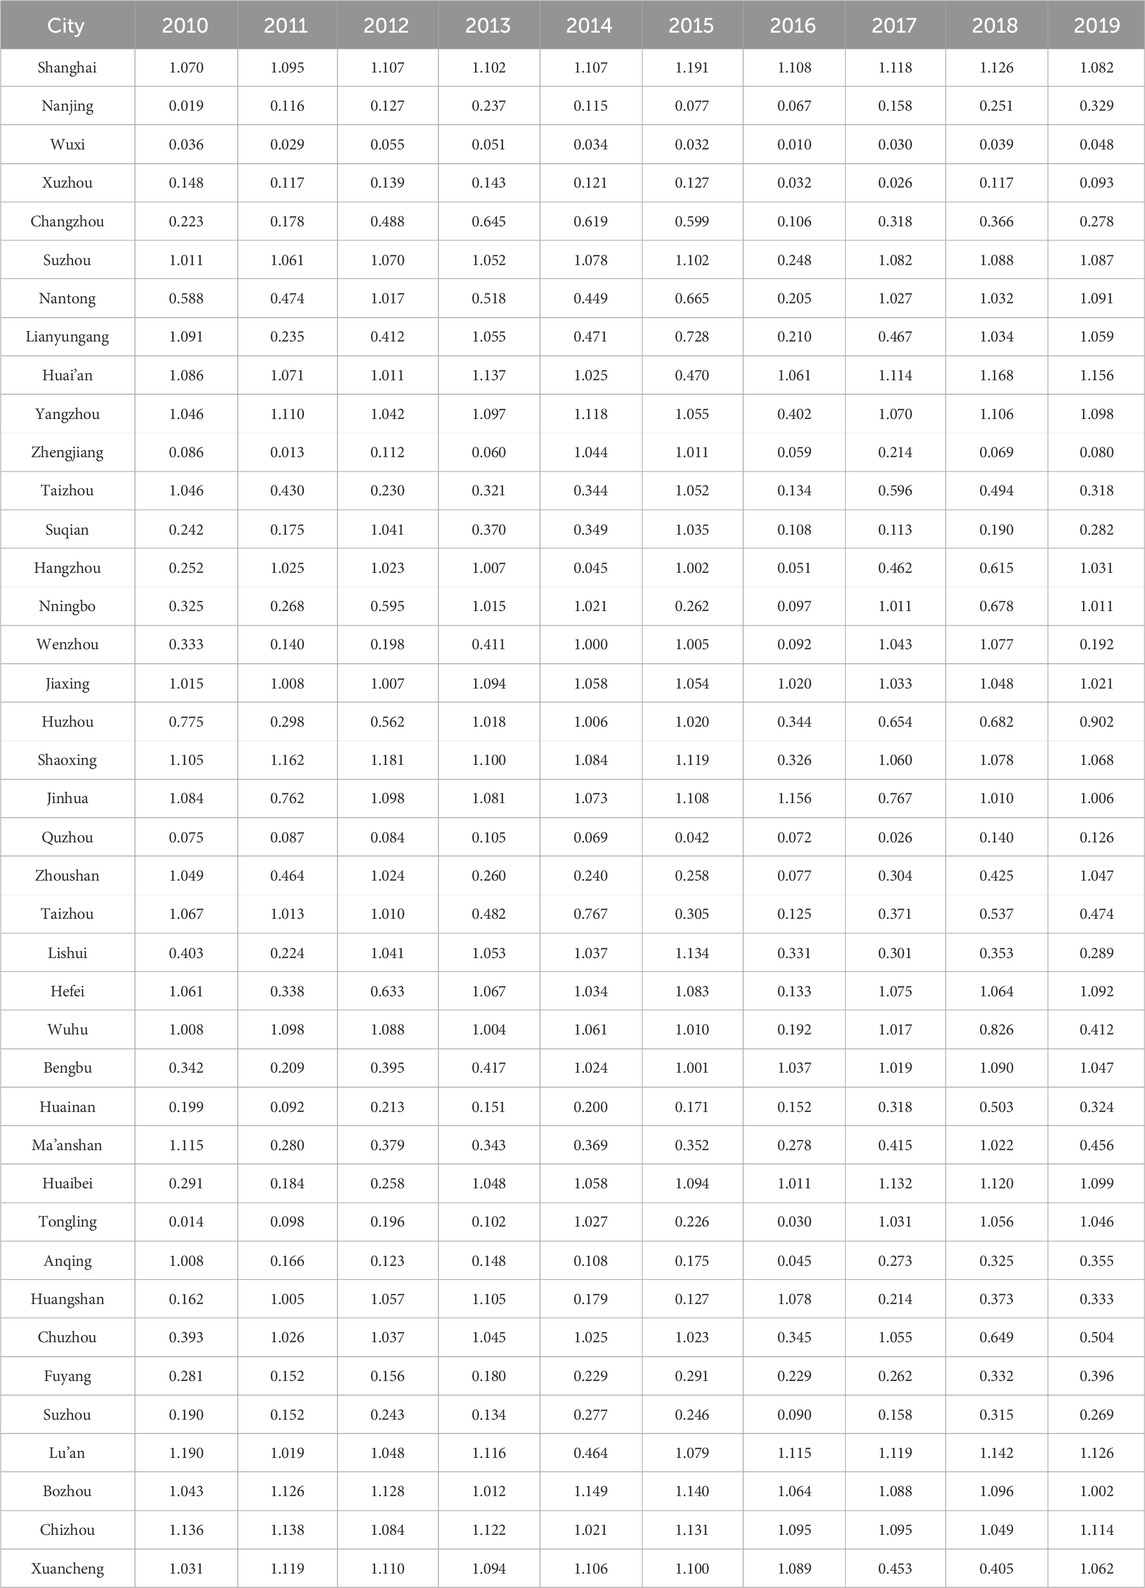
TABLE 1. Efficiency value of green innovation in cities of 40 cities from 2010 to 2019.
As can be seen from Figure 1, overall, the average value of green innovation efficiency of urban agglomeration in the Yangtze River Delta over the years is 0.805 at the maximum and 0.478 at the minimum, showing a fluctuating upward trend on the whole, which is consistent with the law obtained by Teng Tangwei et al. (Tangwei et al., 2023)to study the green innovation efficiency of cities in the Yangtze River Delta. From 2010 to 2015, the green innovation efficiency of each city has been rising. By 2015, the average green innovation efficiency reached a maximum of 0.782. Reflecting on this stage, China proposed to’ attach importance to ecological civilization, realize the coordinated development of green innovation. ‘ The local governments in the Yangtze River Delta region gradually attach importance to ‘ green technology innovation’ and take specific measures such as ‘ actively developing low carbon energy’ to guide and promote the green transformation and upgrading of the Yangtze River Delta region. The mean value of green innovation efficiency dropped to the lowest in 2016, which was 0.478. From 2017 to 2019, the average green innovation efficiency of cities fluctuated and increased. The reason may be the government proposed “ the implementation of the most stringent environmental protection system”, resulting in fluctuations in the efficiency of green innovation during the ‘13th Five-Year Plan’ period. After the 18th National Congress of the Communist Party of China, the Yangtze River Delta region actively implemented industrial transfer policies and the “cage for bird” plan, which effectively adjusted the tertiary structure of various cities in the Yangtze River Delta urban agglomeration, promoting the further agglomeration of technology-intensive and capital intensive industries, while the proportion of labor-intensive industries gradually decreased (Neng et al., 2023).
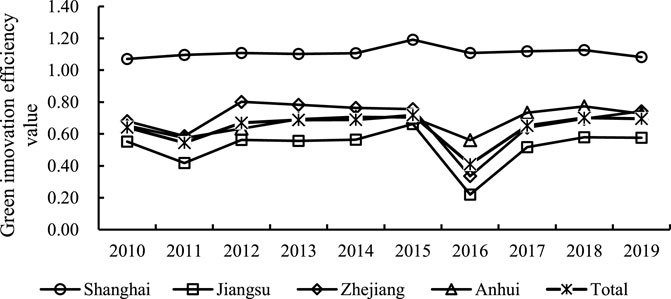
FIGURE 1. Average green innovation efficiency of three provinces and a municipality from 2010 to 2019.
In this paper, the nuclear density curves of 2010, 2013, 2015, 2017, and 2019 are used to study the time distribution of green innovation efficiency, and analyzes the development process of it, as shown in Figure 2.
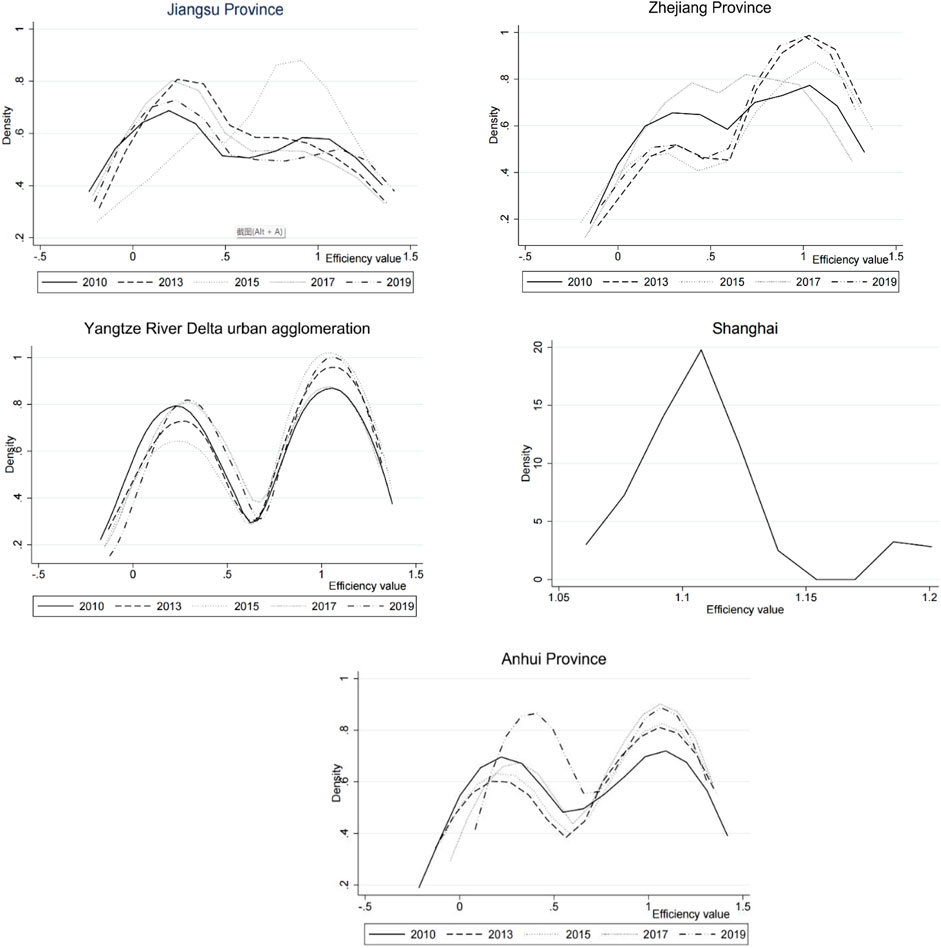
FIGURE 2. Kernel density curve of the Yangtze River Delta and three provinces and one centrally administered municipali-ty by year.
The Yangtze River Delta urban agglomeration’s Kernel density curve shows a fluctuating right shift overall. It also demonstrates the “bimodal” evolution characteristics that the peak height decreases first and then increases. It shows that the overall green innovation efficiency shows a fluctuating upward trend, and the internal green innovation efficiency difference first narrows and then expands and shows a polarized law. Certain cities’ green innovation efficiency is concentrated at a higher level (0.7–1.2), whereas other cities’ green innovation efficiency is concentrated at a lower level (0.2–0.4), indicating that the green innovation efficiency of the Yangtze River Delta urban agglomeration has strong regional heterogeneity imbalance characteristics (Zhiqiang et al., 2023a). The curve’s position changes to the right with time, demonstrating an improvement in the green innovation efficiency over the research period, which indicates that in recent years, the level of green innovation in the Yangtze River Delta urban agglomeration has gradually improved, the green innovation environment has been improving, and the green innovation capability has steadily improved (Zhiqiang et al., 2023a; Zhiqiang et al., 2023b). At the provincial level, Shanghai’s province Kernel density curve is right-skewed, with the vertical height of the peak growing as the horizontal breadth decreases and the horizontal width decreasing, and its kernel density tends to move in the direction of numerical reduction, that is, the gap of green innovation efficiency in Shanghai is narrowing, and there are dynamic convergence characteristics. The Kernel density curve of Anhui Province shows an overall movement to the right during the investigation period, the peak height fluctuate and increases, and there is an evolution trend of the right tailing phenomenon. The Kernel density curve of Jiangsu Province does not have multiple peaks during the investigation period, and also shows an obvious right tailing phenomenon. That is, during the research period, the effectiveness of green innovation in cities in Jiangsu Province has been increasing year by year, and the internal gap has gradually widened. The nuclear density curve of Zhejiang Province shifted to the right during the study period, with changes in peak height. The overall curve shifted to the right, showing a left skewed distribution without multiple peaks. It demonstrates that the green innovation efficiency of cities in Zhejiang Province has been steadily improving, although regional variations have grown year after year. This is consistent with Han Jin’s research conclusion, indicating that the environmental attention and regulatory intensity in economically developed regions such as Jiangsu, Zhejiang, and Shanghai in China are higher than those in regions with lower income levels such as the central and western regions (Jin, 2023).
4.2 Spatial distribution of green innovation efficiency
4.2.1 Spatial distribution characteristics of green innovation efficiency
As shown in Figure 3, the green innovation efficiency of the Yangtze River Delta region shows regional development imbalance, with “strong constant strong, weak constant weak”. From the provincial level, Shanghai has achieved the highest average green innovation efficiency during the past 10 years. Zhejiang Provinces’ green innovation efficiency has increased and is now in the second echelon because of the province’s increased implementation of environmental policies in recent years; Anhui province’s primary industry accounts for a relatively high proportion, and it can timely adapt to the requirements of green innovative development by undertaking industrial transfer from developed regions. Therefore, although the general level of green innovation efficiency in Anhui province has increased in the last 10 years, there is still a significant disparity between Anhui and Shanghai. The green innovation efficiency of Jiangsu Province has been in a relatively low state, which is generally lower than that of Zhejiang Province and Anhui Province. In addition, at the urban level, Shanghai, Xuancheng, Chizhou, Bozhou, Lu’an in Anhui Province, Shaoxing, Jinhua in Zhejiang Province, and Huai’an, Yangzhou in Jiangsu Province have had higher average green innovation efficiency over the years. Wuxi, Xuzhou in Jiangsu Province, Quzhou in Zhejiang Province, and Huainan, Fuyang, and Suzhou in Anhui Province have generally had low levels of green innovation efficiency over the years. Besides, the agglomeration of innovation elements in these metropolitan areas has a favorable innovation environment, which is favorable to boosting the green innovation efficiency in the area. Similarly, because of the concentration of innovation components in the metropolitan region, the polarization impact on the surrounding cities is stronger than the trickle-down effect, resulting in the outlying cities’ green innovation efficiency being poor.
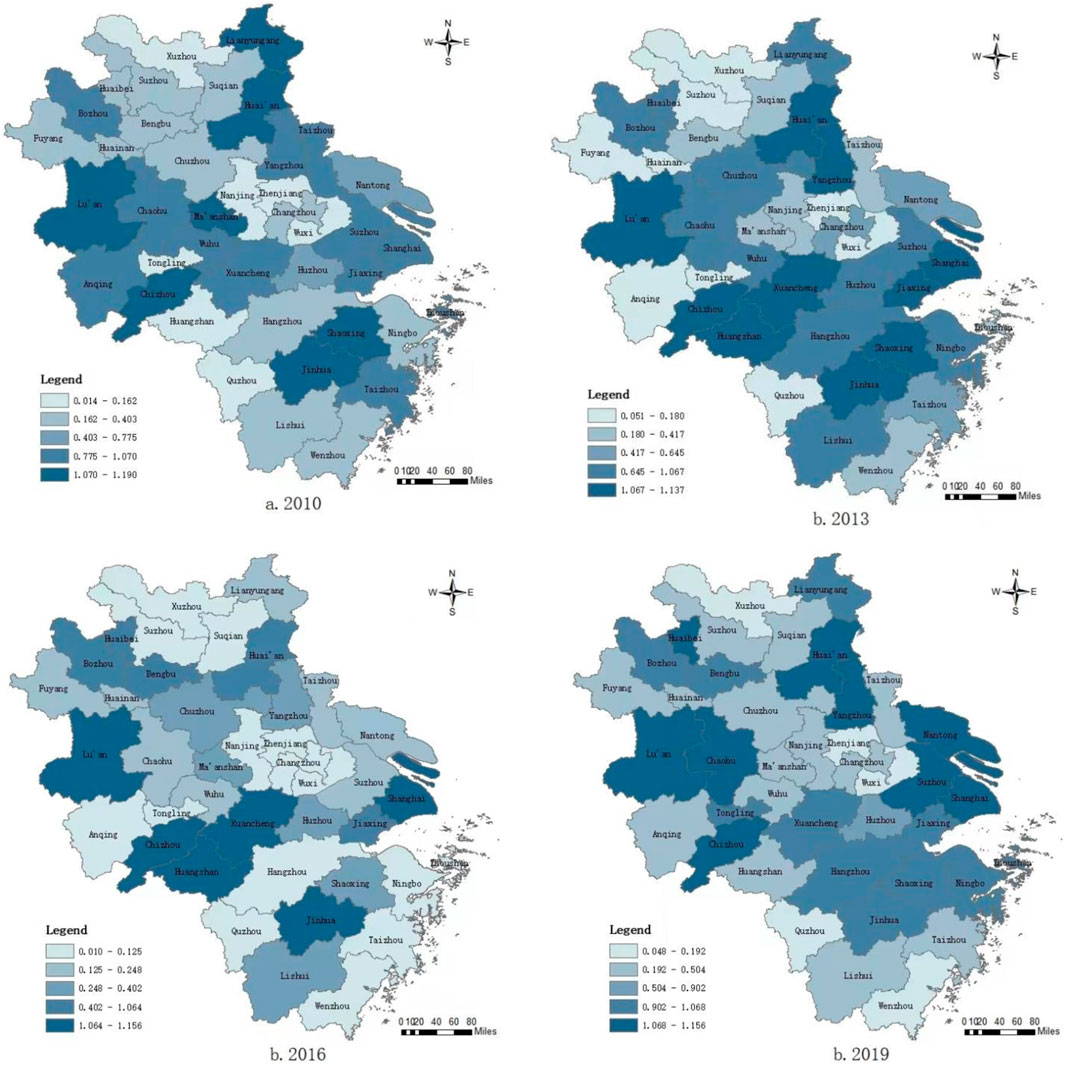
FIGURE 3. Spatial and temporal evolution of green innovation efficiency in Yangtze River Delta.
4.2.2 Spatial dynamic evolution law of green innovation efficiency
As shown in Figure 4, the spatial evolution features of green innovation efficiency in the Yangtze River Delta region are clear, exhibiting the characteristics of southeast-northwest and eventually shifting to northeast, which is consistent with the standard deviation of China’s industrial green technology innovation efficiency and the large direction of the center of gravity shift of the ellipse (Decheng and Xiaolin, 2022).
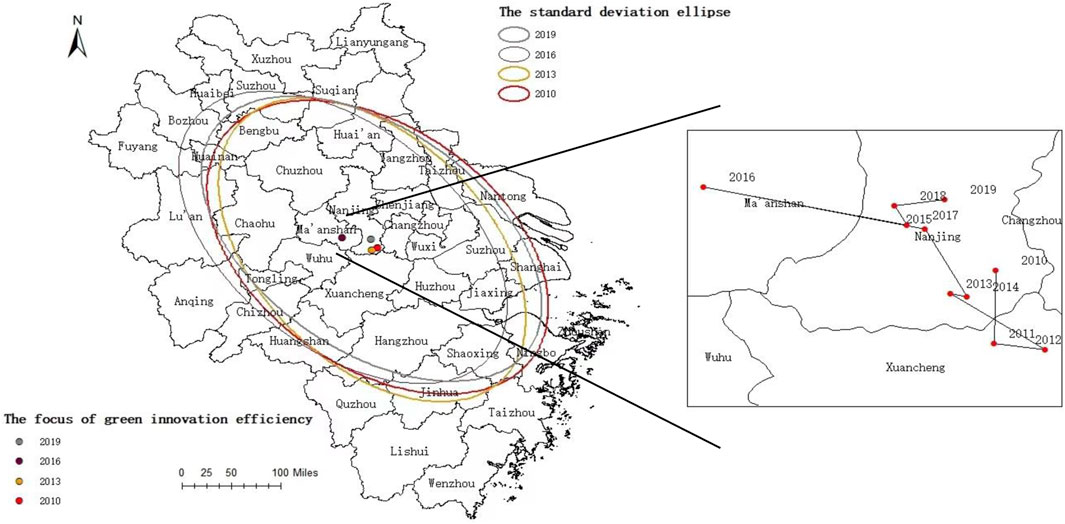
FIGURE 4. Green innovation efficiency standard deviation ellipse and center of gravity moving track.
As shown in Figure 5, the ellipse area shrinks first and then expands, indicating that the distribution of green innovation efficiency expands first and then shrinks. From the center of gravity, direction and scope of the ellipse, the following mainly describes the spatial dynamic changes of it. According to the movement of the center of gravity for green innovation efficiency during the years 2010–2015, it first shifted to the southeast before moving to the northwest. From the distance, the distance to the northwest is greater than the southeast. From 2015 to 2017, the focus on green innovation efficiency first shifted to the northwest, and then returned to the southeast. The coastal cities in the northeast have superior geographical location and high level of economic development. They have formulated more stringent environmental regulation policies and promoted green development through technical and scientific innovation, which has mostly pushed the focus on green innovation efficiency to move like the Northeast.
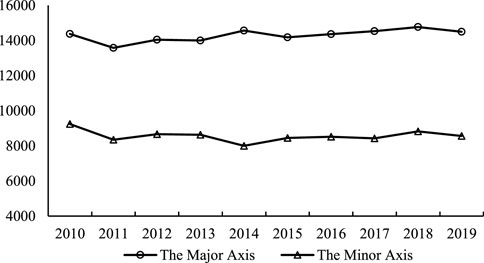
FIGURE 5. The changes in the long and short axes of the standard deviation ellipse of green innovation efficiency.
From the distribution shape of the standard deviation ellipse, during 2010–2014, the major axis and the minor axis showed a decreasing trend, and the ellipse area decreased, demonstrating that the green innovation efficiency is decreasing in the southeast-northwest direction; From 2015 to 2019, the long and short axes both rose, as did the circular area, indicating a dispersion tendency for green innovation efficiency in the northwest and southeast. It demonstrates that the green innovation efficiency differs substantially throughout the Yangtze River Delta urban agglomeration.
5 Authentic proof analysis
5.1 Descriptive statistical analysis
Table 2 displays the mean, standard deviation, maximum, and lowest of variables.
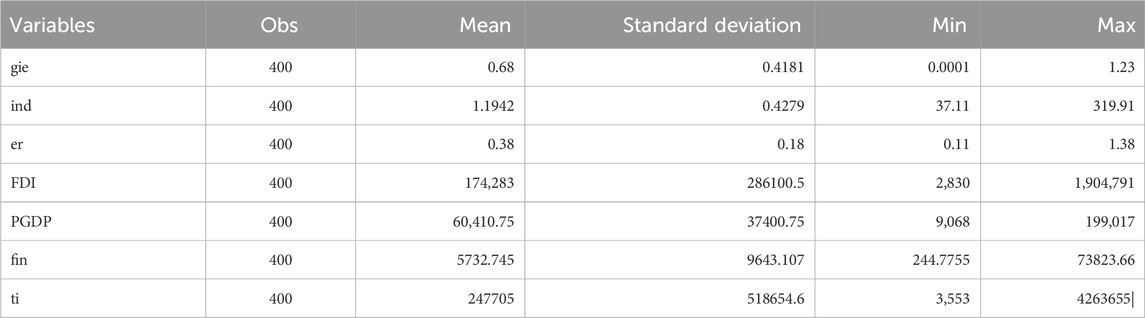
TABLE 2. Descriptive statistical analysis of variables.
5.2 Model selection
To investigate the elements that influence the green innovation efficiency, scholars originally used the Panel Tobit model to examine how different variables affect the green innovation efficiency. On this basis, researchers use the aforementioned variables as threshold variables to build a panel threshold model or take into account their intermediary effects (Yi et al., 2020; Liu et al., 2022) to investigate the nonlinear influence of particular variables such as environmental regulation, opening-up on it. Besides, the spatial distribution of samples is also closely related to the agglomeration and diffusion of green innovation efficiency. So some scholars use spatial econometric models to study their spatial effects (Jaffe and Palmer, 2006; Yang and Wang, 2020).
To describe the differences in the direction and intensity of each influencing factor on each research object. The paper introduces the geographical location of the observation sample into the regression parameters, constructs the Geographically Weighted Regression model, and studies the difference in the mechanism of the influence factors on each city to make up for the deficiency of scholars.
From the fitting results of the OLS and GWR in Table 3, it is clear that the GWR model has a far greater goodness of fit than the OLS Regression. When the difference between the values of AICc is more than 3, the model with low AICc is regarded as the model with a better fitting effect. That is, the Geographically Weighted Regression model fits better.
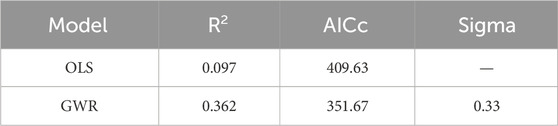
TABLE 3. The fitting effect table of the OLS model and GWR model.
5.3 Empirical results
The regression coefficients of each variable are shown in Table 4. More than 85% of them passed the significance test of 10%. The regression results for 2010 and 2019 are shown in Figure 5. 1In the GWR estimate, the effects of influencing variables on green innovation efficiency exhibit clear trends and regional disparities. That is, the influence direction and intensity of each factor on green innovation efficiency in different cities is different.
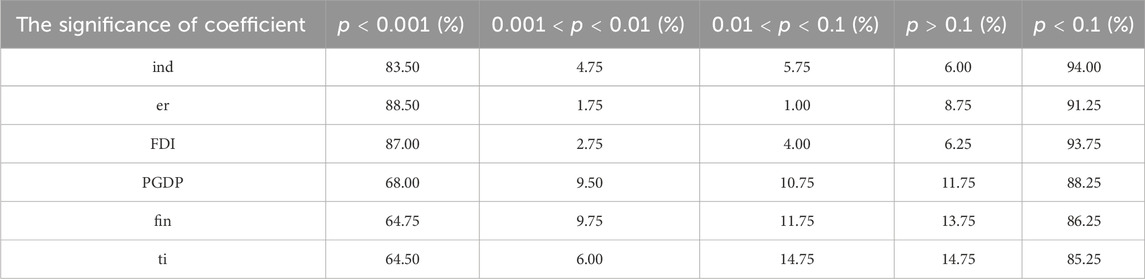
TABLE 4. The significance of regression coefficients of variables.
Industrial structure. Figure 6A demonstrates that the direction and intensity of its influence on cities’ green innovation efficiency are essentially the same, although there are slight variances. In the direction of influence, the green innovation efficiency is positively impacted by the industrial structure in Xuzhou, Hangzhou, Zhoushan, Lu’ an, 2010 and 2019. It may be due to the gradual elimination of high energy consumption and high pollution industries with industrial transformation and upgrading, and the gradual realization of advanced and rationalized industrial structure, which improves resource utilization efficiency, reduces environmental pollution, conforms to the concept of green innovation development, and improves the efficiency of green innovation (Huizhong et al., 2022). The green innovation efficiency of Ningbo and Taizhou is influenced by the industrial structure, and the effect has shifted from promoting to inhibiting. In 2010 and 2019, the green innovation efficiency of other cities is negatively affected by the industrial structure. In terms of impact intensity, it can be concluded from Figure 6A that for the four cities of Shanghai, Ningbo, Wenzhou, and Taizhou, industrial structure has a far higher influence on green innovation efficiency in 2010 than it does in 2019. The findings suggest that the change of industrial structures in Shanghai, Ningbo, Wenzhou, and Taizhou is beneficial to green innovation efficiency from 2010 to 2019.
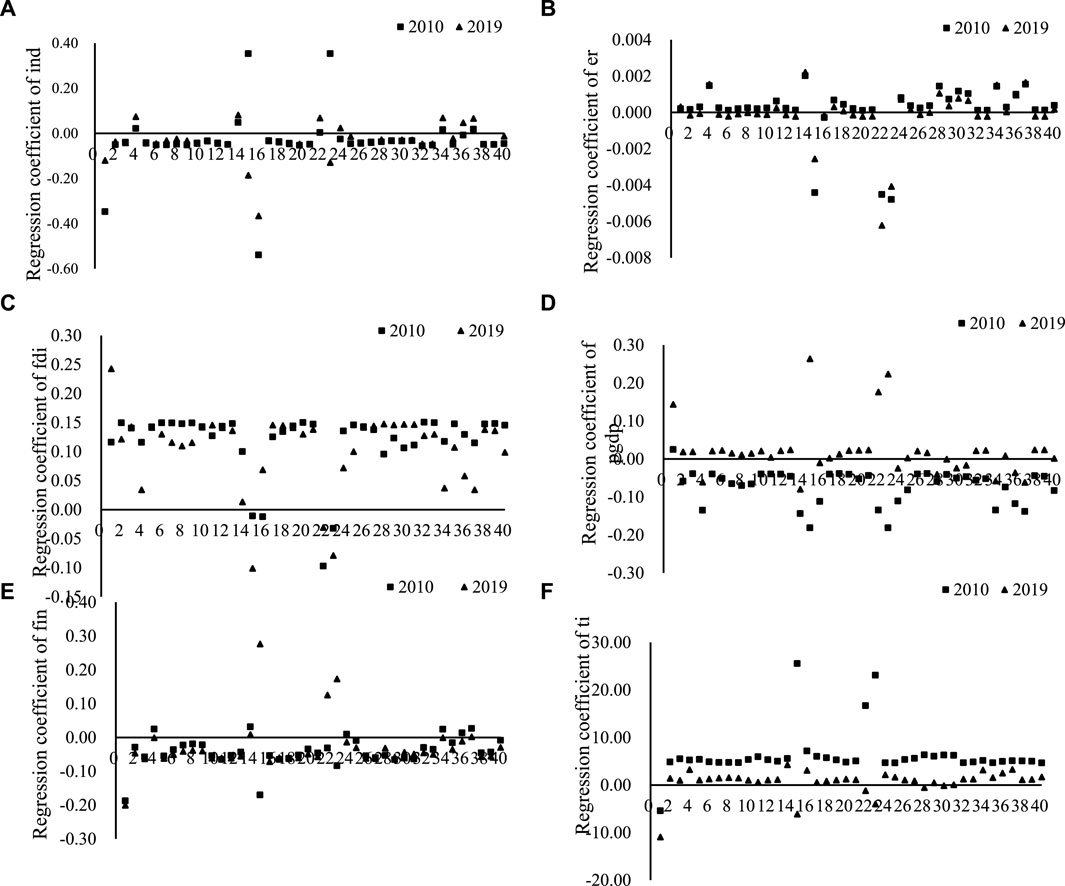
FIGURE 6. Time series evolution diagram of regression coefficients of each explanatory variable.
Environmental regulation intensity. In this paper, the proxy variable for environmental regulatory intensity is the quantity of CO2 emitted per unit of GDP. The smaller the value, the more intense the environmental control, and vice versa. Figure 6B shows that the direction and severity of environmental limitations’ impacts on green innovation efficiency are inconsistent and imbalanced. In terms of impact direction, over 80% of cities in Zhejiang Province and a small portion of cities in Anhui Province are affected by environmental regulations, and the impact direction is completely opposite in 2010 and 2019. That is to say, in 2010, environmental regulations has a beneficial impact on the aforementioned regions. It indicates that implementing reasonable and effective environmental regulatory policies in these regions can achieve dual externalities of green technology innovation and improve the efficiency of green innovation (Shen et al., 2022). In 2019, if environmental intensity increases, it may contribute to promoting green innovation efficiency. The environmental regulation has a much bigger influence on green innovation efficiency in Xuzhou, Hangzhou, Ningbo, Zhoushan, Taizhou, Huainan, Huangshan, and Luan between 2010 and 2019 than it did in other cities.
The level of opening up Figure 6C shows that the green innovation efficiency of each city is influenced by it in the same direction, but with slightly different intensities. The green innovation efficiency of most cities in the Yangtze River Delta is promoted by it. At present, the new foreign investment management system of “national treatment before entry + negative list management + foreign investment promotion policy” has promoted a higher level of opening up. Moreover, it emphasizes the introduction of “high-end manufacturing, intelligent manufacturing, green manufacturing, and other industries”, fosters a positive environment for innovation. And opening up to the outside world is beneficial for enhancing the innovation vitality of small and medium-sized enterprises in market competition, stimulating enterprises to increase their knowledge reserves through market introduction, learning, communication, and other means, and further promoting the improvement of green innovation efficiency in the Yangtze River Delta region (Liu et al., 2019). In terms of impact intensity, for half of the cities, the green innovation efficiency is less affected by the extent of the opening-up in 2019 than it is in 2010, which are mainly distributed in Anhui and southern Jiangsu. The effect of the level of opening up on the green innovation efficiency throughout the research period has been lessened in these locations.
Economic development level. Figure 6D shows that the impact of it on the green innovation efficiency in most cities in Zhejiang and Jiangsu provinces is different in 2010 and 2019. In 2010, lower levels of it has a inhibitory effect on the green innovation efficiency; In 2019, a higher level of it has a promoting effect on the green innovation efficiency, which demonstrates that regions with high levels of economic development are able to draw top-tier scientific and technical talent (Shengrong and Liangwen, 2019). And with complete infrastructure and R&D equipment, it can ensure the smooth implementation of innovation activities, provide financial support for green technology innovation activities, and effectively promote the research, development, and transformation of green technology innovation achievements (Sun Yanming, 2021). However, in 2010 and 2019, the green innovation efficiency in most areas of Anhui is negatively affected by the level of economic development, showing that by 2019, the region’s level of economic growth will not be able to support the expansion of green innovation efficiency. In terms of effect intensity, economic development level has a generally greater influence on green innovation efficiency in 2010 than it does in 2019. That is to say, for Yangtze River Delta prefecture-level cities, the influence on green innovation efficiency is strong when economic growth is low, and when the degree of economic growth is high, the boosting influence on the green innovation efficiency is lowered. The “shortboard effect” of green innovation efficiency restrictions increasingly diminished as economic growth levels rose over time.
Financial support. It can be seen from Figure 6E that the influence of direction and intensity of financial support on green innovation efficiency in 2010 and 2019. The direction of influence is generally negative, that is, for the majority of cities in 2010 and 2019, financial support has a hindering and inhibiting effect on green innovation efficiency. At present, provincial-level local financial regulatory bureaus have been established in provinces such as Shanghai, Jiangsu, Zhejiang, and Anhui. However, local financial supervision bureaus have not been established in all cities and counties. In addition, some municipal and county governments delegate their regulatory responsibilities to the Development and Reform Commission or other competent departments of industries. This creates tension between financial supervision and industrial development, which is unfavorable to urban green innovation.
Government technology support. Figure 6F demonstrates that the efficiency of green innovation is positively affected by it, and the impact intensity in 2010 exceeded that in 2019. But at the same time section, the influence strength difference is not obvious. Yangtze River Delta region spends more money on research and development each year, providing material support for green innovation activities. It indicates that the government reduces the technological innovation risks of enterprises through direct financial support and other means, creating a good innovation atmosphere in cities to a certain extent, motivating enterprises to carry out innovation activities, weakening the cost squeezing effect of green innovation, and promoting the improvement of green innovation efficiency (Huizhong et al., 2022; Yu et al., 2022).
6 Research conclusions and policy recommendations
6.1 Research conclusions
Based on the above analysis, the following conclusions can be drawn:
During the study period, the difference of regional green innovation efficiency first narrowed and then expanded, and shows the law of polarization. In space, there is an uneven distribution of “the strong is always strong and the weak is always weak”, and cities with a high green innovation efficiency are concentrated in the metropolitan area. In addition, The Yangtze River Delta urban agglomeration has clear spatial evolution features of green innovation efficiency and the green innovation efficiency center of gravity generally presents the characteristics of southeast to northwest, and finally shifts to northeast.
At the urban spatial scale, the direction and strength of each influencing element on the green innovation efficiency of the Yangtze River Delta prefecture-level cities are varied at the urban spatial scale. The degree of opening up significantly boosts the green innovation efficiency, but the impact intensity shows spatial differences. The green innovation efficiency is promoted by government technology support, but its intensity tends to weaken. In addition, financial support has a negative impact on most prefecture-level cities. Over time, the impact of economic development level on urban green innovation efficiency has changed from inhibition to promotion, and the impact intensity tends to weaken. Industrial structure and environmental regulation tend to show two effects of promotion and obstruction in different cities from weak inhibition. Industrial structure and environmental regulation tend to show two effects of promotion and obstruction in different cities from weak inhibition.
6.2 Policy suggestion
Based on the above analysis, the following suggestions are proposed for the development of green innovation efficiency in the Yangtze River Delta:
First, construct a demonstration area for ecological and green integrated development. To support the creation of a development of green innovation, policies and actions should be coordinated around scientific and technical innovation, industrial development, ecological environment, and other issues. Specifically, we will promote the transfer and transformation of technology, sharing resources for technology and science, the exchange of scientific and technological talents, and the Yangtze River Delta’s coordination of scientific and technology policy. We should accelerate the formation of policy synergy in reform integration, capital investment, project arrangement, resource allocation. Second, increase investment in green innovation R&D. Empirical analysis shows that government technology support has a promoting effect on green innovation efficiency. The government should further increase financial support for green innovative technologies and projects. Based on full investigation and research, allocate funds reasonably, improve the efficiency of fund utilization, and implement the financial science and technology funds. Third, scientifically formulate policies for introducing foreign investment. Fourth, improve the environmental regulatory system. Continuously optimize industrial structure, accelerate the construction of digital technologies such as big data and artificial intelligence, promote the penetration of digital economy and digital technology into traditional high energy consuming industries, and accelerate the green and low-carbon transformation of energy consumption structure. In addition, in the process of promoting the digitization of traditional manufacturing, regions need to empower the manufacturing industry, improve resource allocation efficiency, promote industrial intensification, and achieve leapfrog development of the manufacturing industry by improving green innovation efficiency. Finally, considering the differences in urban resource endowment and development, we should develop in a staggered manner and shape our own green innovation advantages. Empirical analysis shows that the effects of various explanatory variables on the efficiency of urban green innovation exhibit heterogeneity. Therefore, in order to fully consider the current development status, resource endowment, and location advantages of the city itself in the process of policy formulation and implementation, staggered development is necessary. Improve the market mechanism and government guidance for green innovation resources, actively build complementary green innovation cooperation platforms, actively cultivate the green innovation advantages of cities, and leverage the comparative advantages of each city according to local conditions to improve the efficiency of urban green innovation. Develop green industry development plans from dimensions such as spatial layout, industrial chain, and value chain, so that the overall region and cities can benefit from integration. Establish a dialogue and consultation mechanism for industrial development planning between cities, promote green industry cooperation, complementarity, and staggered development between cities, and promote mutual benefit and win-win situation between cities.
6.3 Limitations and prospects
This article also has the following shortcomings: 1) Using the super SBM model to measure the efficiency of green innovation. On this basis, this article uses the GWR model for empirical research. Although the estimation results have been well explained, this article did not consider the possible spatial effects of variables. 2) The Yangtze River Delta region is increasingly showing a multi center and networked spatial development phenomenon. However, this article uses urban panel data, with cities as independent samples, without considering the possible impact of the networked pattern of the Yangtze River Delta urban agglomeration on variables.
Therefore, in the following research, the potential spatial spillover effects of green innovation efficiency will be fully considered, and the current situation of the multi center network of the Yangtze River Delta urban agglomeration will be studied. We hope to draw more meaningful conclusions in the next step of research, which will supplement and improve the research in this article.
Data availability statement
The datasets presented in this study can be found in online repositories. The names of the repository/repositories and accession number(s) can be found below: The study object for this paper is 40 cities in the Yangtze River Delta. Most of the data mainly comes from “China City Statistical Yearbook”, “Zhejiang Science and Technology Statistical Yearbook”, “Jiangsu Science and Technology Statistical Yearbook”, the statistical yearbook of prefecture-level cities, and related statistical bulletin, and the relevant data provided by the science and technology bureau of prefecture-level cities. The data on green patents comes from China National Patent Office. The latitude and longitude data used in the Geographically Weighted Regression model comes from the latitude and longitude query network in urban areas. Missing data are estimated by multiple linear interpolation method in STATA. The time window is 2010–2019.
Author contributions
CS: Conceptualization, Project administration, Writing–original draft, Writing–review and editing. HB: Writing–original draft, Methodology, Software. GM: Conceptualization, Formal Analysis, Writing–original draft, Writing–review and editing.
Funding
The author(s) declare financial support was received for the research, authorship, and/or publication of this article. This work was financially supported by 2022 National Social Science Fund Project (22Bjl064), Natural Science Foundation of Anhui Provincial (2108085MG245), 2022 Anhui Postgraduate Academic Innovation Project (2022xscx096), 2023 Anhui Province University Philosophy and Social Sciences Excellent Research and Innovation Team “Yangtze River Delta Integration and High Quality Industrial Development” (2023AH010014), 2022 Anhui Province University Discipline (Major) Top Talent Academic Support Project (gxbjZD2022022), Key Projects of Anhui Provincial Philosophy Planning Project (AHSKZ 2019D028).
Acknowledgments
Thank you to the science and technology departments and statistical bureaus of various cities in the Yangtze River Delta for providing the data.
Conflict of interest
The authors declare that the research was conducted in the absence of any commercial or financial relationships that could be construed as a potential conflict of interest.
Publisher’s note
All claims expressed in this article are solely those of the authors and do not necessarily represent those of their affiliated organizations, or those of the publisher, the editors and the reviewers. Any product that may be evaluated in this article, or claim that may be made by its manufacturer, is not guaranteed or endorsed by the publisher.
References
Bing, Z. (2018). The influencing factors and spatial spillover effect of interprovincial green innovation efficiency in China. Contemp. Econ. Manag. 40, 59–63. doi:10.13253/j.cnki.ddjjgl.2018.12.009
Chao, W., Yang, S. W., Pengcheng, T., Ting, W., and Shuke, F. (2018). Construction of green innovation efficiency promotion model for China’s heavy pollution industry. China’s Popul. Resour. Environ. 28, 40–48.
Chengchao, L., Changhua, S., and Yue, C. (2020a). The spatio-temporal evolution rule and influencing factors of China’s green innovation efficiency. Res. financial issues 445, 50–57. doi:10.19654/j.cnki.cjwtyj.2020.12.006
Chengchao, L. V., Changhua, S., and Yue, C. (2020b). The spatio-temporal evolution rule and influencing factors of China’s green innovation efficiency. Res. financial issues 445, 50–57. doi:10.19654/j.cnki.cjwtyj.2020.12.006
Decheng, F., and Xiaolin, W. (2022). Research on the spatio-temporal evolution characteristics and coordination of China’s industrial green technology innovation efficiency. Inq. Into Econ. Issues, 1–15.
Fei, F., Xuerong, Z., and Huan, L. (2021). Impact of environmental regulations on green innovation efficiency of the Yangtze River Economic belt: intermediary effect test based on foreign direct investment. Sci. Technol. Manag. Res. 41, 191–196.
Feng, Z., and Chen, W. (2018). Environmental regulation, green innovation, and industrial green development: an empirical analysis based on the Spatial Durbin model. Sustainability 10, 223. doi:10.3390/su10010223
Feng, Z., Zeng, B., and Ming, Q. (2018). Environmental regulation, two-way foreign direct investment, and green innovation efficiency in China’s manufacturing industry. Int. J. Environ. Res. Public Hhealth 15, 2292. doi:10.3390/ijerph15102292
Fussler, C., and James, P. (1996). Driving eco-innovation: a breakthrough discipline for innovation and sustainability. United States: Pitman Pub.
Hongbin, T., and Wenwen, H. (2020). FDI, Environmental regulation and green innovation efficiency. China Soft Sci. 356, 174–183.
Huizhong, D., Zhengxu, C., and Renjie, Z. (2022). Two-stage green innovation efficiency and influencing factor identification in China’s high-tech industry. Stat. Decis. 38, 44–49. doi:10.13546/j.cnki.tjyjc.2022.06.009
Jaffe, A. B., and Palmer, K. (2006). Environmental regulation and innovation: a panel data study. Rev. Econ. Stat. 79, 610–619. doi:10.1162/003465397557196
Jian, L., and Xiaofang, M. (2019). Comparative analysis of the time-space differences and influencing factors of cities’ innovation efficiency in Beijing-Tianjin-Hebei. Syst. Eng. 37, 51–61.
Jie, H., and Huali, J. (2021). Regional differences and dynamic evolution of green innovation efficiency in China. Stat. decis. 67–71. doi:10.13546/j.cnki.tjyjc.2021.21.013
Jin, H. (2023). Research on the coordinated development of green technology innovation efficiency and ecological welfare performance——taking Zhejiang Province as an example. J. Party Sch. CPC Ningbo 45, 85–97. doi:10.16444/j.cnki.cn33-1228/d.2023.02.010
Junhong, B., and Yuanchao, B. (2015). Does government support promote IUR synergy innovation. Stat. Res. 32, 43–50. doi:10.19343/j.cnki.11-1302/c.2015.11.006
Liming, X., Junfeng, G., and Bin, H. (2018). Spatial spillover effects of provincial green innovation efficiency in China—homogeneity and heterogeneity test. J. Ind. Technol. Econ. 37, 30–38. doi:10.3969/j.issn.1004-910X.2018.04.004
Liu, C., Gao, X., Ma, W., and Chen, X. (2019). Research on regional differences and influencing factors of green technology innovation efficiency of China’s high-tech industry. J. Comput. Appl. Math. 369, 112597. doi:10.1016/j.cam.2019.112597
Liu, Y., Yang, Y., Zheng, S., Xiao, L., Gao, H., and Lu, H. (2022). Dynamic impact of technology and finance on green technology innovation efficiency: empirical evidence from China’s provinces. Int. J. Environ. Res. Public Health 19, 4764. doi:10.3390/ijerph19084764
Luo, Q., Miao, C., Sun, L., Meng, X., and Duan, M. (2019). Efficiency evaluation of green technology innovation of China’s strategic emerging industries: an empiricalanalysis based on Malmquist-data envelopment analysis index. J. Clean. Prod. 238, 117782. doi:10.1016/j.jclepro.2019.117782
Neng, S., Lin, Z., and Jing, Z. (2023). Spatial-temporal characteristics and dynamic evolution of green innovation efficiency in Yangtze River Delta urban agglomeration. J. Nant. Univ. Sci. Ed. 39, 37–48.
Shen, T. T., Li, D. J., Jin, Y. Y., and Li, J. (2022). Impact of environmental regulation on efficiency of green innovation in China. Atmosphere 13, 767. doi:10.3390/atmos13050767
Shengrong, L., and Liangwen, L. (2019). The dynamic effect of international R&D capital technology spillovers on the efficiency of green technology innovation. Sci. Res. Manag. 40, 21–29. doi:10.19571/j.cnki.1000-2995.2019.03.003
Sun Yanming, S. S. (2021). The spatio-temporal evolutionary pattern and driving forces mechanism of green technology innovation efficiency in the Yangtze River Delta region. Geogr. Res. 40, 2743–2759. doi:10.11821/dlyj020210102
Tangwei, T., Yajun, P., Shengpeng, W., and Han, B. (2023). Evolution and driving factors of spatial network structure of green innovation efficiency in the Yangtze River DeltaResour. Environ. Yangtze Basin 32, 1335–1348.
Wenbin, P., Fangfang, C., and Jianglin, L. (2017). A study on the threshold effect of environmental regulation to provincial green innovation efficiency. South China J. Econ. 12. doi:10.3969/j.issn.1000-6249.2017.09.005
Wu, F., Fu, X., Zhang, T., Wu, D., and Sindakis, S. (2022). Examining whether government environmental regulation promotes green innovation efficiency—evidence from China’s Yangtze River Economic belt. Sustainability 14, 1827. doi:10.3390/su14031827
Yan, Y., Li, J., and Xu, Y. (2021). Research on industry difference and convergence of green innovation efficiency of manufacturing industry in China based on super-SBM and convergence models. Math. Problems Eng. 2021, 1–12. doi:10.1155/2021/4013468
Yang, Y., and Wang, Y. (2021a). Research on the impact of environmental regulations on the green innovation efficiency of Chinese industrial enterprises. Pol. J. Environ. Stud. 30, 1433–1445. doi:10.15244/pjoes/125767
Yang, Y., and Wang, Y. (2021b). Research on the impact of environmental regulations on the green innovation efficiency of Chinese industrial enterprises. Pol. J. Environ. Stud. 30, 1433–1445. doi:10.15244/pjoes/125767
Yanwei, L. V., Yanxiang, X., and Xianjun, L. (2020). Research on space-time transition and convergence trend of regional green innovation efficiency in China. Res. Quantitative Econ. Tech. Econ. 37, 78–97.
Yi, M., Wang, Y., Yan, M., Fu, L., and Zhang, Y. (2020). Government R&D subsidies, environmental regulations, and their effect on green innovation efficiency of manufacturing industry: evidence from the Yangtze River Economic belt of China. Int. J. Environ. Res. Public Health 17, 1330. doi:10.3390/ijerph17041330
Yongfeng, D., Wenqing, X., and Haixia, L. (2020). Research on coupling coordination between green innovation efficiency and green development efficiency of the provinces in China. Sci. Technol. Manag. Res. 40, 235–243. doi:10.3969/j.issn.1000-7695.2020.17.032
Yu, Y. G., Xu, Z. N., Shen, P. Y., Zhang, L. N., and Ni, T. H. (2022). Efficiency evaluation and influencing factors of green innovation in Chinese resource-based cities: based on SBM-undesirable and spatial Durbin model. Int. J. Environ. Res. Public Health 19, 13772. doi:10.3390/ijerph192113772
Yujing, H., and Danyang, C. (2021). Analysis of green technology innovation efficiency and its influencing factors of industrial enterprises in Yangtze River Delta. ChongQing Soc. Sci. 314, 49–63. doi:10.19631/j.cnki.css.2021.001.004
Yunliang, W., Jiajing, Q., and Tinghai, Z. (2021). Environmental regulation, green technology innovation, and high-quality economic development in the Yangtze River Delta. East China Econ. Manag. 35, 30–42. doi:10.19629/j.cnki.34-1014/f.210615027
Zaman, K., and Moemen, M.A.-el. (2017). Energy Consumption, Carbon dioxide emissions and economic development: evaluating alternative and plausible environmental hypothesis for sustainable growth. Renew. Sustain. Energy Rev. 74, 1119–1130. doi:10.1016/j.rser.2017.02.072
Zhao, T., Zhou, H., Jiang, J., and Yan, W. (2022). Impact of green finance and environmental regulations on the green innovation efficiency in China. Sustainability 14, 3206. doi:10.3390/su14063206
Zhen, Y., Huiwen, G., and Xiaohui, H. (2021). Geography of sustainability transitions: a sympathetic critique and research agenda. Prog. Geogr. 40, 498–510. doi:10.18306/dlkxjz.2021.03.013
Zhiqiang, M., Yan, W., and Jialu, S. (2023a). Spatial temporal development characteristics and dynamic evolution of industrial green innovation efficiency in the urban agglomerations of Yangtze River Delta. Sci. Technol. Prog. Policy 40, 57–67.
Keywords: green innovation efficiency, unexpected super-SBM, Geographically Weighted Regression model, spatial-temporal heterogeneity, heterogeneity
Citation: Shukai C, Bixia H and Meng G (2024) Research on spatial-temporal heterogeneity of driving factors of green innovation efficiency in Yangtze River Delta urban agglomeration—empirical test based on the Geographically Weighted Regression model. Front. Energy Res. 12:1308494. doi: 10.3389/fenrg.2024.1308494
Received: 06 October 2023; Accepted: 03 January 2024;
Published: 19 January 2024.
Edited by:
Shi-Tong Peng, Shantou University, ChinaCopyright © 2024 Shukai, Bixia and Meng. This is an open-access article distributed under the terms of the Creative Commons Attribution License (CC BY). The use, distribution or reproduction in other forums is permitted, provided the original author(s) and the copyright owner(s) are credited and that the original publication in this journal is cited, in accordance with accepted academic practice. No use, distribution or reproduction is permitted which does not comply with these terms.
*Correspondence: Guo Meng, Z20xMjM0NTZhYmNkQDE2My5jb20=