 Ziyang Wan1
 Chao Liu
- 1Nanchang Electric Power Supply Company, State Grid, Nanchang, China
- 2College of Electrical Engineering and New Energy, China Three Gorges University, Yichang, China
The distribution line is widely distributed and the span of pole-towers is small. However, the existing lightning positioning system has limited positioning accuracy, and the lightning strike coordinates it locates have certain deviations for the distribution network. The lightning hazard risk divided by lightning density is not sufficient to support the differentiated lightning protection transformation of the distribution network. The environment of the underlying surface where the pole-tower is located has a significant impact on lightning activity, so this paper combines terrain, climate, lightning current characteristics, and historical lightning trip data to finely evaluate the lightning risk level in the distribution line pole-tower area. This paper provides a detailed analysis of the relationship between different underlying surface environments and lightning current characteristics and utilizes the entropy weight method to construct a comprehensive lightning disaster risk index, then evaluates the risk level of lightning disaster in different regions, and corrects it through lightning fault data. Overlaying the risk level of the area and the distribution map of the pole-tower foundation coordinates, it will obtain the distribution of lightning hazard-pregnant risk at the pole-tower area, which would contribute to guiding the differentiated lightning protection transformation of the line. Compared to traditional unified lightning protection renovation methods, differentiated lightning protection methods that integrate factors such as pole-tower structure, wire type, and lightning risk level can achieve significant lightning protection effects at a lower economic cost. Taking Nanchang City as an example, risk assessment and lightning protection renovation were conducted on 21 distribution lines. The average number of lightning trips per year is 55 before the renovation, but it is only 4 after the renovation, which the number of lightning trips significantly reduce. This verifies the effectiveness of using lightning hazard-pregnant assessment results to guide differentiated lightning protection methods.
1 Introduction
In recent years, extreme weather has occurred frequently, and lightning activities have become more frequent (Wu and Wang, 2021; Ramesh et al., 2023). The span of the main network pole-tower is generally between 300 m and 500m, while the span of the distribution network pole-tower is generally between 50m and 80 m. Therefore, when the positioning accuracy of the lightning positioning system is 500m, the lightning strike coordinates located by it are more accurate for the main network, but there is a certain deviation for the distribution network (Hu and Xin, 2020; Liu et al., 2022a; Hu et al., 2022; Dementyeva et al., 2023). Unlike the main network, which generally only considers direct lightning tripping, lower amplitude direct lightning and voltage induced lightning may cause the distribution network tripping due to incomplete lightning protection configuration and low voltage withstand level (Shen et al., 2019; Liu et al., 2020; Shi et al., 2021). Moreover, the underlying surface environment has a significant impact on the lightning activity. For these reasons, this paper considers comprehensively evaluating the lightning risk of distribution lines by analyzing the correlation between different pole-tower environments and lightning density, as well as the lightning current amplitude. Then, the evaluation results are corrected using line lightning fault data to achieve accurate lightning risk assessment in the tower area and guide differentiated lightning protection transformation of the distribution network.
Domestic and foreign scholars have conducted extensive research on lightning stroke risk assessment of distribution lines. Xue et al. (2017) analyzed factors such as lightning properties and environmental impact on the location of conductors, and obtained the distribution pattern of lightning strikes in distribution networks, providing technical guidance for the application of overhead conductors. Zheng et al. (2021) established an Analytic Hierarchy Process (AHP) structural model for lightning protection measures of transmission lines based on the AHP, and analyzed the correlation between various characteristic factors of terrain and lightning tripping. Zou et al. (2016), Zhao et al. (2017) quantitatively analyzed the terrain characteristics of lightning strike areas by utilizing factors such as altitude, slope, slope aspect, land use type, water area, grassland, and forest land, and drew a distribution map of lightning strike induced disaster environment. Cheng et al. (2012), Liu et al. (2013), Liu Yubin et al. (2022b) conducted a detailed analysis on the probability distribution of lightning current amplitude and lightning hazard-pregnant probability under different terrain and landforms from aspects such as soil resistivity and altitude factors, but the assessment of lightning risk level is easily influenced by subjective judgments. Liu et al. (2016), Xia et al. (2022) conducted in-depth research on the distribution of lightning activity from the perspectives of lightning current amplitude, lightning current polarity characteristics, and soil resistivity, thus obtained optimized cumulative probability formulas for lightning current amplitude and corresponding parameters, and derived the curve relationship between lightning current amplitude and electric field strength. Some of the above literature only studied the relationship between lightning density and various terrain factors, ignoring the impact of induced lightning on the line, while others only studied the probability formula of lightning current amplitude and did not apply it to lightning protection of distribution lines. For distribution lines, both the arc thermal effect caused by direct lightning strikes and the overvoltage caused by induced lightning can cause distribution line tripping accidents, and most line trips are caused by induced lightning (Yu et al., 2016; Paulino José Osvaldo et al., 2022; Yang et al., 2022). Therefore, when evaluating the risk of lightning strikes in distribution lines, it is necessary to comprehensively analyze the lightning density, lightning current amplitude, and terrain factors.
This paper defines the concept of lightning activity factor (LAF) making use of lightning density and lightning current amplitude, and quantifies the correlation between terrain factors and lightning current amplitude density to obtain a comprehensive indicator of lightning hazard-pregnant. Utilizing this indicator, risk assessment is conducted on different pole-tower areas of distribution lines, and the risk results are corrected based on historical lightning fault data, which would provide reference opinions for differentiated lightning protection of distribution lines. Taking Nanchang City as an example, a refined assessment of the lightning risk of its 10 kV distribution line is conducted and used to guide lightning protection renovation. Finally, the effectiveness of this evaluation method is verified by comparing the lightning tripping situation before and after the line renovation.
2 Research method and basis for lightning hazard risk assessment
This paper considers analyzing the relationship between the underlying surface environment and lightning activities based on the statistical laws of lightning, in order to more accurately analyze the lightning risk at the location of distribution lines. The development process of thunderstorms towards the ground is susceptible to the influence of the underlying surface environment in the area where the tower is located. There are differences in lightning probability and lightning current amplitude among different underlying surface environments. Therefore, analyzing the impact of different underlying surface environments on lightning density and lightning current amplitude is of great significance for flexibly selecting towers with high lightning risk in the transmission line and guiding line lightning protection.
2.1 A lightning risk assessment method considering multiple factors
The specific research ideas of the lightning risk assessment method proposed in this paper are shown in Figure 1.
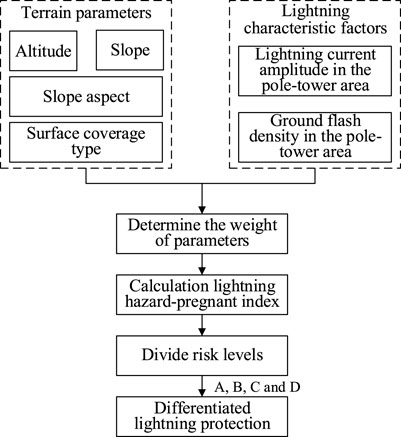
Figure 1. Evaluation method thinking block diagram.
Firstly, the terrain parameters of the pole-tower area were extracted based on DEM (Digital Elevation Model) data, including altitude, slope, slope aspect, and surface coverage type; And the correlation between these terrain parameters and the lightning current amplitude and ground flash density distribution in the pole-tower area was analyzed to determine that they indeed affect the distribution of lightning activity. Secondly, the entropy weight method was used to calculate the weights of four indicators on the impact of lightning hazards, in order to quantify the degree of impact of different terrain parameters on lightning activities. And the lightning hazard-pregnant index for each tower area was calculated based on the weights. Then, based on this index, the risk level of lightning damage is divided into four levels: A, B, C, and D. Among them, A level risk is the lowest and D level risk is the highest. Finally, based on the risk distribution results, differentiated lightning protection configurations can be applied to iron towers in different risk areas.
2.2 Lightning leader simplified model
In the stage of lightning leader developing towards the ground, different underlying surface environments will have an impact on the charge in the area where the pole-tower is located, thereby affecting the lightning density and lightning current amplitude suffered by the pole-towers (Guo et al., 2021; Liang et al., 2021). Assuming that the lightning leader is located in a vertical cylinder with a radius of 1, the height from the bottom of the thunderstorm cloud to the ground is
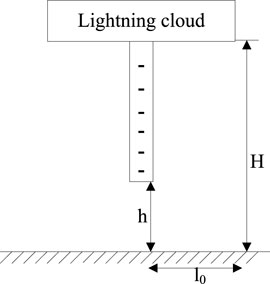
Figure 2. A two-dimensional simplified model of lightning leader.
Calculate the electric field intensity at any point on the ground as
where,
2.3 Extracting lightning hazard-pregnant factors
To analyze the correlation between lightning activities and the underlying surface environment of different pole-towers in detail, this paper quantifies the underlying surface environment of pole-towers as disaster factors such as altitude, slope, aspect, and ground cover type. A comprehensive assessment model for lightning disaster in pole-tower areas is constructed to refine the assessment of disaster probability of towers in different regions.
1) The altitude of the tower location is directly obtained from the digital elevation model data of Nanchang City. DEM is a digital elevation model, and typically presents in a grid format, with each grid unit containing a height value. The DEM data used in this paper has a resolution of 12.5 m, and each grid represents the terrain form, which can be expressed as Equation 2.
where,
2) The slope reflects the steepness of surface units, which to some extent hinders air convection and triggers moist and hot air to climb along the slope. The geomorphic characteristics parameters such as slope and slope aspect can be calculated using DEM data, and the calculation formula (Zhao et al., 2017) is shown in Eq. 3:
where,
3) Due to climate reasons, slope aspect also has a significant impact on lightning activity. Wet and hot air climbs uphill on windward slopes, causing elevation to rise and temperature to decrease, resulting in the loss of a large amount of water and triggering rainfall, conversely the airflow on the leeward slope sinks, the temperature rises, and the air gradually dries, making it less prone to rainfall. Therefore, lightning activity is more frequent on windward slopes than on leeward slopes. The slope aspect value is measured in degrees, with a northerly direction of 0° and a clockwise rotation angle between 0° and 360°. The slope aspect calculation formula (Zhao et al., 2017) is Eq. 4:
where,
4) Surface coverage types refer to the type of material covered on the Earth’s surface, which are closely related to terrain, and human activities would affect the generation and evolution of surface types, such as farmland and urban construction land. Surface coverage types have a certain impact on climate change in the region through water vapor and heat island effects.
2.4 Analysis of the influence of different hazard-pregnant factors on the lightning activity factor
The lightning protection level of distribution lines is relatively low, and the lightning density is positively correlated with the number of line trips. The larger the amplitude of lightning current, the greater the probability of line trips due to overvoltage. Both the lightning density and the amplitude of lightning current can affect line trips. Therefore, this paper proposes to use the product of lightning current density and lightning current amplitude as the lightning activity factor (LAF), which can more intuitively characterize the strength of induced lightning and improve the correlation between line faults, lightning activity, and various hazard-pregnant factors. This paper takes Nanchang City as an example to analyze in detail the correlation between underlying surface environmental factors and the LAF. Figure 3 is the distribution diagram of LAF in Nanchang from 2021 to 2022.
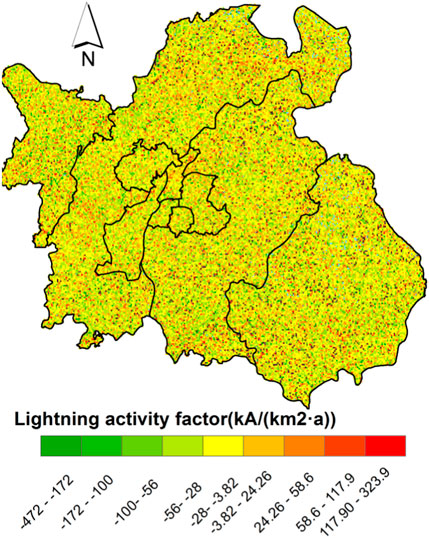
Figure 3. Lightning activity factor (LAF) distribution.
2.4.1 Correlation analysis of altitude
The overall altitude of Nanchang City is low. The relationship between the LAF in different sections and the altitude is shown in Figure 4, and the altitude step is 50 m. It can be seen that within the altitude range of 0 m–450m, the LAF in Nanchang is positively correlated with altitude: within the altitude range of 0 m–150m, the LAF increases significantly, and altitude is closely related to the LAF; Within the altitude range of 150 m–400m, the increase in LAF gradually slows down and stabilizes at around 170kV/(km2·a). Analysis shows that high altitude areas have a certain shielding effect on low altitude areas, and its lightning activities are more frequent. However, with the increase of height, the Density of air gradually decreases, the Mean free path of charged particles increases, the number of collisions decreases, and the LAF increases slowly.
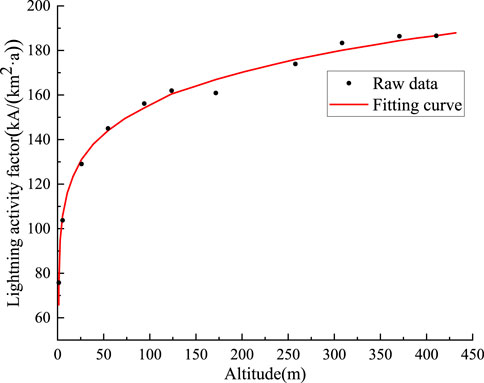
Figure 4. The influence of altitude on the LAF.
2.4.2 Correlation analysis of slope
Exporting the slope related data from DEM elevation data and establishing a slope attribute layer as shown in Figure 5, it can be seen that most areas in the southeast of Nanchang have relatively flat terrain, with slopes ranging from 0° to 6.31°, and the west is connected with Jiuling Mountain, which belongs to the inner mausoleum terrain, with a slope of 22.54°–57.36°. The analysis results are in agreement with the basic geographic data of Nanchang.

Figure 5. Slope analysis results of Nanchang city.
The slope step is 5°, and the variation of LAF with slope is shown in Figure 6. The slope changes in various regions of Nanchang range from 0° to 60°, indicating a negative correlation between the LAF and the overall slope. When the slope is within the range of 0°–15°, the lightning current amplitude density is maintained at a high level, with a minimum value of 100 kV/(km2·a). When the slope is greater than 35°, the LAF slows down as the slope changes. And when the slope is between 45° and 60°, the LAF remains almost unchanged and is generally small, about 30 kV/(km2·a).
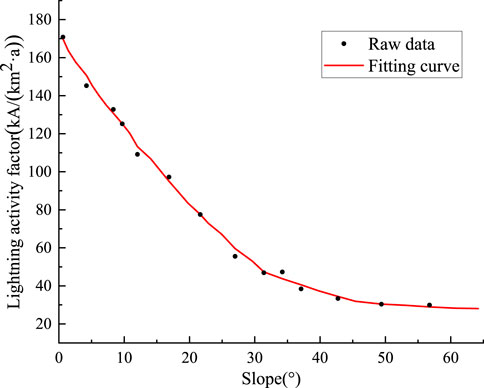
Figure 6. The influence of slope on the LAF.
2.4.3 Correlation analysis of slope aspect
The slope aspect calculation is performed for the digital elevation data of Nanchang city, and the slope aspect attribute layer is established as shown in Figure 7. The overall terrain of Nanchang is relatively flat, the slope aspect distribution is relatively uniform, and the red area is flat or watershed. Due to the hilly terrain, the western part of Nanchang exhibits obvious distribution characteristics on the east and west slopes.
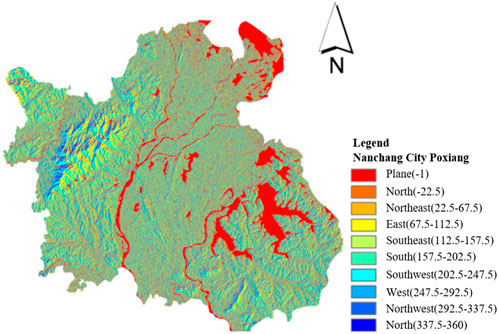
Figure 7. Slope aspect analysis results of Nanchang city.
According to the slope classification rules, the Nanchang area is divided into 8 slope direction intervals, with a north slope aspect of 0°, an east slope aspect of 90°, and a west slope aspect of 270°. The LAF within each slope direction interval is calculated, as shown in Figure 8. Among them, the LAF on the east and south slopes is high, reaching a maximum of 160 kA/(km2 · a), while the LAF on the west, northwest, north, and northeast slopes is relatively low. The LAF on the sunny slope (with a slope direction of 90°–270°) is generally higher, mainly due to the influence of typhoons in the eastern or southern regions during the thunderstorm season in Nanchang, resulting in moist airflow. In addition, the strong solar radiation on the sunny slope makes it easier to form strong convection in the air, creating favorable conditions for the generation of lightning.

Figure 8. The influence of slope aspect on the LAF.
2.4.4 Correlation analysis of surface coverage types
According to the geographical data of Nanchang, its surface coverage types are divided into four types: farmland, mountainous areas, water areas, and urban construction land. Urban construction land generally includes urban roads, residential land, production and living land, etc. The generated surface coverage type data is shown in Figure 9.
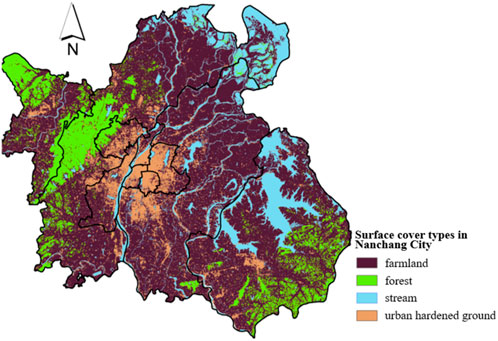
Figure 9. Analysis of surface coverage types in Nanchang.
Nanchang is located in the Poyang Lake Plain, and the water system is densely distributed, so the cultivated land, wetlands and waters are widely distributed; The city is mainly built on both sides of Ganjiang River, namely, Honggutan District, Xihu District, Qingshanhu District, etc.,; Forest land is mainly distributed in hilly areas with higher elevations. Nanchang has numerous lakes and undulating hills, with relatively complex terrain and uneven distribution of lightning activities. However, based on historical lightning activity statistics, lightning activities are mainly active in river regions and geological boundaries. To analyze the impact of surface cover types on lightning activities, Nanchang was divided into four surface cover types: mountainous areas (including forest land, wetlands, grasslands, etc.), hardened ground, water bodies, and farmland. Statistical analysis was conducted on the LAF under these four surface cover types.
From Figure 10, it can be seen that the LAF in mountainous areas (including forests, wetlands, grasslands, etc.) is the highest, reaching 170 kV/(km2·a). The possible reasons may be that high altitude areas are prone to lightning, mountain charge accumulation, vegetation and wetlands promote the formation of strong convection, etc. The second is hardened ground (i.e., urban construction land), whose LAF reaches 150 kV/(km2·a). Analysis shows that, first, Nanchang is affected by subtropical monsoon climate in spring and summer, and the air is humid; secondly, the cities of Nanchang are mainly distributed on both sides of the Ganjiang River, with significant changes in electrical resistivity at the geological boundary between soil and water, making it easy for lightning to lead the development; the third is the heat island effect of cities, where hot air rises and cold air sinks, leading to the formation of strong convection. Combining the above three main factors, thunderstorms are prone to form over the city of Nanchang. The LAF in farmland and water is relatively low, about 120 kV/(km2·a) and 100 kV/(km2·a).
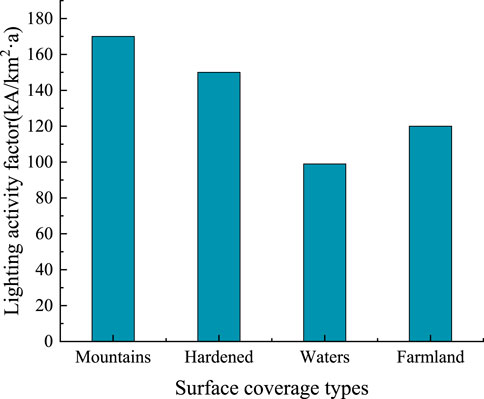
Figure 10. The influence of surface coverage types on the LAF.
3 Risk assessment and prevention of lightning hazard-pregnant in the pole-tower area
From the above analysis, it can be seen that the altitude, slope, slope aspect, and surface coverage type of the underlying surface environment where the pole-tower is located jointly affect the LAF. In order to improve the accuracy of the risk assessment model for the tower area and weaken the coupling relationship among different risk factors, this paper takes advantage of the entropy weight method to quantify the importance of each indicator, in an effort to achieve a more reasonable and objective lightning hazard-pregnant risk assessment on 10 kV distribution network lines.
3.1 Comprehensive indicators of lightning hazard-pregnant in the pole-tower area
The entropy weight method is an objective weighting method that can use entropy value to determine the degree of impact of a hazard-pregnant factor on the comprehensive indicators of lightning hazard-pregnant in the pole-tower area. When constructing the judgment matrix of evaluation indicators using entropy weight method, it is required that the indicators are linear to the evaluation results, but from the analysis of the correlation between different lightning disaster factors and lightning activities, it can be seen that the relationship between many environmental factors on the underlying surface and LAF is not linear (Zhangjin et al., 2017; Wu et al., 2022). Therefore, it is necessary to reassign the underlying surface environment related hazard-pregnant risk factors, according to obtain the relationship between various environmental factors and LAF based on the previous text. After reassigning, the larger the value of the hazard-pregnant risk factor, the greater the impact on LAF.
Firstly, this paper calculates a total of 2000 samples given a total of 4 indicators, namely, altitude index, slope index, slope aspect index and land cover type index, so the matrix is {X1, X2, X3, X4}, and the original matrix is formed as follows:
where,
For a certain indicator, the larger the difference between the indicator values of different samples, the greater the role of the indicator in the comprehensive evaluation. If all the values of an indicator are equal, the indicator does not work in the overall evaluation.
Then the data is standardized, first of all, each indicator is standardized, and different types of indicators need to be standardized in different ways:
When the calculated indicators are altitude and aspect, because they are both positive indicators, the standardized calculation formula is as follows:
When the calculated indicators are slope index and land cover type index, because they are both negative indicators, the standardized calculation formula is as follows:
The original indicator
Calculate the weight of the ith sample in the index under the four indicators
The entropy value of each index
where,
According to the formula of information entropy, the information entropy of each index is calculated as
The weight of each indicator is calculated by information entropy:
Finally, the composite score is calculated:
According to the calculation process of Eqs 5–12 above, the entropy values of altitude, slope, aspect, and land cover type were calculated as
where,
3.2 Correction of lightning hazard-pregnant risk level
For any pole-tower area, the lightning hazard-pregnant index C, obtained by the aforementioned evaluation method, is used as the parameter for determining the lightning risk of each base pole-tower on the line. The classification criteria for lightning risk of each tower are shown in Table 1.

Table 1. Classification standard for lightning hazard-pregnant risk level in pole-tower area.
After evaluating the risk of lightning hazard-pregnant to each base tower of the entire line, the evaluation results were revised using the statistical results of lightning faults in the past 5 years. For towers that have experienced lightning tripping accidents in the past 5 years, the existing evaluation results were improved by one level.
The evaluation method of lightning density was used to evaluate the line, and the results are shown in Figure 11A; using the method proposed in this paper that considers the LAF, a risk assessment is conducted on a typical line, and the evaluation results are shown in Figure 11B. Overlay the risk assessment map with the line lightning trip data, and in the risk distribution map obtained by using LAF assessment, the locations of fault occurrence points are all located in the C and D level risk area; In the risk distribution map obtained by using the density of lightning strikes, faults often occur in A-level risk areas. In contrast, the risk level obtained by using LAF assessment is more accurate and more in line with the occurrence of faults.
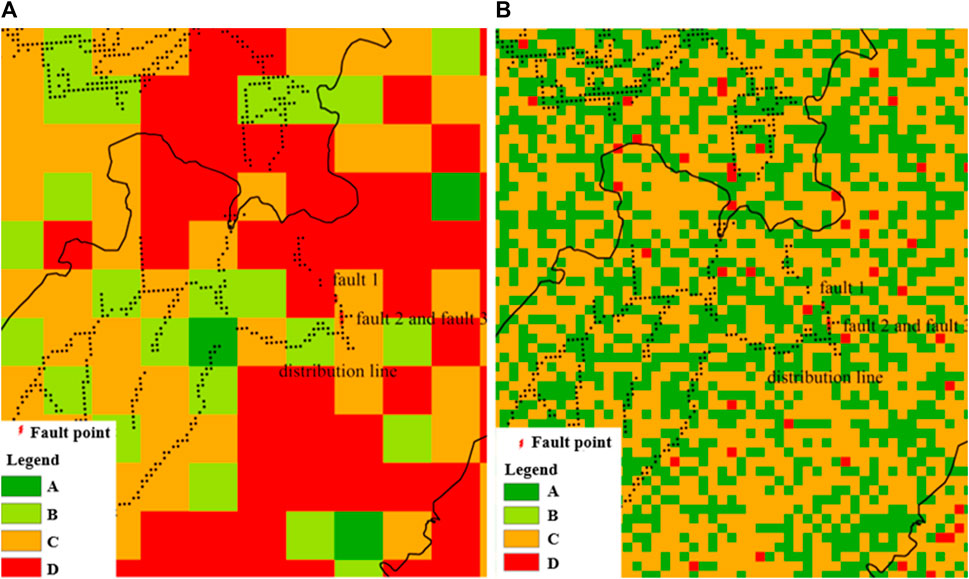
Figure 11. Comparison of risk assessment results. (A) Risk assessment considering lightning density. (B) Risk assessment considering the LAF.
Based on the risk assessment results in Figure 11, the proportion of different levels of risk areas corresponding to two different lightning hazard risk assessment methods is obtained, as shown in Table 2. It can be seen that the evaluation method proposed in this paper has higher accuracy and more detailed division of unit risk level areas. Among them, the proportion of C-level and D-level risk areas is reduced, which can reduce economic costs in differentiated lightning protection configurations.
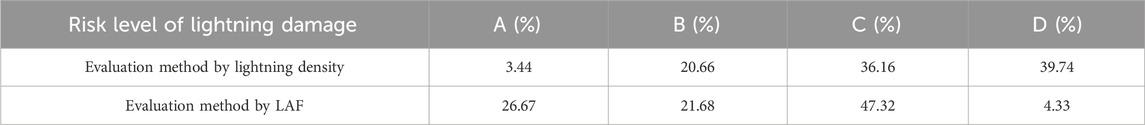
Table 2. Comparison of risk areas between two risk assessment methods for typical lines.
3.3 Differentiated configuration of lightning protection for pole-towers
The risk level distribution map of line lightning stroke disaster is drawn in combination with terrain data, historical lightning activity data, distribution line tower distribution data and historical line tripping fault conditions. This paper analyzes the correlation between the terrain where the tower is located and the LAF through mathematical statistical methods, and takes advantage of the entropy weight method to quantify the lightning hazard-pregnant factors, such as altitude, slope, slope aspect, and surface coverage types. The calculation method of lightning hazard-pregnant comprehensive indicators is obtained, in order to evaluate the risk level of lightning hazard-pregnant in different pole-tower areas.
(1) For the pole-tower with a revised assessment result of A level, the risk level of lightning damage is very low. Operations and maintenance personnel can conduct daily inspections and pay more attention.
(2) For the pole-tower with a revised evaluation result of Level B, the risk level of lightning damage is relatively low. Considering economic and rational considerations, lightning arresters can be installed in every three phases of the tower.
(3) For the pole-tower with a revised evaluation result of Level C. It has a certain risk of lightning damage, and lightning arresters should be installed on three phases of each tower.
(4) For the pole-tower with a revised evaluation result of Level D. As it belongs to a lightning prone area, lightning arresters should be installed on each tower and lightning protection wires should be reasonably installed on towers that have experienced lightning strikes.
4 Engineering application
To enhance the lightning protection capability of 10 kV distribution lines, Jiangxi Power Company plans to complete the lightning protection renovation of 300 lines in the province from 2021 to 2022. In this round of renovation project, Nanchang plans to renovate 21 distribution lines, which were completed in June 2022. The lightning hazard-pregnant assessment method based on the underlying surface environment of the pole-tower area proposed in this paper provides a theoretical basis for the refined and differentiated transformation of distribution lines.
4.1 Assessment of typical distribution line hazard-pregnant risk
Taking a typical line corridor in the Nanchang renovation plan as an example, the lightning risk rating of the area where the typical distribution line pole-towers are located in Nanchang is carried out utilizing the aforementioned method. The risk level of the area was overlaid with the distribution map of pole-tower foundation coordinates, and the refined distribution of lightning hazard-pregnant risk was obtained. Among them, # 27- # 34, # 55- # 71 and # 147- # 148 pole-towers were classified as Class A risks, # 72- # 90, # 133- # 146 pole-towers were classified as Class B risks, # 1- # 26, # 91- # 111 pole-towers were classified as Class C risks, and # 35- # 54, # 112- # 132 pole-towers were classified as Class D risks. The evaluation results are shown in Figure 12, It can be clearly seen that the selected typical line 1 has a higher risk level than typical line 2.

Figure 12. Pole-tower foundation coordinates and regional risk overlay diagram.
A field investigation was conducted on typical line 2, which has a total of 148 towers and a total length of approximately 8.47 km. The entire line uses overhead and insulated conductors, and the insulators mainly use R12.5 ET125N post insulators. Pole-towers # 59- # 61 are basically located on a hillside terrain, surrounded by many trees. Tall trees may affect direct and induced overvoltage on the line due to shielding effects. Pole-towers # 14- # 36 are mainly located in farmland and wetland terrain, with low soil resistivity around the pole-tower and is susceptible to lightning disasters, as shown in Figure 13.
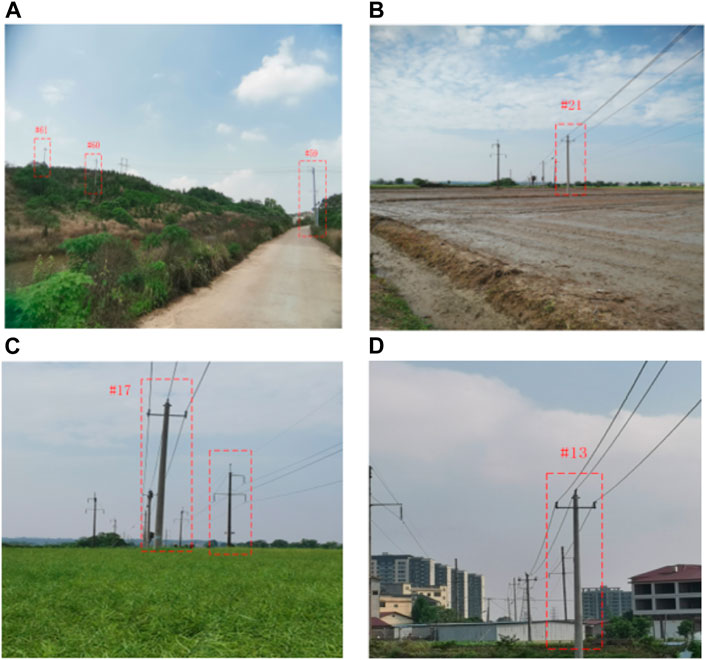
Figure 13. Environmental topography and geomorphology of the route corridor. (A) The tower is located on a hillside. (B) The tower is located in the wetland. (C) The tower is located in the farmland. (D) The tower is located in the urban area.
4.2 Lightning parametric statistics of typical distribution lines
Taking a typical line corridor in Nanchang City as an example, pole-towers in the same terrain are classified into one category, and the average ground flash density and corresponding average lightning current of the line from 2017 to 2021 are counted through the lightning location system, as shown in Table 3.
(1) The ground flash density of the towers in different sections of the line varies greatly. For example, the ground flash density of pole-towers 55 to 71 on the line is only 2.91 times/km2·a, while pole-towers 35 to 54 reach 5.27 times/km2·a.
(2) There are also certain differences in the average lightning current between different tower sections, with a maximum average current of 47.52 kA and a minimum average current of 28.8 kA.
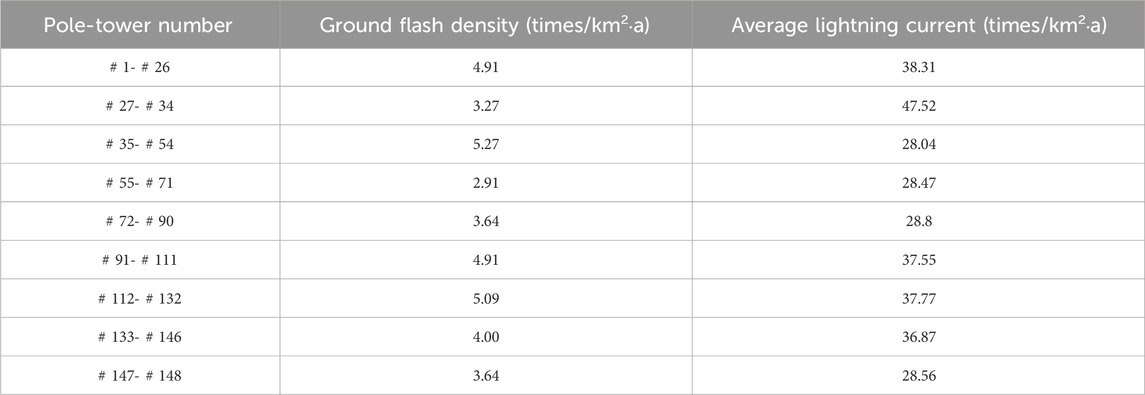
Table 3. Typical line ground flash density and average lightning current from 2017 to 2021.
4.3 Analysis of the effect before and after lightning protection renovation
Using the above method, according to the actual operation of line pole-towers, in combination with configuration principles, installation methods, economy and other factors, lightning protection treatment will be carried out for the typical lines selected by Nanchang. For # 1- # 26, # 35- # 54, and # 91- # 132 pole-towers, which are rated C and D, lightning arrester will be installed on all three phases of each foundation. For # 72- # 90, # 133- # 146 pole-towers which are rated B, lightning arrester will be installed on every three phases of each foundation. At the same time, for lines rated B, C, and D, lightning arresters will be installed phase by phase on both sides of the pole-towers that span large spans such as rivers and valleys, based on the actual operation of the towers. Lightning arresters will be used in combination according to the importance of the line users.
Statistical analysis was conducted on the 21 transmission lines that had completed the renovation in June 2022. The risk levels of lightning disasters for all pole-towers on the lines, the number of lightning trips per year before the renovation, and the number of trips from the renovation to June 2023 are shown in Table 4. Compared to the traditional lightning protection renovation plan of assembling lightning arresters one by one, the differentiated lightning protection renovation plan adopted in this round of engineering has reduced the cost by 22.34%, reflecting good economic efficiency.
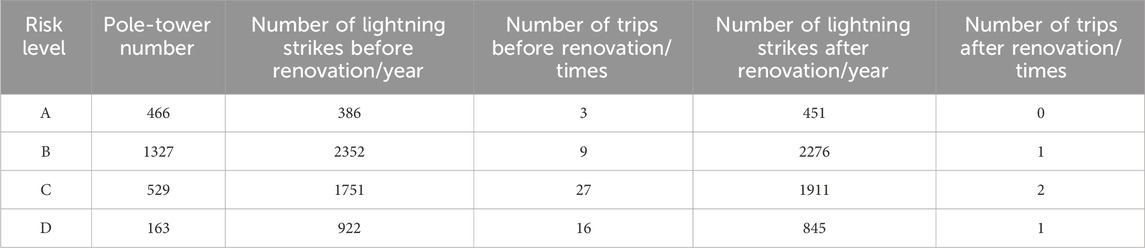
Table 4. Risk assessment and tripping situation of 18 renovated lines in Nanchang.
According to the fault data of the 21 transmission lines from 2017 to 2021, the average number of trips caused by lightning strikes per year before the renovation was 55; however, after the renovation was completed, from June 2022 to June 2023, these 21 lines tripped 4 times due to lightning strikes and all successfully reclosed. This verifies the effectiveness of this risk assessment method in supporting lightning protection renovation.
5 Conclusion
Lightning stroke is the main cause of power distribution line fault at present. In an effort to achieve refined and differentiated lightning prevention and control of power distribution lines, this paper takes Nanchang City as an example to study and evaluate the lightning disaster risk of distribution lines based on environmental factors of underlying surface such as altitude, slope, aspect, and surface coverage type. The conclusions are as follows.
(1) The lightning density and lightning current amplitude of different pole-tower sections on the same line are different, but the LAF obtained by multiplying the lightning density and lightning current amplitude is basically fixed.
(2) The LAF increases with the increase of altitude, the lightning effect is more obvious in high-altitude areas, and density of air will also affect lightning activities. The lightning current amplitude density decreases with increasing slope, showing a negative correlation. Affected by the subtropical monsoon climate, the LAF on the south and southeast slopes of Nanchang City is the highest. The impact weights of four types of lightning hazard-pregnant factors, namely, altitude, slope, slope aspect, and surface coverage type, on the LAF are respectively 0.3978, 0.0531, 0.1653, and 0.3838. The altitude in Nanchang has the most significant impact on LAF.
(3) Under the guidance of the lightning hazard risk map for refined distribution lines, the power company conducts lightning protection renovation projects. The 18 lines that have been renovated in Nanchang had an average of 55 trips per year due to lightning strikes before the renovation, but after the renovation was completed from June 2022 to June 2023, 21 lines had 4 trips due to lightning strikes and all successfully reclosed, verifying the effectiveness of this method.
Due to time constraints, this article only verifies the risk assessment method by taking the lightning fault situation of 21 transmission lines 1 year after renovation, and the results to some extent demonstrate the effectiveness of the method. However, line lightning tripping itself is a probability event, and it is still necessary to monitor and record the lightning strike situation of the renovated line for a long time in order to establish a more comprehensive and sensitive evaluation system. In addition, the risk level of lightning hazard-pregnant is directly related to basic lightning activity data, so in the later stage, it can be considered to improve the accuracy of lightning positioning system to enhance the accuracy of lightning induced pregnancy risk assessment.
Data availability statement
The raw data supporting the conclusions of this article will be made available by the authors, without undue reservation.
Author contributions
ZW: Methodology, Writing–review and editing. LF: Methodology, Writing–review and editing. ZD: Investigation, Writing–original draft. ZC: Writing–original draft. CL: Writing–original draft. YZ: Validation, Writing–original draft. XM: Data curation, Writing–original draft.
Funding
The author(s) declare that financial support was received for the research, authorship, and/or publication of this article. This study is funded by a key research technology project funded by State Grid Jiangxi Electric Power Company. The project name is Research and Application of Key Technologies for Lightning Protection in Distribution Networks, and the project number is 5218A022000G.
Acknowledgments
The authors acknowledge these supports gratefully.
Conflict of interest
Authors ZW, LF, ZD, YZ, and XM were employed by Nanchang Electric Power Supply Company.
The remaining authors declare that the research was conducted in the absence of any commercial or financial relationships that could be construed as a potential conflict of interest.
The authors declare that this study received funding from State Grid Jiangxi Electric Power Company. The funder had the following involvement in the study: research methods, investigation and data collection.
Publisher’s note
All claims expressed in this article are solely those of the authors and do not necessarily represent those of their affiliated organizations, or those of the publisher, the editors and the reviewers. Any product that may be evaluated in this article, or claim that may be made by its manufacturer, is not guaranteed or endorsed by the publisher.
Supplementary material
The Supplementary Material for this article can be found online at: https://www.frontiersin.org/articles/10.3389/fenrg.2024.1308200/full#supplementary-material
References
Cheng, X., Xie, W., Wang, K., and Tian, H. (2012). Method research of the risk zoning of thunder and lightning and its application over Anhui province. J. Meteorological Sci. 32 (01), 80–85. doi:10.3969/2012jms.0055
Dementyeva, S., Shatalina, M., Popykina, A., Sarafanov, F., Kulikov, M., and Mareev, E. (2023). Trends and features of thunderstorms and lightning activity in the upper volga region. Atmosphere 14 (4), 674. doi:10.3390/ATMOS14040674
Guo, J., Zhang, X., Wang, B., Hao, X., Zheng, S., and Xie, Y. (2021). A three-dimensional direct lightning strike model for lightning protection of the substation. IET Generation, Transm. Distribution 15 (19), 2760–2772. doi:10.1049/GTD2.12213
Hu, H., and Xin, T. (2020). Study on difference of ground flashover density in mountain terrain based on lightning location system. High. Volt. Appar. 56 (10), 190–196. doi:10.13296/j.1001-1609.hva.2020.10.030
Hu, S., Hu, Y., Wang, J., An, Y., Liu, G., Liu, Z., et al. (2022). Research on lightning overvoltage of oil-gas pipeline caused by lightning strikes on adjacent electrical transmission line. Front. Energy Res. 10. doi:10.3389/FENRG.2022.830638
Liang, T., Liu, Z., and Jiao, Y. (2021). Influence of single ground wire on lightning protection construction of 10 kV distribution line. Electr. Meas. Instrum. 58 (12), 131–136. doi:10.19753/j.issn1001-1390.2021.12.019
Liu, G., Tang, J., Sun, L., Xi, Y., and Liu, X. (2013). Influence of the distribution of lightning current amplitude in different landforms on the transmission-line's tripping operation. High. Volt. Eng. 39 (01), 17–23. doi:10.3969/j.issn.1003-6520.2013.01.003
Liu, H., Han, Y., Chen, C., Chen, Y., Cheng, Z., and Li, L. (2020). Research on lightning trip rate calculation and differentiated lightning protection of distribution line. Insulators Surge Arresters (04), 7–13+20. doi:10.16188/j.isa.1003-8337.2020.04.002
Liu, Y., Fu, Z. H., Jiang, A., Liu, Q., and Liu, B. (2016). FDTD analysis of the effects of indirect lightning on large floating roof oil tanks. Electr. Power Syst. Res. 139, 81–86. doi:10.1016/j.epsr.2015.11.031
Liu, Y., Jiang, Y., Gao, Q., Shi, Z., Jiang, Z., and Hu, J. (2022a). Characteristic analysis of lightning activities on the Yungui Plateau using ground-based remote sensing. Front. Environ. Sci. 10. doi:10.3389/FENVS.2022.949271
Liu, Y., Xu, Z., Zhou, L., and Xu, Z. (2022b). Research on differential lightning protection of 10 kV distribution lines in mountainous area based on classification and recognition of topography. Int. J. Crit. Infrastructures 18 (4), 1. doi:10.1504/IJCIS.2022.10038425
Paulino José Osvaldo, S., Barbosa Celio, F., Lopes Ivan, J. S., Boaventura, W. C., Cardoso, E. N., and Guimarães, M. F. (2022). Lightning protection of overhead distribution lines installed on high resistivity soil. Electr. Power Syst. Res. 209, 107952. doi:10.1016/J.EPSR.2022.107952
Ramesh, P., Sagar, A. G., Gautam, A. S., and Narita, T. (2023). Lightning activity over Telangana and Andhra Pradesh states situated in the east coast of India. Nat. Hazards 117 (1), 71–92. doi:10.1007/S11069-023-05850-0
Shen, D., Yang, Z., Liu, J., and Yang, X. (2019). Analysis of influence of lightning strike transmission line on parallel 10 kV distribution line. High. Volt. Appar. 55 (04), 211–216. doi:10.13296/j.1001-1609.hva.2019.04.030
Shi, T., Hu, D., Ren, X., Huang, Z., Zhang, Y., and Yang, J. (2021). Investigation on the lightning location and warning system using artificial intelligence. J. Sensors 2021, 2021–2111. doi:10.1155/2021/6108223
Wu, D., and Wang, J. (2021). Lightning protection of multi-fracture arc-quenching lightning protection gap for 35 kV distribution lines. IET Generation, Transm. Distribution 15 (15), 2277–2285. doi:10.1049/GTD2.12193
Wu, J., Chen, X., and Lu, J. (2022). Assessment of long and short-term flood risk using the multi-criteria analysis model with the AHP-Entropy method in Poyang Lake basin. Int. J. Disaster Risk Reduct. 75, 102968. doi:10.1016/J.IJDRR.2022.102968
Xia, L., Song, N., Fan, Y., Yinping, L., Qing, L., Xiaolin, G., et al. (2022). Distribution characteristics and formula revision of lightning current amplitude and cumulative probability in zhejiang province. Front. Environ. Sci. 10. doi:10.3389/FENVS.2022.880113
Xue, R., Fu, H., Ma, Y., and Guang, C. (2017). Analysis on current lightning protection methods for distribution networks. High. Volt. Appar. 53 (09), 17–22. doi:10.13296/j.1001-1609.hva.2017.09.004
Yang, Q., Zhang, X., Sun, J., Xu, W., He, W., Wang, K., et al. (2022). Waveform analysis on characteristics of lightning induced overvoltages on 10kV overhead distribution lines. Proc. CSEE 42 (24), 8900–8910. doi:10.13334/j.0258-8013.pcsee.212166
Yu, Z., Zhu, T., Wang, Z., Lu, G., Zeng, R., Liu, Y., et al. (2016). Calculation and experiment of induced lightning overvoltage on power distribution line. Electr. Power Syst. Res. 139, 52–59. doi:10.1016/j.epsr.2015.12.039
Zhangjin, W., Ma, H., and Tang, D. (2017). Trend assessment of typhoon disasters based on the improved entropy method. J. Catastrophology 32 (03), 7–11. doi:10.3969/j.issn.1000-811X.2017.03.002
Zhao, W., Li, Z., Shi, H., and Tong, H. (2017). Sensitivity assessment on hazard-pregnant environment of lightning trip-out in zhejiang power grid based on analytic hierarchy process model. High. Volt. Eng. 43 (02), 619–626. doi:10.13336/j.1003-6520.hve.20170123036
Zheng, Y., Wu, Z., Shu, S., Xu, J., Fang, C., and Xie, W. (2021). Lightning risk assessment model for transmission lines with lift-based improved analytic hierarchy process. IET Generation, Transm. Distribution 15 (20), 2905–2914. doi:10.1049/GTD2.12227
Keywords: distribution lines, underlying surface environment, lightning current characteristics, refined assessment, differentiated lightning protection
Citation: Wan Z, Fu L, Du Z, Chen Z, Liu C, Zhu Y and Ma X (2024) Refined risk assessment and differentiated protection of lightning damage in distribution network lines considering the underlying surface environment. Front. Energy Res. 12:1308200. doi: 10.3389/fenrg.2024.1308200
Received: 06 October 2023; Accepted: 06 March 2024;
Published: 19 March 2024.
Edited by:
Gabino Jimenez-Castillo, University of Jaén, SpainReviewed by:
Nasir Ahmed Algeelani, Al-Madinah International University, MalaysiaXiangyu Tian, Xi’an University of Architecture and Technology, China
Han Wang, Shanghai Jiao Tong University, China
Copyright © 2024 Wan, Fu, Du, Chen, Liu, Zhu and Ma. This is an open-access article distributed under the terms of the Creative Commons Attribution License (CC BY). The use, distribution or reproduction in other forums is permitted, provided the original author(s) and the copyright owner(s) are credited and that the original publication in this journal is cited, in accordance with accepted academic practice. No use, distribution or reproduction is permitted which does not comply with these terms.
*Correspondence: Lixiang Fu, Zmx4MTMxNDIwMjNAMTYzLmNvbQ==