- 1State Key Laboratory of Ocean Engineering, School of Naval Architecture, Civil and Ocean Engineering, Shanghai Jiao Tong University, Shanghai, China
- 2Shanghai Merchant Ship Design and Research Institute, China State Shipbuilding Corporation Limited (CSSC), Shanghai, China
- 3Antai College of Economics and Management, Shanghai Jiao Tong University, Shanghai, China
- 4School of Biomedical Engineering, Shanghai Jiao Tong University, Shanghai, China
- 5Institute of Fintech, Shanghai University of Finance and Economics, Shanghai, China
- 6Key Laboratory of Marine Intelligent Equipment and System, The Ministry of Education, School of Naval Architecture, Civil and Ocean Engineering, Shanghai Jiao Tong University, Shanghai, China
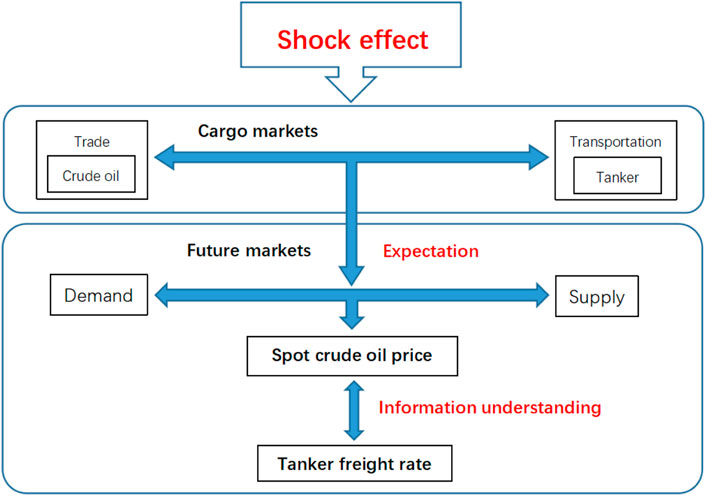
Research has identified volatility transmission from the oil market to the tanker freight market through external shocks. However, in the presence of intricate nonlinear structures, the academic literature often encounters difficulties in identifying cycles and their correlations across various timescales. This paper provides a multi-market analysis to comprehend the information from shock effects on different tanker routes and multi-peak fitting. Under different shock regimes, crude oil market and tanker freight rate shocks could transit bi-directly. When events occur, the crude oil market prices the expectations. However, when the actual performance of the future market differs from the traders’ predictions of the future market, a price gap exists. Generally, the trade opportunity is tough to catch up on because only partial information can be found. In this study, we investigate the volatility connection of multi-markets and shock effects to clarify previously undisclosed information using multi-peak analysis. The information gathered and double-checked by cargo markets, crude oil supply-demand balance, and tanker freight prices of various tanker types could assist us in identifying prospective trends and investment opportunities. The volatility of each market, as well as the correlation of multi-markets, gives insights to crude oil dealers, tanker market participants, and energy regulators.
1 Introduction
Oil price volatility has been a subject of significant interest due to its profound impact on the global economy, financial markets, and geopolitical landscape (Hamilton, 2003; Barsky and Kilian, 2004; Kilian et al., 2009; Kristjanpoller and Minutolo, 2016; Khan et al., 2021a). Supply and demand serve as the primary drivers of crude oil prices, causing them to rise or fall in response to changes in either of these factors (Hamilton, 2010; Zhang and Zhang, 2015; Khan et al., 2022a; Li et al., 2023). Geopolitical events, including wars, sanctions, and natural disasters, can create supply disruptions and exert a considerable influence on crude oil prices (Hamilton, 2014; Sun et al., 2017; Ross and Schinas, 2019; Michail and Melas, 2021; Zhang et al., 2022; Monge et al., 2023). Additionally, economic conditions such as inflation, interest rates, and currency exchange rates can also impact crude oil prices (Wang and Zhang, 2014; Zhang and Zhang, 2015; An et al., 2018; Caldara et al., 2019). The inherent volatility in crude oil prices exposes stakeholders to significant and potentially conflicting financial risks. To mitigate these risks, major traders engage in futures trading and physical oil markets. Successfully executing this mixed-trading strategy necessitates a comprehensive understanding of oil price behaviour and its determinants. Given the intricate nature of oil market volatility, researchers have been devoted to studying its nonlinear and non-stationary characteristics for decades (Yousefi and Wirjanto, 2004; Bigio and Schneider, 2017; Lahmiri, 2017; Zhang et al., 2019; Kilian, 2022; Liu et al., 2022). Tanker transportation plays a pivotal role in global oil trade, with the tanker freight market representing the balance between carrier supply and demand, including pertinent information about crude oil supply (Alizadeh et al., 2015; Chen et al., 2017; Lim et al., 2019; Regli and Nomikos, 2019; Ke et al., 2023; Kumar NM et al., 2023). Analyzing the tanker freight market can provide valuable insights into future crude oil trading. Conversely, the crude oil market encompasses information about carrier demand, which aids in the analysis of future tanker freight rates (Li et al., 2018; Khan et al., 2021b). This manuscript aims to examine the shock effect of various markets under different regimes, specifically during the COVID-2019 pandemic and the Russia-Ukraine conflict in 2022.
Studying the correlation between the crude oil market and the tanker freight market presents a challenging task that requires considering economic, energy, geopolitical, and maritime transportation factors. Existing research has explored this relationship, but reaching definitive conclusions has proven difficult due to variations across different empirical time zones (Kavussanos and Dimitrakopoulos, 2011; Baumeister et al., 2015; Yu et al., 2019; Michail and Melas, 2020a; Siddiqui and Basu, 2021; Kilian, 2022). Nevertheless, some progress has been made. Crude oil price shocks can exert a significant impact on tanker freight rates (Yang et al., 2015; Gavriilidis et al., 2018; Hofmann et al., 2018; Li et al., 2018). However, the correlation between crude oil price shocks and tanker freight rates is nonlinear, implying that the relationship between these variables is not consistent. For instance, when crude oil prices rise, tanker freight rates may increase, but the magnitude of the increase can vary depending on the size of the price shock (Zhang et al., 2022; Saracco et al., 2016; sheng Ouyang et al., 2022). Moreover, the demand for tankers may increase or decrease in response to rising crude oil prices, leading to corresponding fluctuations in freight rates (Dinwoodie et al., 2013; Gong and Lin, 2018; Chen et al., 2019). Crude oil trade networks can also influence tanker freight rates in various ways (Saracco et al., 2016; Shao et al., 2017). For example, an expanding crude oil trade network may require more tankers for transportation, resulting in higher freight rates (Xue et al., 2021; Michail and Melas, 2022). Conversely, a shrinking crude oil trade network may reduce the demand for tankers, leading to lower freight rates (Hamilton, 2009; Kilian et al., 2009; Siddiqui and Basu, 2021). Additionally, changes in the geopolitical landscape, such as sanctions or embargoes, can impact tanker freight rates (Monge et al., 2023; Zhang et al., 2023). Furthermore, shifts in the global economy, such as increased crude oil demand, can contribute to higher freight rates. Events that alter worldwide crude oil trade networks may stimulate freight rates on specific routes while shocking rates on others (Chen et al., 2017). Investor sentiment (Melas et al., 2022) and downside or upside markets (Theodossiou et al., 2020) are also important influential factors. Therefore, investigating the effects of different oil price shocks on freight rates requires a case-by-case examination.
Researchers have examined the linkages between crude oil price fluctuations, maritime network structure, and traffic flow changes by analyzing various vessel types (Adland and Cullinane, 2006; Tvedt, 2019; Siddiqui and Basu, 2020; Khan et al., 2022b). The freight rate for a specific tanker size is influenced by several factors, including vessel size, voyage distance, port availability, seasonality, and market conditions (Kavussanos and Dimitrakopoulos, 2011; sheng Ouyang et al., 2022; Xia and Chen, 2022). Generally, larger tankers tend to command higher freight rates, especially for routes that entail longer and more challenging journeys, such as those involving multiple ports or hazardous waters. However, there may be instances where Suezmax tankers have higher rates than Very Large Crude Carriers (VLCCs), particularly during periods when the tanker market is significantly affected by external events (Sun et al., 2017; Regli and Nomikos, 2019). Market shocks, such as geopolitical events, natural disasters, or fluctuations in oil prices, can lead to volatility in freight rates (Kilian, 2008; Poulakidas and Joutz, 2009; Dinwoodie et al., 2013; Li et al., 2022). Therefore, this study aims to explore the bidirectional value of multi-market information by investigating the relationship between detailed tanker route volatility and changes in the oil trade network. We analyze the impact of the COVID-19 pandemic and the Russian-Ukrainian conflict on global crude oil trade networks and the corresponding fluctuations in freight rates for different vessel types. Furthermore, we examine the discrepancy between oil futures market expectations and the actual market balance, identifying potential trading opportunities in the oil market through a deeper understanding of information derived from the tanker freight markets.
The recognition of volatility clustering and leverage effects in oil prices led to the adoption of more sophisticated models, including the Generalized Autoregressive Conditional Heteroskedasticity (GARCH) family of models. These models have been instrumental in capturing the complex characteristics of oil price movements (Xiong et al., 2015; Gavalas et al., 2022). In recent years, there has been a shift towards integrating machine learning techniques, such as Artificial Neural Networks (ANN), with traditional econometric models to improve forecasting accuracy (Kristjanpoller and Minutolo, 2016). However, in the presence of intricate nonlinear structures, traditional econometric methods often encounter significant difficulties in identifying cycles and their correlations across various timescales, including short and long-term durations (Kwapie et al., 2023). The complex characteristics of oil price volatility often come from the commodity transportation market which may give elasticity to or make limitations for the oil market (Chen et al., 2017). To tackle these challenges, analogous models have been effectively used to investigate issues such as stock market volatility. For instance, Xiong et al.utilized Wavelet Multi-resolution Analysis and the Multivariate BEKK-GARCH(1,1) Model to study the Spillover Effect between the Foreign Exchange Market and the Stock Market, which resulted in insightful and valuable conclusions (Xiong et al., 2015). Joutz’s research reflects a relationship between spot and future crude oil prices (Poulakidas and Joutz, 2009), crude oil inventories, and tanker rates. Empirical results from Sun et al. found a significant long-term correlation between tanker freight rates and oil prices (Sun et al., 2014). Subsequently, Ruan et al. used the MF-DCCA method to study the degree of cross-correlations between BDI and WTI (Ruan et al., 2016), and the results showed that the degree of cross-correlations had strong persistence in the short term. Our study proposes a muti-steps approach that incorporates multi-peak analysis and correlation investigation. The primary goal of this approach is to gain insights into the shock effects between crude oil prices and tanker freight rates, thereby enhancing our understanding of the underlying information dynamics. At the same time, analogous models also have been used in the field of energy. For instance, Yang et al. describe the development of a discrete event simulation model for bunker supply chains, emphasising how ammonia bunkering affects the operational and economic performance of the system (Yang and Lam, 2023). You et al. applied an integrated mathematical model to the investigation for economic feasibility (You et al., 2023).
This research investigates how volatility moves from the oil market to the freight rates market by examining the complex patterns of oil prices and the time series of tanker freight rates. We look into how information from the freight rates market could help identify investment opportunities in the oil sector. The connection between the cargo markets, the balance of crude oil supply and demand, and the freight rates for different types of tankers to find trends and investment opportunities are examined. We develop a multi-peak fitting model that uses several Gaussian distribution functions to precisely capture the characteristics of the peaks in the data, such as their positions, heights, and widths. Our analysis includes both the original data and its derivatives to understand the relationships at different levels of detail, which helps us to identify both short-term changes and long-term patterns. We also study how multiple variables correlate with each other and how these correlations change over time. This helps us to better understand the dynamic relationship between oil prices and freight rates, allowing us to make more accurate market predictions and support well-informed decision-making.
The study’s contributions to the literature are multifaceted. (a) Distinguishing Impacts of Different Shock Regimes: By discerning the varied effects of distinct shock regimes such as the Russia-Ukraine conflict and the COVID-19 pandemic on oil prices and tanker freight rates, the study provides a nuanced understanding of how global events can differentially influence these markets. Recognizing that the magnitude and significance of these impacts change over time and do not uniformly affect aggregate demand is crucial for predicting market reactions to future events. This granular analysis allows for more tailored risk assessments and strategic planning. (b) Observing Specific Price Cycles: The application of the multi-peak method has enabled the study to identify specific price cycles within the data, revealing a more intricate, timescale-based relationship between different freight rates. This level of detail is instrumental in understanding the rhythm of market prices and can inform more precise trading strategies. By analyzing the flow of crude oil and the changing correlations between tanker types, the study opens up new avenues for innovation in crude oil trading and enhances the efficiency of cross-border supply chains. Improved data transparency is a key outcome, which is beneficial for all market participants. (c) Unearthing Potential Trading Opportunities: Potential trading opportunities may be identified, arising from the divergence between traders’ expectations and the actual state of the oil market. By utilizing information from tanker transportation, the study sheds light on a relatively unexplored area—how crude demand shocks can influence tanker freight rate volatility. This aspect is particularly valuable as it provides actionable insights that could be leveraged by market participants to make more informed trading decisions, potentially leading to better risk management and profit optimization.
Overall, the study’s methodical approach to analyzing the interplay between crude oil prices, tanker freight rates, and the impacts of global shocks provides a fresh perspective and valuable insights that can guide decision-making in the energy and shipping sectors. By highlighting the complex dynamics at play, the study not only contributes to academic discourse but also has practical implications for market operations and strategic planning in the face of global uncertainties.
The subsequent sections of this paper are structured as follows. Section 2 provides an overview of the data utilized in this study. Section 3 outlines the methodology employed. In Section 4, we present the detailed application of the model and conduct data analysis. Our findings are discussed in Section 5, offering insights and interpretations. Finally, Section 6 concludes the paper by summarizing the key findings and discussing their implications.
2 Data
2.1 Crude oil price
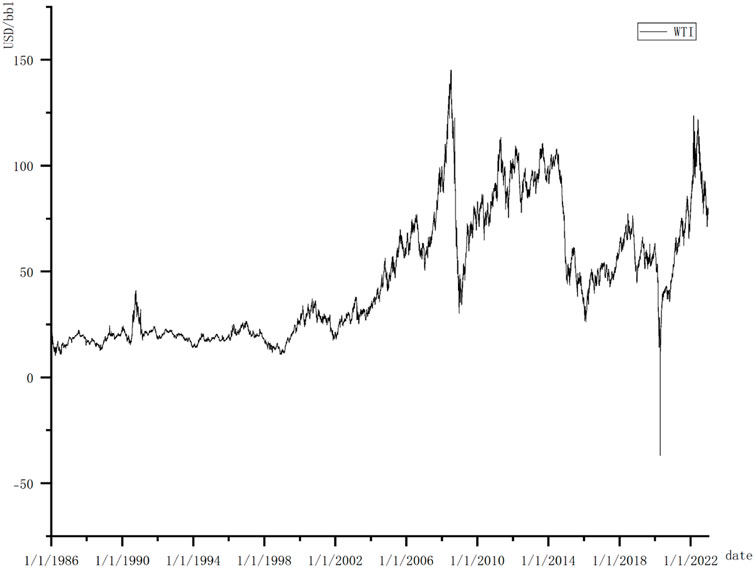
The spot price of the West Texas Intermediate (WTI; US$/barrel) is used to represent the crude oil market because it is a light and sweet crude oil that serves as one of the main global oil benchmarks and can better meet new sulfur regulations, which implements the new global sulfur limit of 0.5
2.2 Tanker freight rate
In the context of the tanker freight market, the Baltic Exchange Dirty Tanker Index (BDTI), published by the Baltic Exchange, is widely employed as a benchmark to capture the general trends in crude tanker freight rates (Alizadeh et al., 2015; Chen et al., 2017; Siddiqui and Basu, 2021; Shi et al., 2022). To analyze the dynamics of freight rates, we collected a dataset comprising daily BDTI values from Clarksons Research. The dataset covers the period from 27 January 1998 to 23 December 2022 (Figure 2).
In terms of the BDTI VLCC, we considered the TD3, the case of Japan importing crude oil from the Middle East. Japan is currently the fourth-largest oil importer behind China, the US, and India while the Middle East is the largest oil exporter with over 41
We conducted descriptive statistics on the data, and the statistical results are presented in the following Table 1 (all data sets have a total of 1,001 entries).
3 Models
3.1 Correlation
3.1.1 Correlation coefficient
Correlation can be linear or circular and is expressed by a correlation coefficient. In the data processing, we use the Pearson correlation
where
3.1.2 Algorithms (correlation)
Correlation is computed using a fast algorithm based on the correlation theorem and the convolution theorem (Greitans, 2005). Take the correlation calculation between WTI and BDTI VLCC as an example. We assume that the numerical value corresponding to WTI is f(n) while the numerical value corresponding to BDTI VLCC is g(n). Let
where
a. The discrete Fourier transforms of
b. Multiply the Fourier coefficients of
c. Perform inverse discrete Fourier transform on the product. To facilitate the determination of signal similarity. , the two input signals are first normalized as follows before the correlation is computed.
The normalized correlation can be computed as Eq. 5:
where
Using the same method, we can calculate the correlation between WTI and BDTI Suezmax, WTI and BDTI Aframax, BDTI VLCC and BDTI Suezmax, BDTI VLCC, and BDTI Suezmax, and BDTI Suezmax and BDTI Aframax. Finally, we will place all calculated correlations into the same plot and adjust the coordinate axes to make the plot more comprehensible and amenable to analysis.
3.2 Multi-peaks fitting
Multi-peaks fitting is a robust approach for extracting information from data featuring multiple peaks, as acknowledged by previous studies (Ledvij, 2003; Seber and Wild, 2003; Ranganathan, 2004). To address the influence of high-frequency fluctuations and capture noteworthy temporal variations, we utilize Gaussian multi-peaks analysis for fitting. Employing multiple Gaussian distributions to fit the curve enables the extraction of time-related information, including Peak time and MaxHeight, offering insights into real-world events.
In this model, we adopt a three-step methodology: (1) generating an initial function curve using the given initial values, (2) iteratively adjusting parameter values to minimize the distance between the obtained curve and the data points, and (3) terminating the iteration when the minimum distance reaches a predetermined stopping criteria to obtain the best fit.
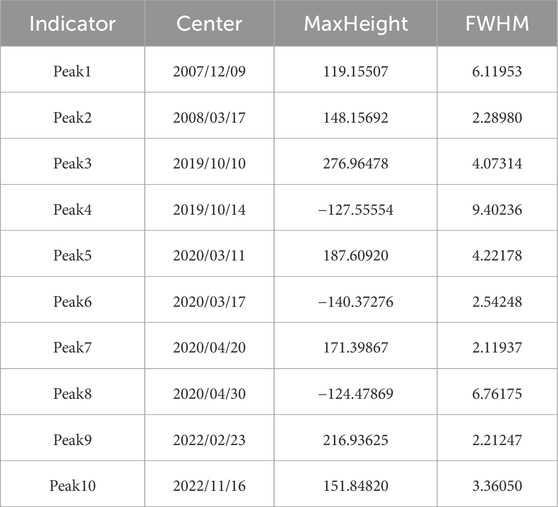
Subsequently, the data or its derivative is fitted with a Gaussian curve. Analysis of parameters such as Center, MaxHeight, and FWHM (Figure 3) is then conducted to investigate the shock effects between crude oil prices and tanker freight rates, as detailed in Table 4. FWHM means full width at half maximum, measuring the curve’s width at half its maximum amplitude. The results of the multi-peak analysis demonstrate a high level of significance, as corroborated by combined statistical analysis. The derivative of a function is conventionally defined as the limit of the difference quotient, representing the function’s instantaneous rate of change at a specific point, see Eq. 6:
To approximate the derivative when the value of
In practice, Origin software utilizes the centred difference formula to handle discrete data. It calculates the derivative at a data point
When the “smooth” option is selected for differentiation and the
3.2.1 Generate an initial function curve from the initial values
To begin the multi-peaks analysis, an initial function curve is generated based on the initial parameter values for the Gaussian peaks in this project. The Gaussian function is defined as Eq. 9:
where
Utilizing the initial parameters, a Gaussian function generates an initial function curve with one or more peaks. Multiple initial function curves can be created as required for multiple peaks. These initial curves act as the starting point for the iterative process that optimizes peak parameters, achieving the best fit for the data.
3.2.2 Iterate to adjust parameter values to make data points closer to the curve
After generating the initial function curve, we use a nonlinear least squares method to iteratively adjust the function parameter values, aiming to minimize the sum of squared errors between the function curve and the data points. Taking the multi-peak analysis of WTI derivative peaks under different shock regimes (Figure 5) as an illustrative example, we define the objective function as Eq. 10:
Here,
In each iteration, the model employs the Levenberg-Marquardt algorithm (Ranganathan, 2004) to compute the gradient of the objective function and update the parameter values. Specifically, the algorithm adjusts the parameter values in the direction of the steepest descent until the error function is minimized.
To mitigate the risk of convergence to local minima during iteration, heuristic methods are integrated into the model. At each iteration, the model introduces randomness by altering the initial parameter values. Additionally, the parameters from the preceding iteration serve as the initial values for the subsequent iteration, broadening the exploration of the parameter space and enhancing the likelihood of identifying the global optimal solution. Furthermore, the model incorporates heuristic techniques such as pruning and local search to enhance algorithmic efficiency and accuracy.
3.2.3 Stop when minimum distance reaches the stopping criteria to get the best fit
The model iteratively adjusts the parameter values until the predetermined stopping criterion is met, indicating that the error function has dropped below a specified threshold. Mathematically, this can be expressed as Eq. 11:
Here,
4 Application and results
In contradistinction to traditional methodologies, the utilization of multi-peak fitting demonstrates the ability to diminish noise emanating from transient and rapid oscillations. Empirical investigations have revealed that this methodology effectively addresses market turbulence arising from substantial global occurrences, thereby elucidating the manifestation and extent of perturbations in the form of discernible peaks. Consequently, we can derive the following analyses. The tables and graphics below are created by the Origin Pro 2023 software.
4.1 Volatility of crude oil price and tanker freight rate
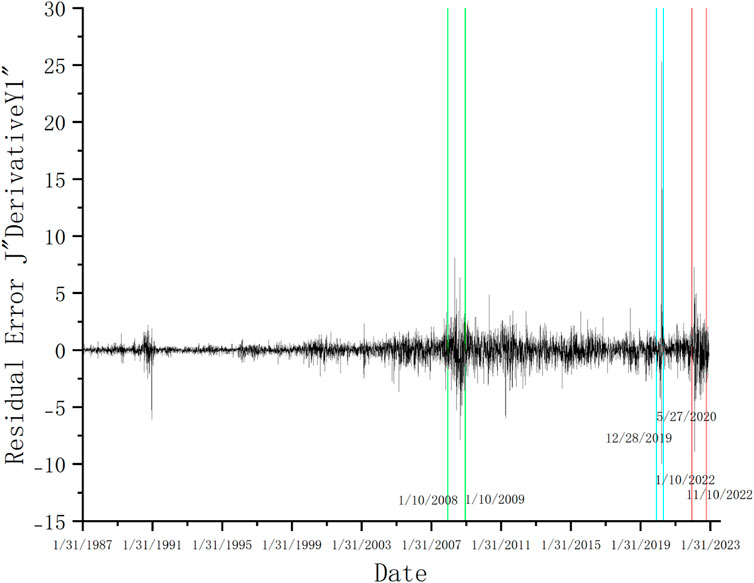
The graphic below displays the residuals of the first derivative data of WTI. Through the graphic, we get WTI derivative peaks under different shock regimes.
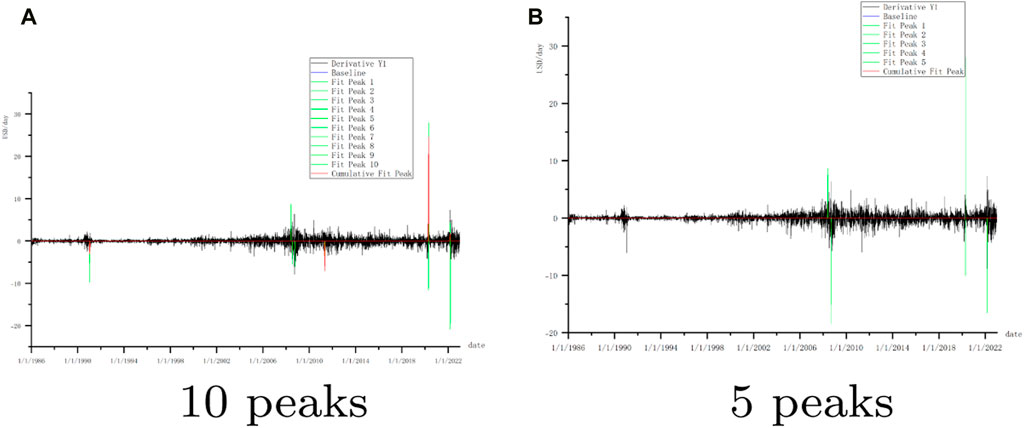
The derivative of WTI crude oil price from 1986 to 2022 in Figure 4 reveals that WTI fluctuates sharply in three periods: 2008 January 10 to 2009 10 January 2019 December 28 to 2020 May 27 and 2022 January 10 to 2022 November 10. Because there has been a lot of research on the financial crisis, we can determine through time comparison that these three eras correspond to the financial crisis, the COVID-19 outbreak (Khan et al., 2022a; Li et al., 2023), and the Russia-Ukraine conflict in 2022. This article will concentrate on the outbreak of COVID-19 and the Russia-Ukraine conflict. Figure 5 displays the WTI derivative peaks in these two shock regimes.
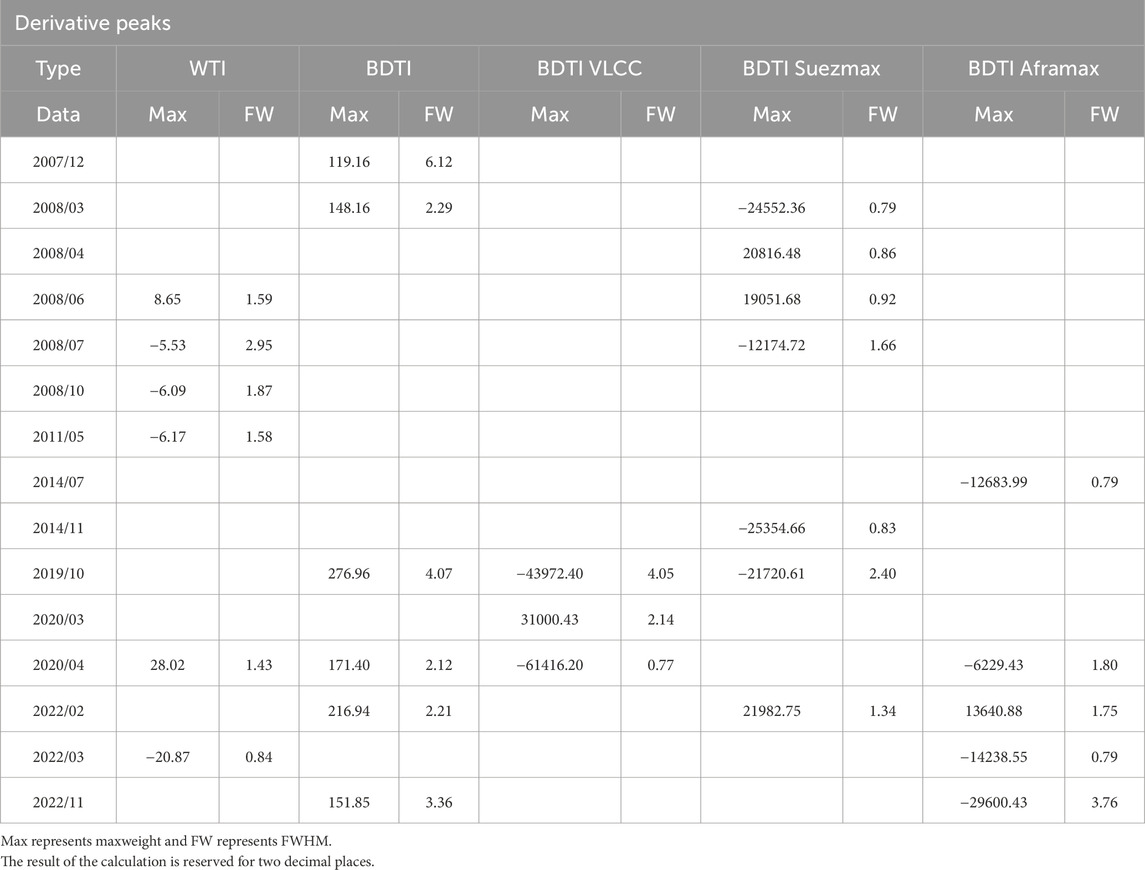
Below are the analyses for WTI derivative peaks (5 peaks) (Table 2) and the BDTI derivative peak figure (Table 3). Due to the localized nature of the fitting in the multi-peaks model, the MaxHeight of peaks may be a negative value, contingent upon the localized position of their respective fittings. Additionally, analyses for WTI derivative peaks (10 peaks) and BDTI derivative peaks for VLCC, Suezmax, and Aframax are also included. These tables are provided in Table 4. Simultaneously, corresponding statistical data is presented in Table 5.
From the BDTI derivative peaks under different shock regimes (Figure 6), we observe that the BDTI fluctuation changes for different ship types vary when the same regime occurs. This can be analyzed in connection with the transport routes of different ship types in Section 4.2.
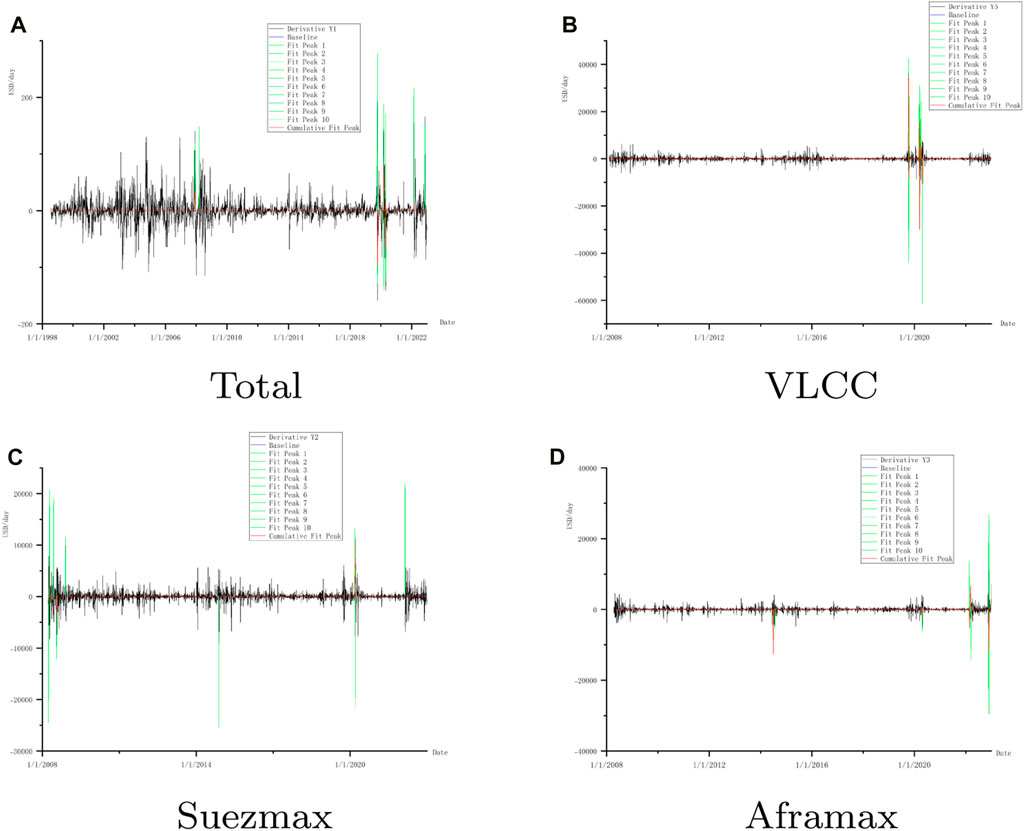
Figure 6. BDTI derivative peaks under different shock regimes for different tanker types [Total (A), VLCC (B), Suezmax (C), Aframax (D)] with labeled peaks.
4.2 Time and spacial dimension analysis
4.2.1 Time dimension: COVID-19 and Russia-Ukraine conflict
The impact of COVID-19 is primarily attributed to a significant drop in global economic expectations.
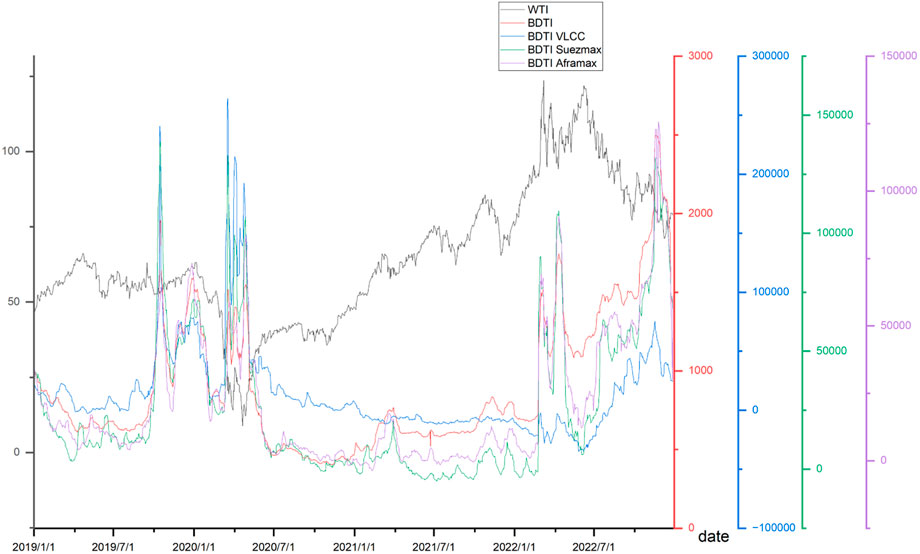
Figure 7 illustrates the development of the crude oil market, depicting a sharp decline in WTI from January to June 2020 following the COVID-19 epidemic in 2019. As the pandemic subsided during the summer, oil prices recovered from July to October 2020, with major importers like China quickly acquiring substantial amounts of the commodity. Post-October 2020, oil prices continued to rise due to advancements in COVID-19 vaccine research and development. From the perspective of the shipping market, it is evident that early in the COVID-19 pandemic, BDTI experienced a sharp decrease due to reduced trading demand between nations. Researchers have noted that the pandemic has adversely affected the dry bulk and dirty tanker segments more than the decline in port calls would suggest (Michail and Melas, 2020b). Subsequently, as importing nations like China swiftly purchased oil, and the maritime market was encouraged to flourish, the freight rate underwent significant fluctuations. Since then, the rate has stabilized due to the oil storage strategies implemented by countries.
A shock in geopolitical risk significantly increases the cost of spot charter rates for both LNG and LPG carriers (Michail and Melas, 2021), and the same applies to crude oil transportation. Global economic policy uncertainty makes the correlation between oil prices and BDTI more visible (Khan et al., 2021a). The impact of the Russia-Ukraine conflict is primarily attributable to the wave of energy stress that futures markets have priced in.
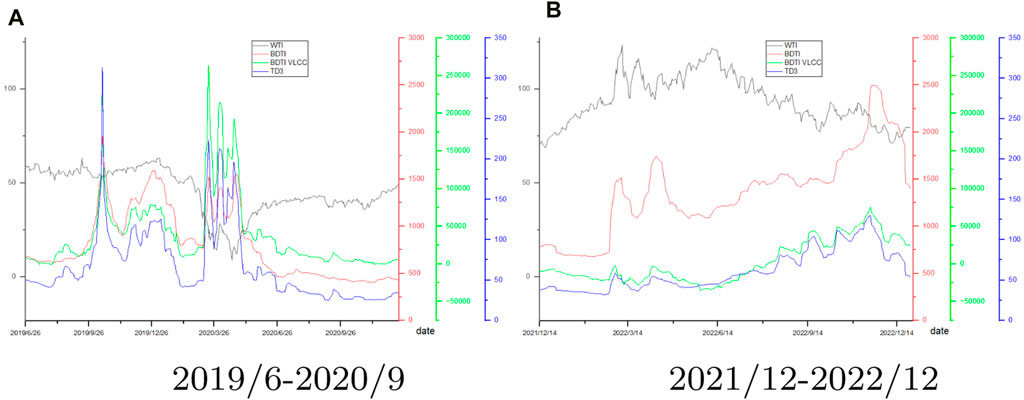
The Russia-Ukraine conflict began in February 2022, and from the perspective of the crude oil market, it impeded the flow of oil from Russia to Western Europe. As a result of sanctions imposed by the United States and Europe against Russia, and Russian counter-sanctions, trade market expectations declined, impacting the global oil market and contributing to a sharp increase in oil and freight prices. Oil prices were high in March 2022 as the war intensified, severely affecting the shipping sector and causing a sharp decrease in shipping rates. From the shipping market perspective, the Russia-Ukraine conflict, particularly the collapse of the Crimean Bridge, had a significant impact on land traffic. This also stimulated the shipping market, causing it to rise quickly in a short period.
4.2.2 Spacial dimension: difference of tanker types
Because the main routes of different tanker types are diverse, the impact on different tanker types is different. This paper mainly considers three tanker types: VLCC, which is mainly shipped to Asia, and Suezmax & Aframax, which is mainly shipped to Europe and the United States Gulf.
From Figure 8, it is evident that TD3 is strongly correlated with the change amplitude of BDTI VLCC during the outbreaks of COVID-19 and the conflict between Russia and Ukraine. As mentioned earlier, TD3 primarily transports goods imported by Japan from the Middle East, and both Japan and the Middle East are significant importers and exporters, respectively. Therefore, the index change of TD3 is highly influenced by the variations in BDTI VLCC.
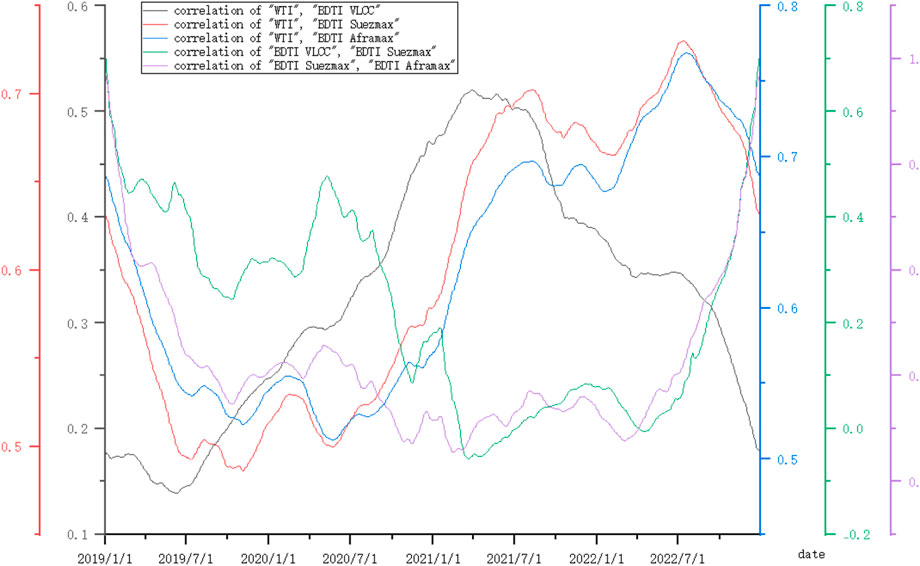
From the correlation between WTI and BDTI (Figure 9), we can infer that, due to the diverse shipping destinations of different ship types, BDTI volatility changes differently for each ship type when events impact different regions. Since VLCC is predominantly shipped to China, the correlation between VLCC and oil prices peaked in January 2021, coinciding with the most severe impact of the COVID-19 pandemic on China. Given that Suezmax and Aframax are primarily shipped to Europe, the Russia-Ukraine conflict in 2022 has had a profound effect on oil transportation in Europe. Consequently, the correlation between the freight price of Suezmax and the oil price significantly increased after the outbreak of the Russia-Ukraine conflict, and this correlation further intensified as the conflict escalated.
4.3 Potential information checked by multi-markets multi-peaks analysis
In general, the crude oil market and shipping market are investigated independently. Some researchers have identified the one-way influence of the crude oil market on the shipping market, but not vice versa. However, through the multi-peaks fitting analysis in this paper, we find that the shipping market can also provide information to the crude oil market from the supply side. It is evident from Figure 8 that WTI is highly correlated with BDTI. Additionally, Figure 7 illustrates that the interaction between WTI and BDTI is also influenced by different ship types and events.
Simultaneously, from Table 4, we observe that there is typically a lag between the crude oil market and the shipping market because it takes time for changes in the crude oil market to impact ship fuel costs and for the shipping market to respond. Specifically, the possible lags between the two markets are as follows:
a. Changes in the crude oil market impact ship fuel costs, but the impact is not immediate.
b. The shipping market takes time to respond.
This paper reveals the correlation and potential lag relationship between the crude oil and shipping markets through multi-peak fitting analysis. A comprehensive analysis of these relationships can provide more appropriate suggestions for subsequent investor decisions.
5 Discussion
The correlation between the crude oil market and the tanker freight market is depicted in Figure 10. This figure represents the information price between traders’ expectations and the actuality of the cargo balance. Trading opportunities arise when there is a gap between the expectations of the oil market and the actual flow of cargo, considering the distinct liquidity of the oil future market and the tanker freight market. The dynamics of these two market time series exhibit non-linear and non-stationary behaviors (Adland and Cullinane, 2006; Shao et al., 2017). These findings are further supported by cycles with variable time scales in tanker freight rates and a time-varying link between the oil and freight markets (Chen et al., 2019).
Previous research has identified volatility transmission from the oil market to the tanker freight market through external shocks. Decision-making opportunities for maritime players were reported by studying shifts in oil market demand (Siddiqui and Basu, 2021; Shi et al., 2022). However, the consequences of the supply chain on the oil market remain contested, denied, or refused (Alizadeh and Nomikos, 2004; Kilian, 2022).
Our findings reveal the structural balance between oil consumption and the accumulation of cargo through production, transportation, and inventory levels, highlighting the necessity of rebalancing as the gap widens. This potential trading opportunity has not been identified in previous literature and may have been overlooked by traders who typically focus solely on either the oil or the tanker freight market. Differences across tanker routes provide valuable signals for interpreting the details of shocks on oil trade networks. Therefore, understanding the bidirectional information of shock effects between the oil and freight markets offers deeper insights for vessel acquisition, layoff, and chartering decisions, as well as overall oil purchase and sales planning.
This paper presents a comprehensive analysis of the relationship between crude oil prices and tanker freight rates, employing various methodologies to enhance the model’s interpretative insights. The study utilizes a multi-market approach, examining the dynamics of both the crude oil market and the tanker freight market. It introduces a multi-peak fitting method to capture the multiple peak phenomena present in the data. The model accounts for external shocks, such as the COVID-19 pandemic and the Russia-Ukraine conflict, which have significant impacts on both oil prices and freight rates. Correlation analysis is used to quantify the strength and direction of the association between different market indicators, providing a clear picture of their interdependence.
The paper goes beyond a general analysis by considering different types of tankers (VLCC, Suezmax, and Aframax) and their specific routes. This granular approach allows for a more detailed understanding of how various segments of the shipping market are affected by changes in oil prices. The study analyzes not only the raw data but also the derivatives of the data, which helps to identify short-term fluctuations and longer-term trends. In summary, the models effectively handle complex market behaviors, account for external shocks, and use advanced statistical and computational methods.
Different regimes of crude oil price shocks lead to varying oil demand elasticity, consequently affecting different transportation routes and types. The distinct responses of these routes, coupled with the accumulation of structural gaps between trade expectations and the actual market, present opportunities for both the oil and freight markets. This area warrants further research. Additionally, monitoring crude oil price changes induced by global economic policy uncertainty and conflicts is essential to mitigate potential impacts on tanker freight rates.
The findings of this study offer practical decision-making insights for the energy industry:
6 Conclusion
The study highlights the significance of shock effects between crude oil prices and tanker freight rates, an underexplored area in the literature, which covers several tanker types, including BDTI VLCC, BDTI Suezmax, and BDTI Aframax, as well as TD3. The conclusions go as follows:
The findings offer valuable insights to traders and decision-makers in both the oil and tanker markets, and it is emphasized that oil price shock regimes differ, and their effects must be assessed on a case-by-case basis.
Data availability statement
The data analyzed in this study is subject to the following licenses/restrictions: The dataset from Clarkson is not allowed to be public. Requests to access these datasets should be directed to www.clarksons.com/.
Author contributions
FC: Conceptualization, Data curation, Formal Analysis, Funding acquisition, Methodology, Software, Writing–original draft, Writing–review and editing. JT: Formal Analysis, Writing–original draft, Writing–review and editing. JC: Data curation, Formal Analysis, Writing–original draft, Writing–review and editing. SY: Data curation, Formal Analysis, Software, Writing–original draft, Writing–review and editing. LD: Writing–original draft, Writing–review and editing. GF: Conceptualization, Writing–original draft, Writing–review and editing. FX: Formal Analysis, Writing–original draft, Writing–review and editing. XL: Conceptualization, Funding acquisition, Supervision, Writing–original draft, Writing–review and editing.
Funding
The author(s) declare that financial support was received for the research, authorship, and/or publication of this article. The National Social Science Fund of China (No. 23BJL020) supports our research.
Acknowledgments
We appreciate the support from the Ministry of Industry and Information Technology (Marine Engine Capability Enhancement Innovation Project).
Conflict of interest
Authors JT, JC, SY, LD, and FX were employed by China State Shipbuilding Corporation Limited.
The remaining authors declare that the research was conducted in the absence of any commercial or financial relationships that could be construed as a potential conflict of interest.
Publisher’s note
All claims expressed in this article are solely those of the authors and do not necessarily represent those of their affiliated organizations, or those of the publisher, the editors and the reviewers. Any product that may be evaluated in this article, or claim that may be made by its manufacturer, is not guaranteed or endorsed by the publisher.
References
Adland, R., and Cullinane, K. (2006). The non-linear dynamics of spot freight rates in tanker markets. Transp. Res. Part E Logist. Transp. Rev. 42, 211–224. ISSN 1366-5545. doi:10.1016/j.tre.2004.12.001
Alizadeh, A. H., Huang, C. Y., and van Dellen, S. (2015). A regime switching approach for hedging tanker shipping freight rates. Energy Econ. 49, 44–59. ISSN 01409883. doi:10.1016/j.eneco.2015.01.004
Alizadeh, A. H., and Nomikos, N. K. (2004). Cost of carry, causality and arbitrage between oil futures and tanker freight markets. Transp. Res. Part E Logist. Transp. Rev. 40, 297–316. doi:10.1016/j.tre.2004.02.002
An, Q., Wang, L., Qu, D., and Zhang, H. (2018). Dependency network of international oil trade before and after oil price drop. Energy 165, 1021–1033. ISSN 0360-5442. doi:10.1016/j.energy.2018.09.098
Barsky, R. B., and Kilian, L. (2004). Oil and the macroeconomy since the 1970s. J. Econ. Perspect. 18, 115–134. doi:10.1257/0895330042632708Available at: www.nber.org/cycles.
Baumeister, C., Hamilton, J. D., Kilian, L., Leahy, J., Murphy, D., and Swanson, E. (2015). Structural interpretation of vector autoregressions with incomplete identification: revisiting the role of oil supply and demand shocks.
Bigio, S., and Schneider, A. (2017). Liquidity shocks, business cycles and asset prices. Eur. Econ. Rev. 97, 108–130. ISSN 00142921. doi:10.1016/j.euroecorev.2017.05.004
Caldara, D., Cavallo, M., and Iacoviello, M. (2019). Oil price elasticities and oil price fluctuations. J. Monetary Econ. 103 (1), 1–20. ISSN 03043932. doi:10.1016/j.jmoneco.2018.08.004
Chen, F., Miao, Y., Tian, K., Ding, X., and Li, T. (2017). Multifractal cross-correlations between crude oil and tanker freight rate. Phys. A 474, 344–354. doi:10.1016/j.physa.2017.01.069
Chen, J., Xue, K., Song, L., Xunjie, J., Mei, Y., Huang, X., et al. (2019). Periodicity of world crude oil maritime transportation: case analysis of aframax tanker market. E nergy Strategy Rev. 25, 47–55. ISSN 2211-467X. doi:10.1016/j.esr.2019.100363
Dinwoodie, J., Tuck, S., and Rigot-Müller, P. (2013). Maritime oil freight flows to 2050: delphi perceptions of maritime specialists. Energy Policy 63, 553–561. ISSN 03014215. doi:10.1016/j.enpol.2013.08.068
Frigo, M., and Johnson, S. G. (2005). The design and implementation of fftw3. Proc. IEEE 93, 216–231. doi:10.1109/jproc.2004.840301
Gavalas, D., Syriopoulos, T., and Tsatsaronis, M. (2022). Covid–19 impact on the shipping industry: an event study approach. Transp. Policy 116, 157–164. ISSN 1879310X. doi:10.1016/j.tranpol.2021.11.016
Gavriilidis, K., Kambouroudis, D. S., Tsakou, K., and Tsouknidis, D. A. (2018). Volatility forecasting across tanker freight rates: the role of oil price shocks. T ransportation Res. Part E Logist. Transp. Rev. 118, 376–391. ISSN 13665545. doi:10.1016/j.tre.2018.08.012
Gong, X., and Lin, B. (2018). Time-varying effects of oil supply and demand shocks on China’s macro-economy. Energy 149, 424–437. ISSN 03605442. doi:10.1016/j.energy.2018.02.035
Hamilton, J. D. (2009). Causes and consequences of the oil shock of 2007-08. Available at: http://tonto.eia.doe.gov/dnav/.
Hofmann, E., Solakivi, T., Töyli, J., and Zinn, M. (2018). Oil price shocks and the financial performance patterns of logistics service providers. Energy Econ. 72, 290–306. ISSN 01409883. doi:10.1016/j.eneco.2018.04.006
Kavussanos, M. G., and Dimitrakopoulos, D. N. (2011). Market risk model selection and medium-term risk with limited data: application to ocean tanker freight markets. Int. Rev. Financial Analysis 20, 258–268. ISSN 10575219. doi:10.1016/j.irfa.2011.05.007
Ke, L., Liu, Q., Ng, A. K. Y., and Shi, W. (2023). Quantitative modelling of shipping freight rates: developments in the past 20 years. Marit. Policy and Manag. 51, 442–460. doi:10.1080/03088839.2022.2138595
Khan, K., Su, C. W., Tao, R., and Umar, M. (2022b). How do geopolitical risks affect oil prices and freight rates?. Ocean Coast. Manag. 215, 105955. doi:10.1016/j.ocecoaman.2021.105955
Khan, K., Su, C. W., and Koseoglu, S. D. (2022a). Who are the influencers in the commodity markets during covid-19? Resour. Policy 78, 102854. , ISSN 03014207. doi:10.1016/j.resourpol.2022.102854
Khan, K., Su, C.-W., Tao, R., and Umar, M. (2021a). How often do oil prices and tanker freight rates depend on global uncertainty? Regional Stud. Mar. Sci. 48, 102043–104855. ISSN. doi:10.1016/j.rsma.2021.102043
Khan, K., Su, C. W., Tao, R., and Umar, M. (2021b). How do geopolitical risks affect oil prices and freight rates? Ocean Coast. Manag. 215, 105955.
Kilian, L. (2008). Exogenous oil supply shocks: how big are they and how much do they matter for the u.s. economy? Rev. Econ. Statistics 90, 216–240. ISSN 0034-6535. doi:10.1162/rest.90.2.216
Kilian, L. (2022). Understanding the estimation of oil demand and oil supply elasticities. Energy Econ. 107, 105844. ISSN 01409883. doi:10.1016/j.eneco.2022.105844
Kilian, L., Rebucci, A., and Spatafora, N. (2009). Oil shocks and external balances. J. Int. Econ. 77, 181–194. ISSN 00221996. doi:10.1016/j.jinteco.2009.01.001
Kristjanpoller, W., and Minutolo, M. C. (2016). Forecasting volatility of oil price using an artificial neural network-garch model. Expert Syst. Appl. 65, 233–241. doi:10.1016/j.eswa.2016.08.045
Kumar Nm, H. S. P. A. K. S., D’Adamo, I., Hait, S., Priya, A., Kichou, S., and Gastaldi, M. (2023). Editorial: sustainable planning and lifecycle thinking of energy infrastructure. Front. Energy Res. 11, 1196826. doi:10.3389/fenrg.2023.1196826
Kwapie, J., Blasiak, P., Z. Z, S. D., and O’Swikecimka, P. (2023). Genuine multifractality in time series is due to temporal correlations. Phys. Rev. E 107, 034139. doi:10.1103/physreve.107.034139
Lahmiri, S. (2017). A study on chaos in crude oil markets before and after 2008 international financial crisis. Phys. A Stat. Mech. its Appl. 466, 389–395. ISSN 03784371. doi:10.1016/j.physa.2016.09.031
Li, T., Xue, L., Chen, Y., Chen, F., Miao, Y., Shao, X., et al. (2018). Insights from multifractality analysis of tanker freight market volatility with common external factor of crude oil price. Phys. A Stat. Mech. its Appl. 505, 374–384. ISSN 03784371. doi:10.1016/j.physa.2018.02.107
Li, Y., Bai, X., Wang, Q., and Ma, Z. (2022). A big data approach to cargo type prediction and its implications for oil trade estimation. T ransportation Res. Part E Logist. Transp. Rev. 165, 102831. ISSN 13665545. doi:10.1016/j.tre.2022.102831
Li, Y., Yin, M., Khan, K., and Su, C.-W. (2023). The impact of covid-19 on shipping freights: asymmetric multifractality analysis. Marit. Policy and Manag. 50, 889–907. doi:10.1080/03088839.2022.2081372
Lim, K. G., Nomikos, N. K., and Yap, N. (2019). Understanding the fundamentals of freight markets volatility. T ransportation Res. Part E Logist. Transp. Rev. 130, 1–15. ISSN 13665545. doi:10.1016/j.tre.2019.08.003
Liu, Y., Mizutani, N., Cho, Y. H., and Nakamura, T. (2022). Nonlinear hydrodynamic analysis and optimization of oscillating wave surge converters under irregular waves. Ocean. Eng. 250, 110888. ISSN 00298018. doi:10.1016/j.oceaneng.2022.110888
Melas, K. D., Panayides, P. M., and Tsouknidis, D. A. (2022). Dynamic volatility spillovers and investor sentiment components across freight-shipping markets. Marit. Econ. and Logist. 24, 368–394. doi:10.1057/s41278-021-00209-3
Michail, N. A., and Melas, K. D. (2020a). Quantifying the relationship between seaborne trade and shipping freight rates: a bayesian vector autoregressive approach, ISSN 2666-822X. Marit. Transp. Res. bf1 1, 100001. doi:10.1016/j.martra.2020.100001
Michail, N. A., and Melas, K. D. (2020b). Shipping markets in turmoil: an analysis of the covid-19 outbreak and its implications. Transp. Res. Interdiscip. Perspect. 7, 100178. doi:10.1016/j.trip.2020.100178
Michail, N. A., and Melas, K. D. (2021). Geopolitical risk and the lng-lpg trade. Peace Econ. Peace Sci. Public Policy 28, 243–265. doi:10.1515/peps-2022-0007
Michail, N. A., and Melas, K. D. (2022). Covid-19 and the energy trade: evidence from tanker trade routes. Asian J. Shipp. Logist. 38, 51–60. ISSN 20925212. doi:10.1016/j.ajsl.2021.12.001
Monge, M., Rojo, M. F. R., and Gil-Alana, L. A. (2023). The impact of geopolitical risk on the behavior of oil prices and freight rates. Energy 269, 126779. ISSN 03605442. doi:10.1016/j.energy.2023.126779
Poulakidas, A., and Joutz, F. (2009). Exploring the link between oil prices and tanker rates. M aritime Policy Manag. 36, 215–233. ISSN 03088839. doi:10.1080/03088830902861094
Regli, F., and Nomikos, N. K. (2019). The eye in the sky – freight rate effects of tanker supply. T ransportation Res. Part E 125, 402–424. ISSN 1366-5545. doi:10.1016/j.tre.2019.03.015
Ross, H. H., and Schinas, O. (2019). Empirical evidence of the interplay of energy performance and the value of ships. Ocean. Eng. 190, 106403. ISSN 00298018. doi:10.1016/j.oceaneng.2019.106403
Ruan, Q., Wang, Y., Lu, X., and Qin, J. (2016). Cross-correlations between baltic dry index and crude oil prices. Phys. A Stat. Mech. its Appl. 453, 278–289. doi:10.1016/j.physa.2016.02.018
Saracco, F., Clemente, R. D., Gabrielli, A., and Squartini, T. (2016). Detecting early signs of the 2007– 2008 crisis in the world trade. Sci Rep. 6, 30286. doi:10.1038/srep30286
Schatzman, J. C. (1996). Accuracy of the discrete fourier transform and the fast fourier transform. SIAM J. Sci. Comput. 17, 1150–1166. doi:10.1137/s1064827593247023
Seber, G. A., and Wild, C. J. (2003). Nonlinear regression. hoboken, 62. New Jersey: John Wiley and Sons, 1238.
Shao, Y., Qiao, H., and Wang, S. (2017). What determines China’s crude oil importing trade patterns? empirical evidences from 55 countries between 1992 and 2015. Energy Policy 109, 854–862. ISSN 03014215. doi:10.1016/j.enpol.2017.05.063
sheng Ouyang, Z., tian Liu, M., su Huang, S., and Yao, T. (2022). Does the source of oil price shocks matter for the systemic risk? Energy Econ. 109, 105958. ISSN 01409883. doi:10.1016/j.eneco.2022.105958
Shi, W., Gong, Y., Yin, J., Nguyen, S., and Liu, Q. (2022). Determinants of dynamic dependence between the crude oil and tanker freight markets: a mixed-frequency data sampling copula model. Energy 254, 124354. , ISSN 03605442. doi:10.1016/j.energy.2022.124354
Siddiqui, A. W., and Basu, R. (2020). An empirical analysis of relationships between cyclical components of oil price and tanker freight rates. Energy 200, 117494. , ISSN 03605442. doi:10.1016/j.energy.2020.117494
Siddiqui, A. W., and Basu, R. (2021). Disentangling the relationship between oil demand and tanker charter rates using frequency-decomposed components, ISSN 22105395. Res. Transp. Bus. Manag. 41, 100623. doi:10.1016/j.rtbm.2021.100623
Smith, J. O. (2008). Mathematics of the discrete Fourier transform (DFT): with audio applications. Julius Smith.
Sun, X., Liu, C., Chen, X., and Li, J. (2017). Modeling systemic risk of crude oil imports: case of China’s global oil supply chain. Energy 121, 449–465. , ISSN 03605442. doi:10.1016/j.energy.2017.01.018
Sun, X., Tang, L., Yang, Y., Wu, D., and Li, J. (2014). Identifying the dynamic relationship between tanker freight rates and oil prices: in the perspective of multiscale relevance. Econ. Model. 42, 287–295. doi:10.1016/j.econmod.2014.06.019
Theodossiou, P., Tsouknidis, D., and Savva, C. (2020). Freight rates in downside and upside markets: pricing of own and spillover risks from other shipping segments. J. R. Stat. Soc. Ser. A Statistics Soc. 183, 1097–1119. doi:10.1111/rssa.12553
Tvedt, J. (2019). Transport services and the valuation of flexibility over business cycles, T ransportation Research Part A: Policy and Practice, 130, 517. ISSN 09658564.
Wang, X., and Zhang, C. (2014). The impacts of global oil price shocks on China’s fundamental industries. Energy Policy 68, 394–402. ISSN 03014215. doi:10.1016/j.enpol.2014.01.020
Xia, Q., and Chen, F. (2022). Shipping economics development: a review from the perspective of the shipping industry chain for the past four decades. J ournal Shanghai Jiaot. Univ. Sci. 27, 424–436. ISSN 19958188. doi:10.1007/s12204-022-2449-y
Xiong, Z., Wen, H., and Xiong, Y. (2015). Empirical research on spillover effect between foreign exchange market and stock market by wavelet multi-resolution analysis and multivariate bekk-garch (1, 1) model. China Manag. Sci. 4, 30.
Xue, L., Chen, F., Fu, G., Xia, Q., and Du, L. (2021). Stability analysis of the world energy trade structure by multiscale embedding. F rontiers Energy Res. 9. ISSN 2296598X. doi:10.3389/fenrg.2021.729690
Yang, M., and Lam, J. S. L. (2023). Operational and economic evaluation of ammonia bunkering – bunkering supply chain perspective. Transp. Res. Part D Transp. Environ. 117, 103666. ISSN 1361-9209. doi:10.1016/j.trd.2023.103666
Yang, Y., Sun, X., and Li, J. (2015). Spillover effect of international crude oil market on tanker market. I nternational J. Glob. energy 38, 257. doi:10.1504/ijgei.2015.070270
You, Y., Kim, S., and Lee, J. C. (2023). Comparative study on ammonia and liquid hydrogen transportation costs in comparison to lng. Int. J. Nav. Archit. Ocean Eng. bf15, 100523. ISSN 2092-6782. doi:10.1016/j.ijnaoe.2023.100523
Yousefi, A., and Wirjanto, T. S. (2004). The empirical role of the exchange rate on the crude-oil price formation. Energy Econ. 26, 783–799. ISSN 01409883. doi:10.1016/j.eneco.2004.06.001
Yu, H., Fang, Z., Lu, F., Murray, A. T., Zhang, H., Peng, P., et al. (2019). Impact of oil price fluctuations on tanker maritime network structure and traffic flow changes, ISSN 03062619. Appl. Energy 237, 390–403. doi:10.1016/j.apenergy.2019.01.011
Zhang, S.-A. L. M. H. E., Xie, S., Vilela, A. L., and Stanley, H. E. (2019). Inter-event time interval analysis of organizational-level activity: venture capital market case. Phys. A. Stat. Mech. its Appl. 516, 346–355. doi:10.1016/j.physa.2018.09.050
Zhang, X., Zhou, J., and Du, X. (2022). Impact of oil price uncertainty shocks on China’s macro-economy. Resour. Policy 103080. ISSN 03014207.
Zhang, Y. J., and Zhang, L. (2015). Interpreting the crude oil price movements: evidence from the markov regime switching model. Appl. Energy 143, 96–109. ISSN 03062619. doi:10.1016/j.apenergy.2015.01.005
Keywords: event effects, crude oil price, tanker freight rate, shocks, multi-markets, expectation gap
Citation: Chen F, Tang J, Chen J, Yin S, Du L, Fu G, Xu F and Liang X (2024) Understanding the information of shock effects between energy commodity prices and maritime freight rate. Front. Energy Res. 12:1289327. doi: 10.3389/fenrg.2024.1289327
Received: 05 September 2023; Accepted: 18 July 2024;
Published: 20 August 2024.
Edited by:
Manoj Kumar Nallapaneni, City University of Hong Kong, Hong Kong SAR, ChinaReviewed by:
Nektarios Michail, Central Bank of Cyprus, CyprusDaozheng Huang, Shanghai Maritime University, China
Copyright © 2024 Chen, Tang, Chen, Yin, Du, Fu, Xu and Liang. This is an open-access article distributed under the terms of the Creative Commons Attribution License (CC BY). The use, distribution or reproduction in other forums is permitted, provided the original author(s) and the copyright owner(s) are credited and that the original publication in this journal is cited, in accordance with accepted academic practice. No use, distribution or reproduction is permitted which does not comply with these terms.
*Correspondence: Xiaofeng Liang, bGlhbmdfeGlhb2ZlbmdAc2p0dS5lZHUuY24=
 Feier Chen
 Juanjuan Tang
 Jianuo Chen
 Shuo Yin
 Luhui Du2