 Hazrat Bilal
 Eric C. Okonkwo
 Tareq Al-Ansari
- College of Science and Engineering, Hamad Bin Khalifa University, Doha, Qatar
Qatar is making concerted efforts at the national level to decrease anthropogenic greenhouse gas emissions. The country has set its National Determined Contribution (NDC) in line with the Paris Agreement to reduce its overall emissions by 25% by the year 2030. This study identifies several pathways, which Qatar can explore to achieve its set goals. It explores Qatar’s potential for renewable energy generation (solar and wind), carbon offset through planting trees, and the purchase of carbon offset credits. The study starts by investigating the available wind and solar energy potential in the country, by considering physical and legal restrictions, which limit the available land to be utilized for RE generation. Multi-criteria Decision is carried out utilizing the Analytic Hierarchy Process (AHP) for variable percentage estimation in ArcMap Geographic Information Systems software. Next, a review based on Qatar’s climate is performed to identify suitable tree species that would promote atmospheric CO2 sequestration in the country. Finally, the cost implication of offsetting emissions using verified carbon credits is considered and compared with other options. Results indicated that while a considerable area is available for both wind (37%) and solar (53%) energy generation, only 6.2% and 13.8% of Qatar are highly suitable for wind and solar energy installations, respectively. Also, while Qatar has the potential to meet 20% of its energy demand by 2030 from renewable sources by using solar PV and wind, this will only account for a 14.28% reduction in overall emissions. Additionally, planting date palm trees (Phoenix dactylifera) would significantly benefit the nation in the area of carbon sequestration and revenue generation as compared to purchasing carbon offset credits.
1 Introduction
The increasing threats of the continued use of fossil fuels are becoming more obvious by the day. Climate change is influencing everything around us, from weather to rising sea levels and an increase in the rate of recurrence of storms, extreme floods, droughts, and heat waves (Intergovernmental Panel on Climate Change IPCC, 2022). However, increasing population and urbanization means that energy demands would also continue to increase. While meeting these increases in energy demands remains an objective, policy decision-makers and governments must begin to diversify their energy mix to include more renewable options to mitigate the worse effects of climate change. The 2021 United Nations Climate Change Conference (COP-26) which was held in Glasgow, United Kingdom, saw 197 member parties reaffirm their commitment to the 2015 Paris Agreement goal of limiting global average temperatures below 2°C above pre-industrial levels. To achieve this, there must be a change in the energy sector, which currently accounts for 73.2% of global CO2 emissions (IEA, 2017). The goal here is to transition from fossil fuels to environmentally friendly RE sources like solar, wind, hydro, and biomass. Although several nations have begun to integrate and expand the contribution of renewable energy in their energy mix, the share of renewables in the global energy mix is still less than 12% and this continues to raise concerns for the future of the planet. In line with these, a nation can decide to reduce its emissions; and/or capture CO2 and store it (sequestration).
In line with the various international commitments to greenhouse gas reduction, the State of Qatar is making concerted efforts at the national level to decrease anthropogenic greenhouse gas emissions. The country has set its National Determined Contribution (NDC) in line with the Paris Agreement to reduce its overall emissions by 25% by the year 2030. This study identifies several pathways, which the country can explore to achieve its set goals. It explores Qatar’s potential for renewable energy generation (solar and wind), carbon offset through planting trees, and the utilization of carbon offset credits.
1.1 Emission reduction through RE integration
The quest to lower greenhouse gas (GHG) emissions has spurred the progress and viability of many RE technologies. A reduction in the cost of renewable technologies driven by technological improvements, economies of scale, and an increasingly competitive supply chain all made renewable power generation technologies a more cost-competitive option for new power generation capacities in many countries globally (IRENA, 2020). The availability of RE resources varies based on geographical location, while some locations might have more solar resources; others may be better suited for wind or geothermal technologies. Therefore, identifying suitable locations for RE installation is important in maximizing outputs from these technologies. To do this, various data related to the location, weather, topology, framework of existing infrastructure, demand, etc., are all needed in making this decision (Suprova et al., 2021). Several researchers have employed the use of various Multi-Criteria Decision-Making (MCDM) methods in identifying the most suitable sites for RE plant installations based on selected criteria (Yunna and Geng, 2014; Fetanat and Khorasaninejad, 2015; Ao Xuan et al., 2022).
MCDM methods are used by decision-makers to pick the best option when faced with various alternatives and several criteria (Al Garni and Awasthi, 2017). This technique has been used severally in planning renewable energy systems (RES) for their technical, environmental, and economic factors. Fetanat and Khorasaninejad (Fetanat and Khorasaninejad, 2015) used MCDM along with integrated energy planning and coastal management to ascertain the best sites for offshore wind farms in Iran. Xuan et al. (Ao Xuan et al., 2022) using a combination of MCDM methods for assigning weights to criteria used the method for the location selection of a solar-powered hydrogen plant in Uzbekistan. Wu and Geng (Yunna and Geng, 2014) used the Analytic Hierarchy Process (AHP) to establish a decision framework for the site selection of a hybrid solar wind power plant in China. Furthermore, MCDM helps integrate the opinions of multiple decision-makers who are involved in the decision framework but have varying opinions regarding specific criteria or alternatives. This is because it would be inadequate to base the assortment of sites for RE on one criterion. According to Huang et al. (Huang et al., 1995) and Loken (Løken, 2007) MCDM could suitably handle site selection for energy planning problems.
MCDM methods have been extensively utilized in conjunction with Geographic Information Systems (GIS) to estimate both qualitative and quantitative spatial criteria. GIS has the capability of determining the spatial and temporal patterns or the characteristic attributes of events. The GIS is a cost-effective means used to capture, store, evaluate, model, and present data that is spatially referenced to help solve complex issues in management and planning (Suprova et al., 2021). GIS has been successfully used in mapping RE potentials (Ramachandra and Shruthi, 2007; Wang et al., 2016; Lovrak et al., 2020). By combining MCDM with GIS, the analytical strengths of decision-makers are improved (Messaoudi et al., 2019). Several studies have been carried out on this topic and have been used to identify suitable sites for wind (Sánchez-Lozano et al., 2014; Atici et al., 2015), a hybrid of solar and wind (Jahangiri et al., 2016), solar (Merrouni et al., 2016; Palmer et al., 2019; Okonkwo et al., 2020; Elboshy et al., 2022), and developmental potentials for mining, agriculture, fossil fuels, and RE (Oakleaf et al., 2019). Although the studies reviewed varied in their specific criteria for decision-making, they all shared a common consensus on the effectiveness of integrating GIS with MCDM for identifying appropriate locations for renewable energy (RE) plants. This research study specifically concentrates on the application of MCDM and GIS in the site selection process for utility-scale solar and wind technologies. Table 1 presents a summary of recent studies that have utilized different MCDM techniques combined with GIS to evaluate potential sites for solar and wind power plants.
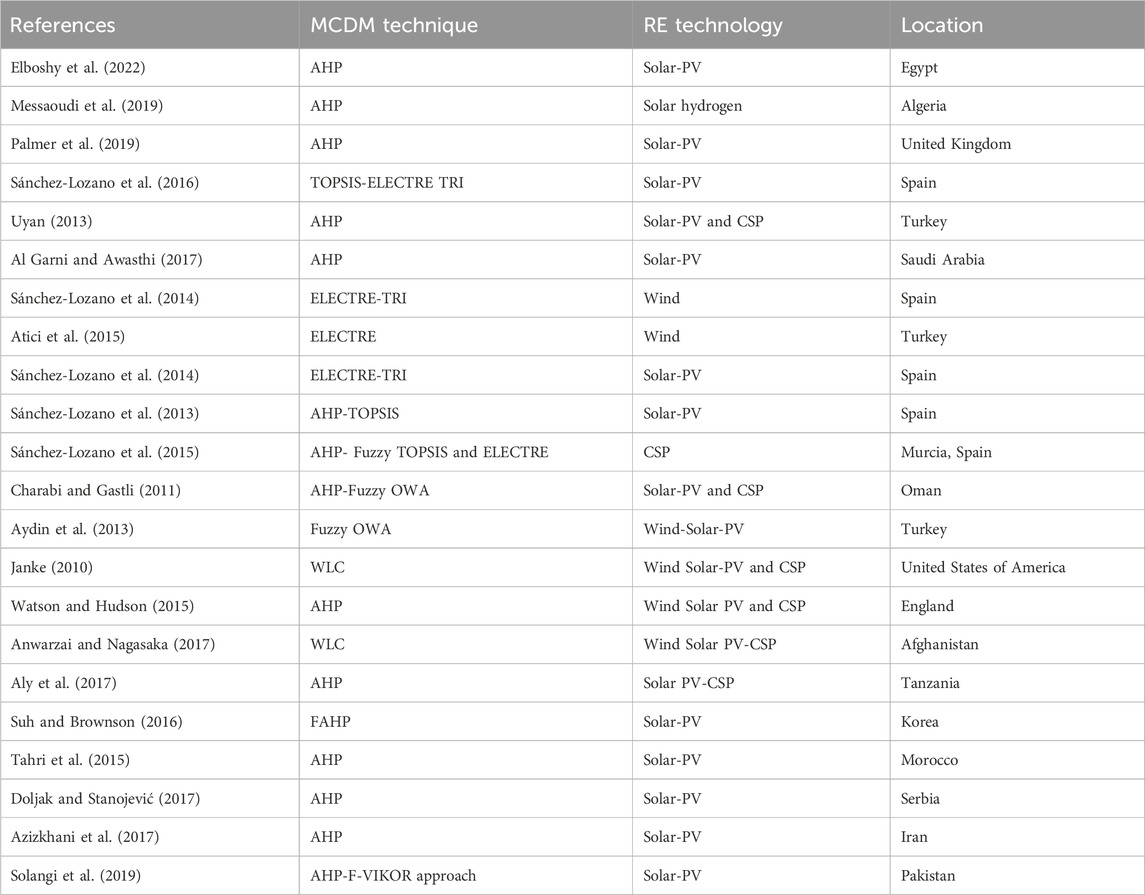
TABLE 1. Some recent studies that applied MCDM techniques with GIS for site selection.
Upon examining the studies listed in Table 1, it becomes evident that the authors considered various constraints that could limit the feasibility of solar or wind energy deployment in specific areas. These constraints included reserved areas, built-up areas, roads, and land use, amongst other factors. To account for these constraints, the authors employed a buffer zone approach, which involved creating a buffer around these restricted zones to identify suitable sites for solar and wind energy installations. They also assigned weights using MCDM based on the opinions of decision-makers and the objective to be reached. The articles reviewed highlighted that site selection for renewable energy plants is influenced by several key criteria. These criteria include economy, environment, risks, geography, ecology, climate, and society, each of which encompasses various sub-criteria (Ghasempour et al., 2019; Suprova et al., 2021). The economic aspect involves considerations such as cost-effectiveness and financial viability. The environmental criteria encompass factors like impact on ecosystems, biodiversity, and natural resources. Risk-related criteria may include hazards, safety concerns, and vulnerability to natural disasters. Geographic considerations involve aspects such as terrain, topography, and land availability. Ecological criteria encompass the preservation of sensitive habitats and species. Climate factors include solar irradiance, wind speed, and other climate patterns. Finally, societal criteria encompass aspects like public acceptance and community engagement.
1.2 CO2 sequestration through carbon offset
The installation of RE systems is a way to decrease carbon emissions, however, when we decoupled the energy sector into final energy use, only 17% of total energy consumption is used in power generation, and another 51% was used in heating and cooling, while 32% is used in the transportation sector (British Petroleum, 2021). Despite this, RE use in transportation only accounts for 3.4% of total energy use as compared to 27.1% in the power sector (Antoine Ibrahim et al., 2021). This is because aviation, maritime, and long-haul road transportation are sectors that still require viable decarbonization solutions. Along with other sectors like the steel and petrochemical industries, individuals, businesses, organizations, and nations can also find other means to decrease their GHG emissions. One such way is through carbon offset. This is a way of reaching carbon neutrality by ensuring a balance between the amount of greenhouse gas emitted and the amount removed from the atmosphere. Carbon offsets provide a mechanism to compensate for carbon dioxide (CO2) and other greenhouse gas (GHG) emissions by supporting projects that result in the reduction or removal of emissions elsewhere (Heintzman, 2021). Carbon offset schemes are in line with the Clean Development Mechanism (CDM) under Article 12 of the Kyoto Protocol aimed at helping developing countries to reduce their carbon footprints and ensuring industrialized nations comply with their emissions reduction commitments (United Nations, 1998). This is achieved through any project that reduces, avoids, or removes GHG emissions–these include land restoration, reforestation, afforestation, forest conservation, green building, or RE generation (Broekhoff et al., 2019). Both the 2005 Kyoto Protocol of the United Nations Framework Convention on Climate Change (UNFCCC) and the 2006 Intergovernmental Panel on Climate Change (IPCC) identify revegetation of areas above 500 m2 as an activity that improves the uptake of carbon (Intergovernmental Panel on Climate Change IPCC, 2006; UNFCCC, 2006). Carbon offset programs also yield other social and environmental benefits beyond just GHG reduction, some of which include improvement in air and water quality, enhancing biodiversity, and habitat conservation. To ensure the viability of a carbon offset project, the offset projects must meet specific criteria. These include demonstrating additionality, meaning they exist solely to fulfill the offset requirement; delivering measurable emissions reductions; ensuring the reductions are permanent; and undergoing verification by an independent third party (Schmidt, 2009). Carbon dioxide sequestration occurs naturally through plants, and forests act as large lungs by which carbon dioxide is taken from the air and converted into biomass in the presence of sunlight through a process called photosynthesis (Issa et al., 2019). This shows that forests provide a mitigation route to stabilize GHG concentrations in the atmosphere as an estimated 2–4 G tons of carbon is sequestered annually by the global forests (Qureshi et al., 2012). Domke et al. (Domke et al., 2020) highlighted the importance of forestland as a source of carbon capture in the US and estimated that 1.2 billion planted trees could sequester between 16–28 MMT CO2 annually. The total carbon stock sequestered by a tree species comprises the carbon in the biomass, soil organic carbon, and carbon litter which refers to the slow decomposition of dead organic debris and dead plants (Qureshi et al., 2012; Rytter and Rytter, 2020). Sharma et al. (Sharma et al., 2021) assessed the carbon sequestration potential of various tree groups. Their findings show that 139.86 tons of CO2 are sequestered annually from 1997 trees on the campus. Highlighting the significance of trees in storing and sequestering carbon (Coracero and Malabrigo, 2020), assessed the carbon stock of certain tree species in the Philippines. A total of 139 species consisting of 2,239 individuals were identified, the aboveground and belowground biomass of the live trees amounted to 306.48 t/ha. Wotherspoon et al. (Wotherspoon et al., 2014) concluded that the total carbon pools for white cedar, hybrid poplar, red oak, Norway spruce, black walnut, and soybean were 99.4, 113.4, 99.2, 91.3, 91.5, and 71.1 t C/ha. Their result suggests greater atmospheric CO2 sequestration as compared to conventional farming. Rytter and Rytter (Rytter and Rytter, 2020) in their study comparing the total carbon stock of six species of trees grown in former agricultural land concluded that though the total carbon sequestration rate may vary for different sites, the production of the trees has a quick and positive outcome on its total carbon sequestration. Thomas et al. (Thomas et al., 2007) further highlighted that species choice was the single most important factor for carbon sequestration forestry.
Date Palm Trees (Phoenix dactylifera): Qatar is located in the arid plains of the Arabian Peninsula, it is characterized by extreme heat and water stress leading to large portions of non-arable land (Okonkwo et al., 2021a). Qatar’s northern part is the most suitable for agriculture and this covers 19% of its landmass with a salinity level of 500–3,000 ppm (Darwish and Mohtar, 2013). Currently, agricultural practices for crop and vegetable farming are carried out using high-tech greenhouses. Water used in agriculture is obtained from groundwater abstraction (92%) and the rest of the water is obtained from treated wastewater (66.29 million m3). These conditions limit the species of trees that can be planted to aid atmospheric CO2 sequestration in Qatar. Under such conditions, a tree that can withstand high temperatures, droughts, and high soil salinity is required. The date palm (Phoenix dactylifera) is a plant species that has existed for thousands of years and is particularly concentrated in the MENA region (Middle East North Africa). Date palms have traditional, religious, and nutritional significance in the region and have been an important part of the farming systems in arid regions (Issa et al., 2019). The date palm tree can thrive in several geographical and climatic conditions and can tolerate high temperatures, droughts, and saline sand (500–2000 ppm) better than any other fruit crop species (Betemariyam and Kefalew, 2022). The date palm (DP) has a lifespan of over 200 years and can grow in high altitudes of 392 m–1,500 m above sea level with an average tree height of 24–30 m. The leaves of the tree are dense (four to five m), with each leaf having approximately 150 leaflets (each leaflet is around 30 cm in length and 2 cm in width) (Al-khayri et al., 2015). The amount of CO2 and carbon stocks absorbed in the trunk and roots of the tree is dependent on the size of the plant’s green parts, and when compared to other species of the same size, the date palm can absorb significantly greater CO2 (Sharif et al., 2010).
Water constitutes 25% of the whole tree, while carbon makes up 50% of the dry wood. Sharif et al. (Sharif et al., 2010), estimate that the date palm converts a large amount of CO2 equivalent to about 200 kg annually as well as produces food. They further estimated that a tree 15 m in height with a diameter of 0.5 m, and a trunk mass of approximately 1,472 kg would have a lifetime amount of 2020.3 kg of CO2 sequestered as carbon stored in its trunk and roots. Another study estimated the carbon stock of date palm farms in Ethiopia (Betemariyam and Kefalew, 2022) and found the total carbon stock of date palm farms to be 82.3 tonnes of carbon per hectare and calculated the mean biomass carbon stocks of date palm trees older than 20 years to be 238.61 kg/plant. In comparison, this value was found to be 225.58 kg/plant in Abu Dhabi (Issa et al., 2019). Based on a review of the available literature, it is estimated that a single date palm tree can potentially reduce CO2 emissions by approximately 70–200 kg annually. Moreover, growing date palms on a large scale not only contributes to CO2 reduction but also has the potential to generate substantial revenue and employment opportunities. With the annual crop yield of dates from a single date palm exceeding 100 kg, the cultivation of date palms can provide economic benefits and job prospects.
1.3 Qatar’s energy goals
The State of Qatar, situated on the northeastern coast of the Arabian Peninsula, covers an area of 11,400 km2. It is renowned for its energy security, primarily attributed to the abundant reserves of fossil fuel (Okonkwo et al., 2021b). Qatar is also geographically rich in abundant solar radiation and wind resources making it possible to integrate both solar and wind energy systems into the grid (Okonkwo et al., 2021c). Currently, fossil fuels mainly from the use of gas supply over 99% of the nation’s energy needs (Okonkwo et al., 2021a). Based on the British Petroleum statistical review of world energy, the total carbon emissions from Qatar in the year 2020 amounted to approximately 87 million metric tons (Mt). Out of this total, around 26.2% of the emissions were attributed to activities associated with power generation (British Petroleum, 2021). Indeed, harnessing Qatar’s abundant fossil fuel resources to introduce new renewable generation capacity into the grid would play an important role in reducing the country’s carbon footprint. By expanding the contribution of renewable energy (RE) to the nation’s energy mix, Qatar can lower its emissions and contribute to international efforts in combating climate change (Bohra and Shah, 2020). In this regard, Qatar has an average daily sun hour of 9.5 h with a global horizon irradiance (GHI) of 2,140 kWh/m2/year which makes it a promising location for solar PV systems (Govinda Rao and Al-Kuwari, 2013). Furthermore, Qatar exhibits promising potential for CSP due to its annual direct normal irradiance (DNI) surpassing the required installation threshold. With an annual DNI of over 2008 kWh/m2/year, it exceeds the necessary threshold of 1800 kWh/m2/year, making it conducive for the implementation of CSP projects. Moreover, Qatar’s average wind speed of approximately 4.4 m/s indicates suitability for the installation of small and medium-scale wind turbines. This wind speed range provides favorable conditions for generating wind energy, thereby offering opportunities for wind power projects in the country (Marafia and Ashour, 2002; Govinda Rao and Al-Kuwari, 2013).
Under the Environmental Development Pillar of the Qatar National Vision 2030, the State of Qatar aims to decrease pollution and environmental degradation. In a bid to support this pillar, Qatar’s water and electricity provider, KAHRAMAA has set a goal to meet 20% of its energy demand from RE by 2030. The annual electricity and water consumption for the year 2020 in Qatar were 49 TWh and 691 M m3, respectively, with an estimated 24 Mt of CO2 emitted from electricity generation activities (KAHRAMAA, 2020). Qatar’s installed electricity generation capacity is 10,579 MW where the maximum and minimum system load is 8600 MW and 2910 MW, respectively (KAHRAMAA, 2020). The initial goal was to reach 1800 MW of solar capacity by 2020 but that has been revised to 2030, however, an 800 MW grid-connected solar plant in Al-Kharsaah is under construction and is scheduled to be commissioned in the second half of 2022 (Gulf Times, 2020). In August of 2021, following the provisions and principles outlined in the United Nations Framework Convention on Climate Change (UNFCCC), the Ministry of Municipality and Environment in Qatar unveiled its Nationally Determined Contribution (NDC). The NDC outlines Qatar’s commitment to reducing its overall greenhouse gas (GHG) emissions as a response to the guidance provided in Article 4.4 of the Paris Agreement. Qatar has pledged to achieve a 25% reduction in its GHG emissions by the year 2030, relative to a baseline scenario. This commitment reflects Qatar’s dedication to actively contribute to global efforts in mitigating climate change and aligning with the goals outlined in the Paris Agreement. (Ministry of Municipality and Environment, 2021).
This study outlines several pathways, which Qatar can explore to achieve its national set goals of reducing GHG emissions by 25% and generating at least 20% of electricity from renewable resources by the year 2030. The RE generation capacity presented in this study is based on weather data from seven weather stations across Qatar. These weather stations take measurements of the wind and solar energy potential in Qatar. This is pioneer research as no literature is available on wind and solar energy generation potential that takes into consideration legal and physical limitations. For instance, a large portion of land is designated as natural reserves to protect wildlife, particularly Arabian Oryx. Similarly, the west coastline is highly populated with important life-supporting infrastructures, these areas occupy a significant portion of land that cannot be utilized for solar or wind energy generation. These legal and physical constraints were not accounted for in previous studies leading to significant uncertainty in national RE potential estimation. Furthermore, previous research has estimated wind power generation from a single location in the northern part mainly due to the data constraints (Marafia and Ashour, 2002; Alnaser and Almohanadi, 1990). This study in considering data from seven weather stations across the country can generate a more representative RE map for solar and wind energy generation and quantify the expected annual electricity generation from these plants. The study also explores Qatar’s potential for carbon offset through planting trees by identifying the date palm (Phoenix dactylifera) as a suitable tree species that would promote atmospheric CO2 sequestration in the country. Finally, the cost implication of offsetting emissions using verified carbon credits is considered and compared with the option of RE installation. Policy recommendations for emission reduction in other key sectors of the Qatar economy such as the energy industry, other petrochemical industries, and transportation are also made.
2 Methodology
In this section, the methodology employed in this study is described and discussed. Figure 1 illustrates the framework utilized in this research. The study is divided into four parts.
• Site selection for solar and wind plant installation in Qatar based on GIS and MCDM.
• Estimating RE production and carbon emission reduction from potential solar and wind farms in Qatar.
• Review and estimation of carbon offset potential in Qatar from planting date palm trees (Phoenix dactylifera).
• Explore potential pathways to 25% emission reduction by 2030 in line with Qatar National Vision based on the above findings.
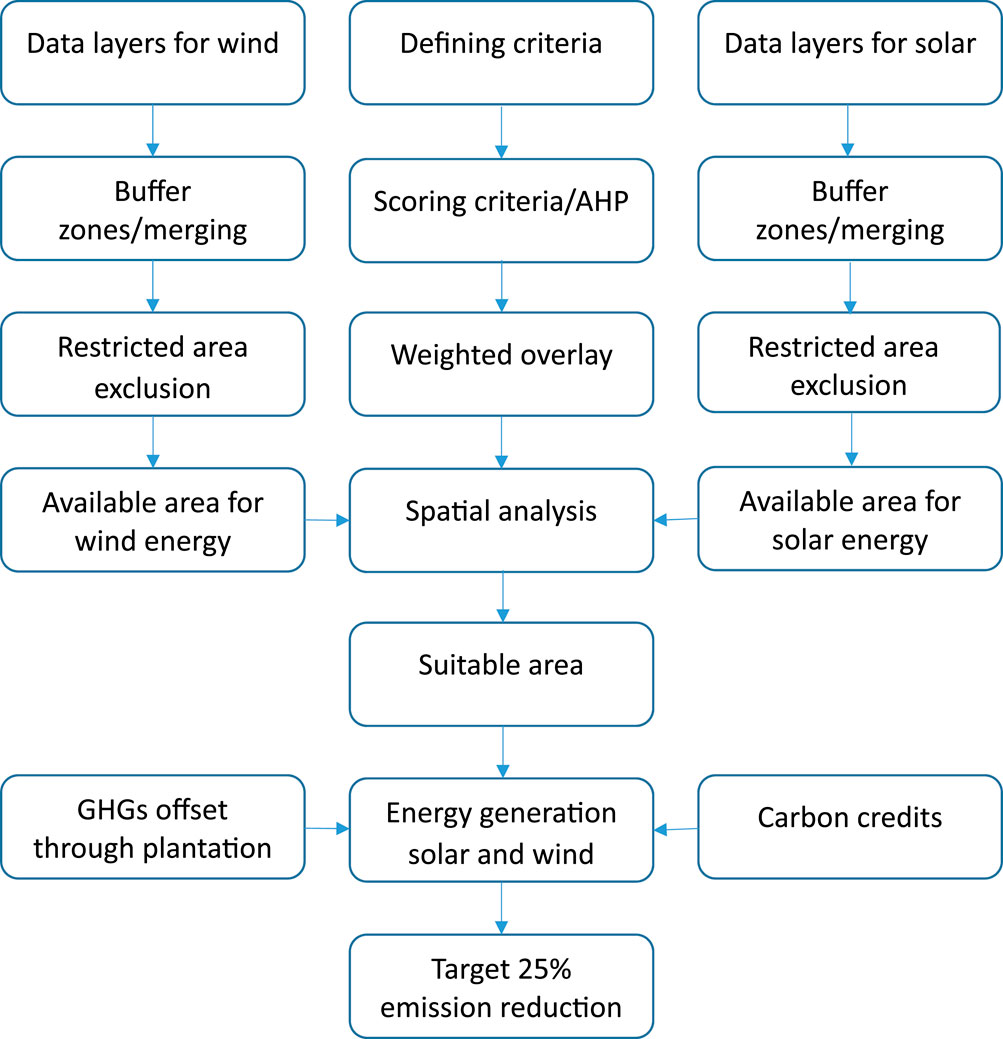
FIGURE 1. Overall methodological framework.
2.1 Site selection for potential renewable energy plants
This section discusses the various criteria considered in selecting the appropriate site for solar and wind energy installations in Qatar.
2.1.1 Study area
Qatar is a small arid peninsula that stretches northward from the Arabian Peninsula. It shares a border with United Arab Emirates and Saudi Arabia in the south. The majority of the area is flat ranging from 0 to 107 m above sea level (Figure 2). Dunes, limestones, and salt flats are the dominant topographic characteristics. The weather is hot and humid with a slightly cooler winter. Rainfall is scarce usually less than 79 mm per year, there are no surface water resources and water is provided by seawater desalination and groundwater extraction (Bilal et al., 2021). Urban and commercial activities are concentrated on the West Coast, especially in Doha, Al Wakrah, and Al Khor. As seen in Figure 2 majority of land is designated as protected areas including the fossil fuel reserves. Outdoor agricultural farms are situated in the North mainly because of favorable weather and soil conditions. Wind speed varies across the state with highs of over 6 m/s in Al Khor and Abu Samra. Global Horizontal Irradiance is mostly uniform with small variations in the coastal areas.
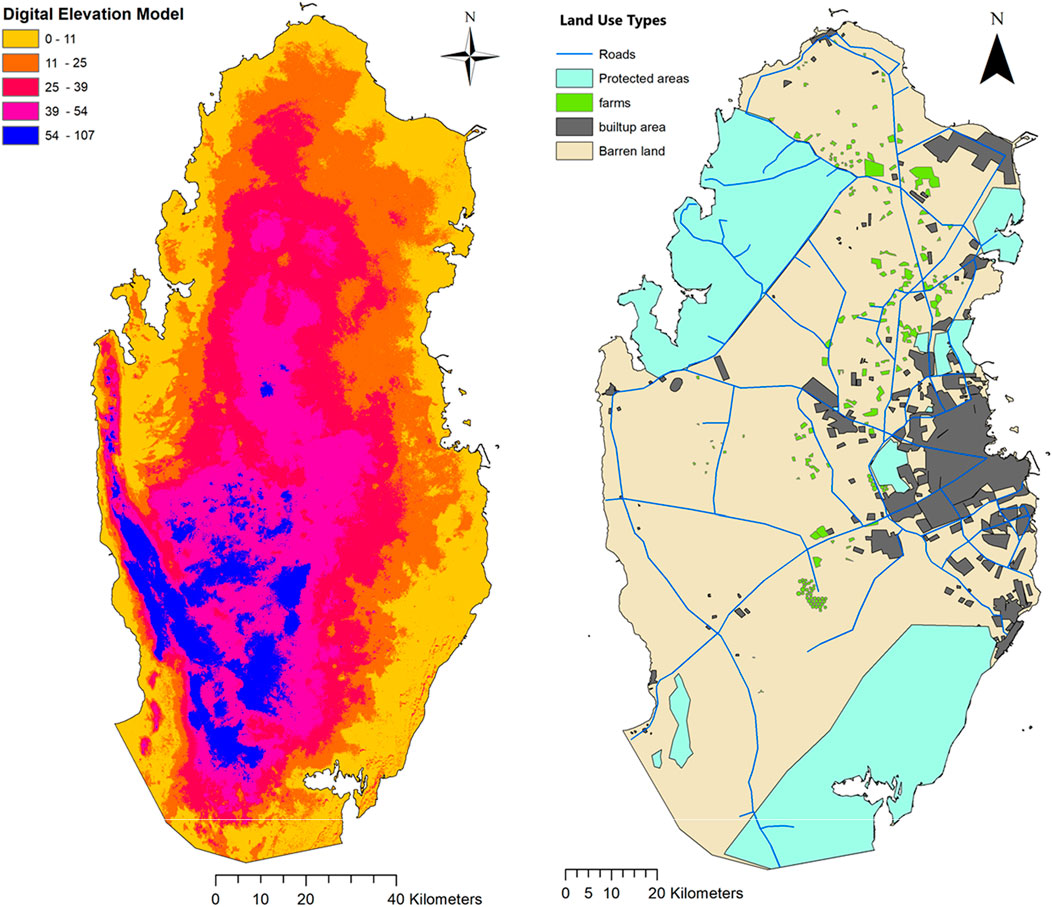
FIGURE 2. Digital elevation model (values in meters) and land use types of the State of Qatar.
2.1.2 Wind and solar data
Wind data from seven weather stations for the year 2016 at a 20 meter height was utilised (Qatar Meteorological Department, n.d.). The wind data was exported to ArcMap software for spatial interpolation and analysis using the inverse distance weighted (IDW) interpolation technique. Additionally, solar data was also acquired from the Global Solar Atlas administered by the World Bank. Digital elevation model data from SRTM 30 m resolution is used for the slope analysis.
2.1.3 Analytic hierarchy process
The study incorporates the Analytic Hierarchy Process (AHP) approach, initially introduced by Saaty (Saaty, 1987), to systematically evaluate the relative importance of criteria and sub-criteria to achieve a specific objective. The AHP methodology relies on expert opinions to determine the subjective importance of these criteria, which are then aggregated to make informed decisions. In the AHP, preferences are expressed using numerical values, typically ranging from 1 to 9, to denote the relative grades of compared criteria. A value of 1 indicates that the compared criteria are equivalent, while 9 signifies a strong preference for one criterion over another. This study considers 10 criteria/variables for the suitability analysis, including wind speed, solar irradiance, distance from the electricity grid, slope of the terrain, distance from urban areas, distance from protected areas, distance from roads, elevation, distance from wastewater treatment plants, and distance from the coastline. These variables play a significant role in determining the suitability of areas for solar and wind energy production. Additionally, the study accounts for factual reasons and legal regulations by excluding areas that are not suitable for solar and wind energy production. This exclusion process ensures that only feasible and compliant areas are considered in the analysis. This comprises areas such as built-up areas, protected areas, agricultural farms, and roads. In addition, a buffer zone is added to the restricted areas for further protection. Table 2 provides an overview of the restricted areas. The second step was to use the weighted overlay tool in ArcMap 10.4. This process involves overlaying several raster layers using a common measurement scale and weighing each according to its importance. Input maps are converted to raster format and reclassified. Each raster is assigned a new value based on the evaluation scale. The Reclassification tools provide an effective way to do the conversion. A restricted value is used to exclude restricted areas from the analysis.
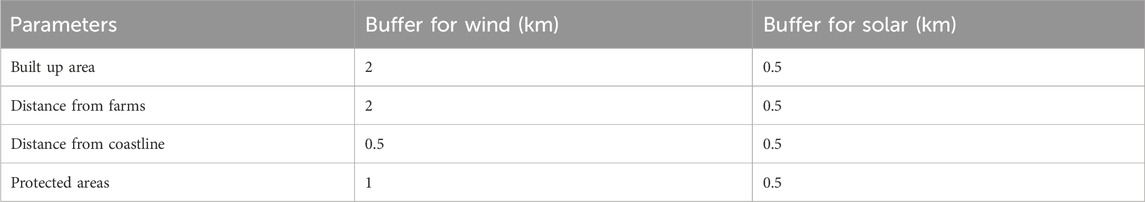
TABLE 2. Restricted areas and buffer zones.
2.2 Estimating output from renewable energy systems
The proposed renewable energy technologies (solar PV and wind) are accessed based on the proposed site suitability for each technology and the available renewable resources within the country. Using the maximum possible installed capacity of each technology based on the recommended suitable area, an assessment of renewable share, market economic results, and CO2 emissions are quantified using the EnergyPLAN tool.
2.2.1 EnergyPLAN
The EnergyPLAN program will be used for this section of the study. The program is a deterministic computer model that finds the optimal energy system configuration by performing hourly computations within a fixed timeframe (Østergaard, 2015). The key climatic variables used by EnergyPLAN in solar PV production estimates are solar radiation intensity, ambient temperature, wind speed, and relative humidity. Since the launch of the EnergyPLAN tool, it has been applied in over 100 peer-reviewed articles where it has been used to model and analyze various energy systems for 76 different counties (Lund and Clark, 2002; Lund and Münster, 2003; Lund, 2005; Lund, 2006; Chen et al., 2010; Liu et al., 2013; Okonkwo et al., 2017; Bamisile et al., 2020). The tool has also been used to analyze the grid integration of RE systems in Qatar’s electricity network (Okonkwo et al., 2021c). To run the simulation, EnergyPLAN needs meteorological data with a time resolution of 1 hour. Along with this data, other input parameters are needed, such as the annual demand for electricity, water, and cooling, plant capacity, system cost, and various optional simulation strategies that can be chosen. EnergyPLAN utilizes these inputs to analyze and generate outputs. The expected outputs from the simulation include the annual energy output, carbon emissions, and the total annual cost of the system. Lund (Lund, 2014) provided a comprehensive understanding of the principles and equations employed by EnergyPLAN in its analysis.
The economic model used by EnergyPLAN is based on cost inputs assigned to each technology. The cost input used for both solar PV and wind was obtained from the IRENA power generation cost of 2019 (IRENA, 2020) and the Danish Energy Agency cost estimation of 2030 as found on the EnergyPLAN database (Sustainable Energy Planning Research Group, 2018). The cost of the system is influenced by several key input parameters, including the initial investment cost, fixed and variable operations and maintenance (O&M) costs, the expected lifespan of the installation, and the prevailing interest rates. In addition, the study also takes into account the fuel cost, which is incorporated within the variable O&M cost, and the expenses associated with CO2 emissions. For this study, an interest rate of 3% is utilized. Table 3 provides a comprehensive overview of the cost inputs for both renewable and non-renewable energy systems.
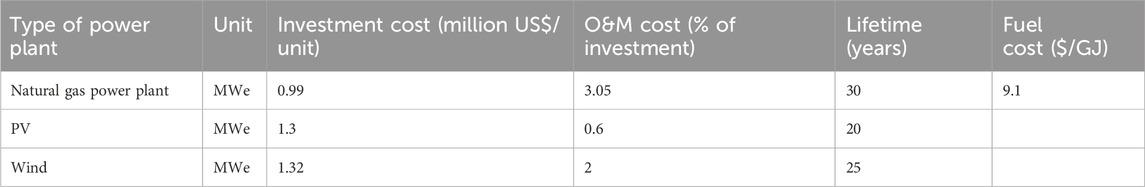
TABLE 3. Economic parameters for the various energy systems considered (Sustainable Energy Planning Research Group, 2018; IRENA, 2020).
2.3 Carbon offset potential of date palm trees
Date palm absorbs CO2 into organic compounds like sugar (glucose), oxygen, and water using sunlight just like other plants. To calculate the quantity of CO2 sequestered, the carbon stock of the tree is multiplied by a factor of 3.67, this factor represents the ratio of carbon dioxide to carbon in trees (Pascua et al., 2021).
2.4 Possible pathways for 25% reduction of carbon emissions by 2030
In this subsection, the study compares various ways of reaching the emissions target of a 25% reduction of GHG by 2030. The study compares the optimum RE installation in the country with the option of tree planting and buying verifiable carbon offset credits from the international market. The various scenarios are investigated under the following rule.
• The installed capacity of RE generation (solar PV and wind) is limited to the most suitable available area.
• The number of trees that can be planted is limited to 30% of the country’s total land area (3,600 km2).
3 Result and discussion
3.1 Restricted areas
Areas that are deemed unsuitable for wind energy development due to physical limitations and regulatory constraints are excluded from the estimation of wind and solar energy potential. Figure 3 illustrates the exclusion areas based on factors that strongly influence land exclusion.
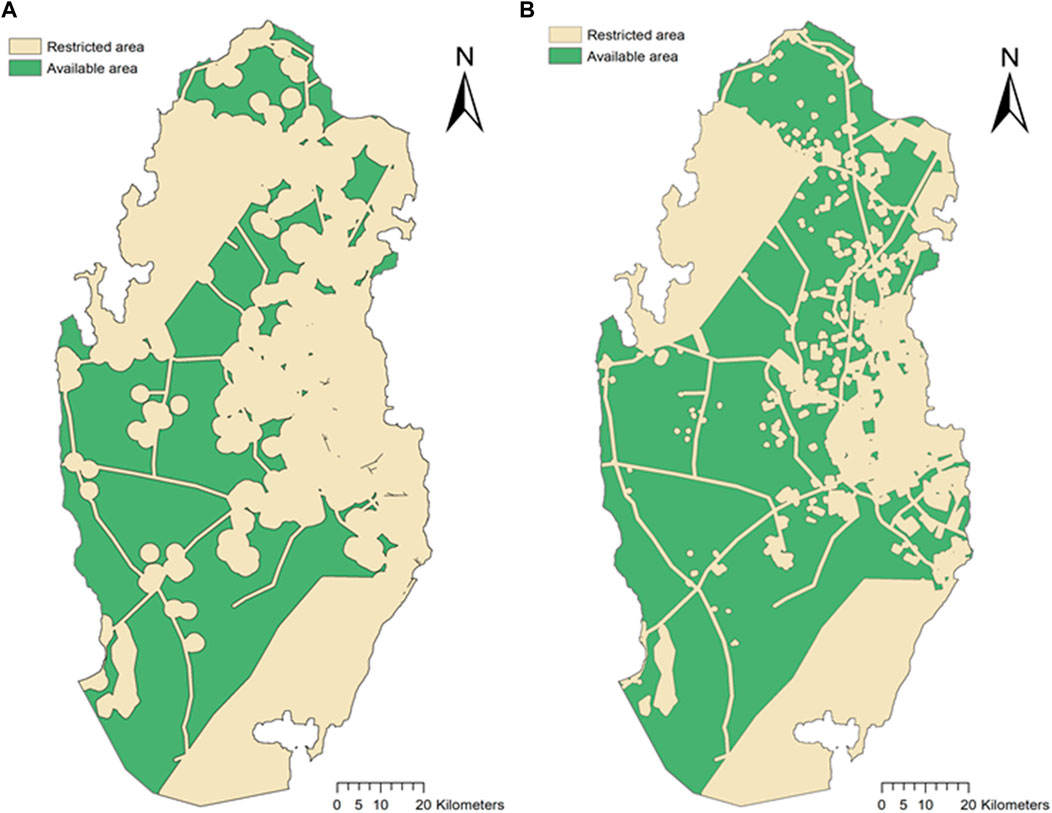
FIGURE 3. Restricted and available land area for wind (A) and solar (B) energy generation.
After removing these restricted areas, approximately 37% of the total area remains available for wind energy development, equivalent to 4,153 km2 out of the research site’s total size of 11,182 km2. When considering the size of the non-excluded zones, the municipalities of Shahanaya, Ar Rayyan, and Al Wakrah exhibit the greatest potential for wind energy development. Concerning the overall size of the municipal area, Ash Shamal also has a higher potential. However, the quality of wind in this area is low when compared to Al Khor, Dukhan, and Salwa. In comparison, a larger portion of land is available for solar energy generation 53% (5,899 km2) as compared to the area that is available for wind energy. The main reason for this land increment is the consideration of a larger buffer zone for wind energy generation to protect built and protected areas from the noise pollution created by the wind blades.
Concerning the type of excluded land, the majority of the land is excluded due to legal regulations concerning urban areas, farms, natural protected areas, coastal areas, and the distance buffer around them. The State of Qatar has twelve national reserves designated as protected areas, which consist of Al Reem Reserve, and Khor Al Adaid Reserve followed by smaller size reserves like Al Thakira, Al Eraiq, and Al Rafa Reserves. In addition to the buffer zone of 500 m, those areas close to the national protected areas are given low scores in the AHP. Wildlife including the Arabian Oryx and other reptiles are important natural assets to Qatar. To further enhance their protection, especially from wind turbine noise, surrounding areas are given lower scores while areas further away areas are given higher scores. Similarly, areas surrounding urbanized and farming areas are scored lower to protect residents from noise pollution.
3.2 Wind and solar energy potential
As shown in Figure 4, wind speed varies greatly over the State of Qatar. The northeastern coastal areas, particularly Al Khor and the eastern border areas with Saudi Arabia have greater wind energy potential. In addition, the coastal areas of Dukhan also exhibit positive wind energy potential. However, the majority of the available area in Al Shahaniya and Ar Rayyan municipality is of low wind speed meaning lower wind energy potential. Based on the average wind speed from 7 weather stations, the average wind speed is 5.5 m/s with over 6 m/s in some areas of Al Khor and Salwa. In contrast, solar energy is evenly distributed with small variation in coastal areas as water absorbs more incoming solar radiation as compared to sand because of differences in albedo thus affecting Global Horizontal Irradiance GHI. In addition, the soil texture also influences the GHI as shown in Figure 4. The northern areas have less GHI as compared to the Southern area mainly due to the different soil texture and presence of vegetation.
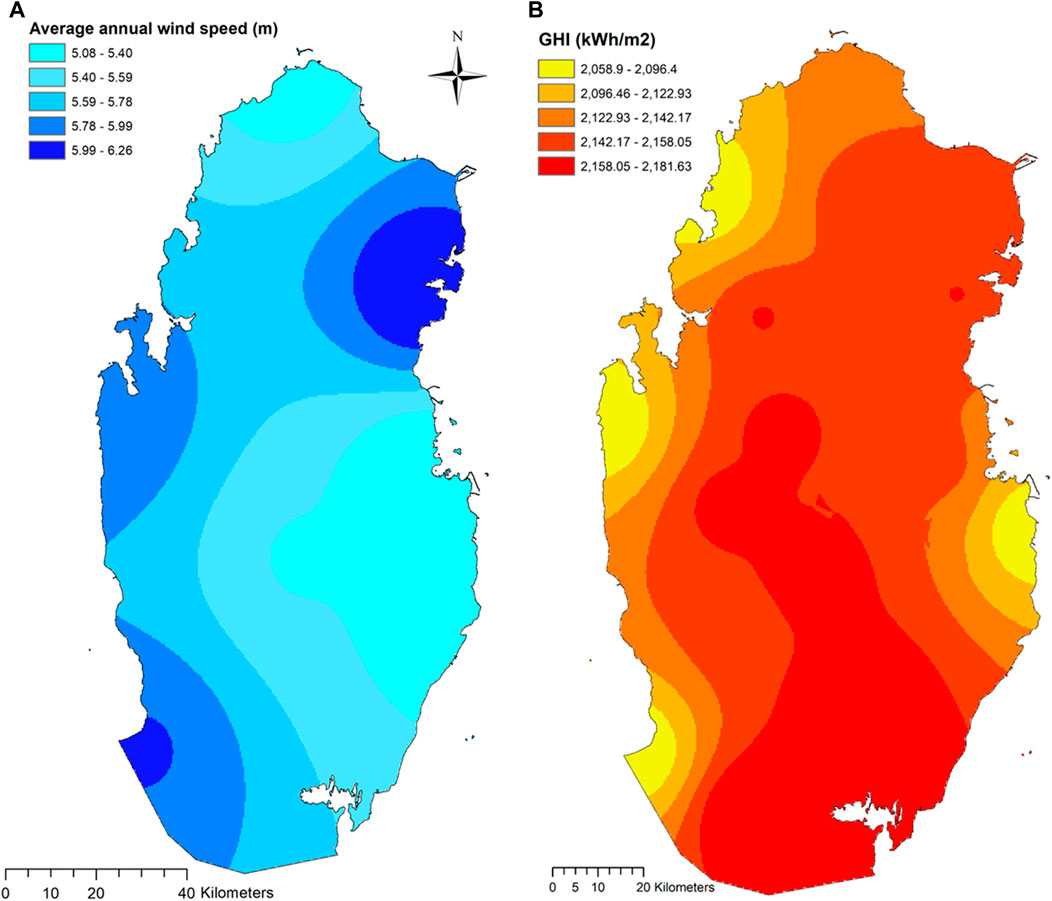
FIGURE 4. Wind (A) and solar (B) energy maps of the State of Qatar.
Based on the modeling, a land suitability map is generated for the potential wind energy generation locations. One of the most important criteria in wind suitability assessment was the wind speed, wind speed exceeds 6 m/s in the northeastern coastal areas in Al Khor and the south-western border area with Saudi Arabia in Abu Samra (Figure 5). From Figure 5, the areas with the darker shades of brown were identified as the most suitable areas for both wind and solar respectively, as compared to the areas within bright yellow colour. The most suitable area for wind is 26 km2 which is equal to 1% of the total available land for wind energy generation. The second most suitable area is 663 km2 abundantly available in the southwestern coastal areas in Abu Samra and Dukhan and the northeastern areas in Al Khor. The average wind speed in this area is 5.8 m/s which is considered preferred for wind energy generation. The remaining area is moderately and equally suitable for wind energy generation and this area is mostly available in the western coastal areas as most of the eastern coastal areas are urbanized and excluded from the modelling. The indices used in Figure 5 can be better understood using Table 4.
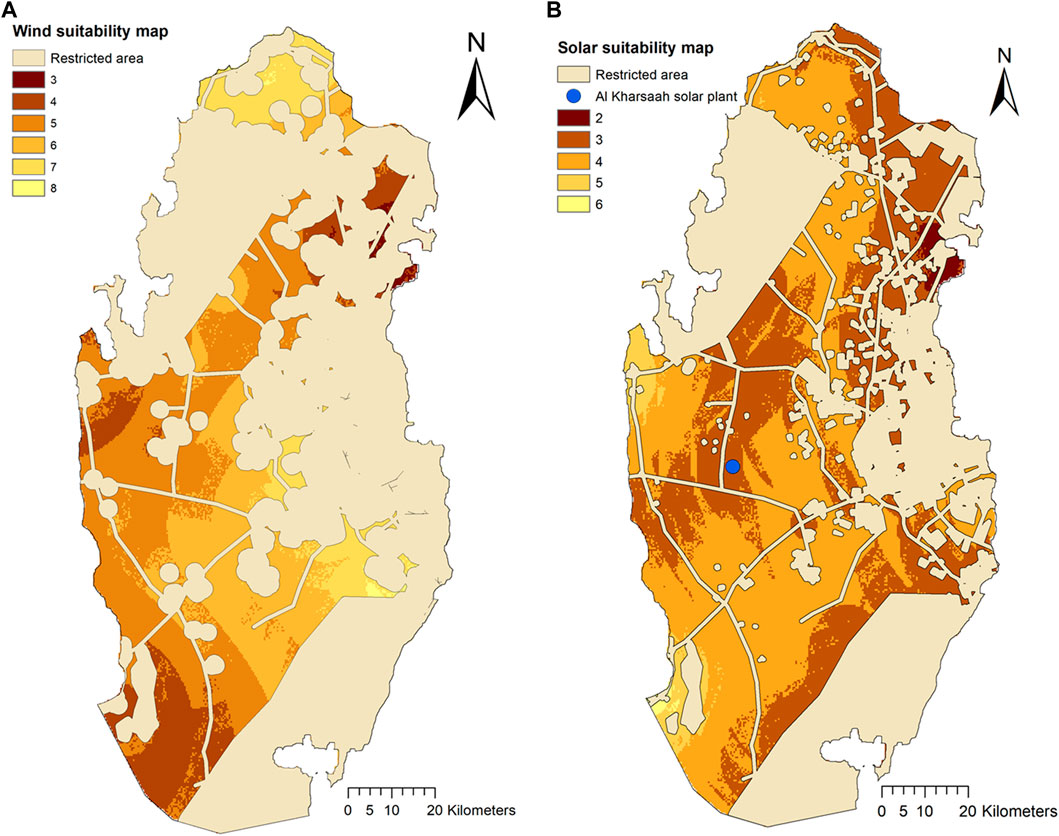
FIGURE 5. Land suitability index for wind (A) and solar (B) energy site selection.
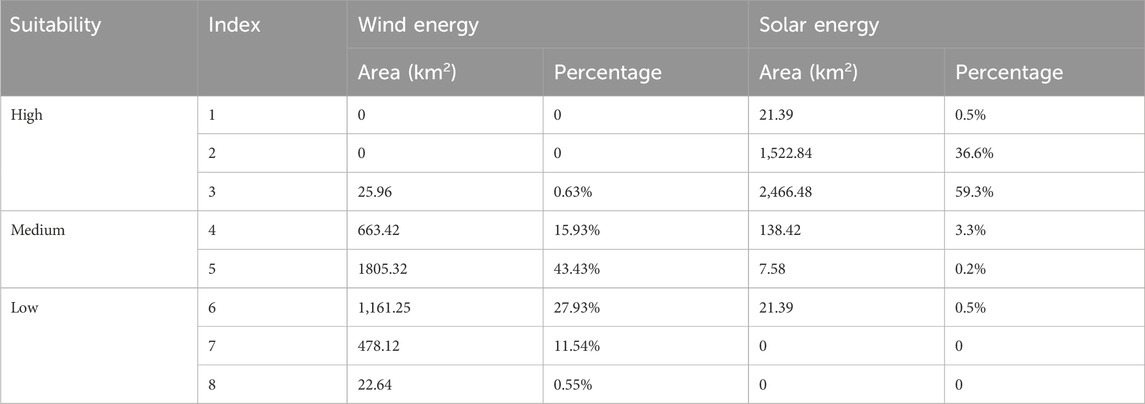
TABLE 4. Summary of land suitability for solar and wind energy generation.
In comparison to wind energy, a larger area is available for solar energy generation. Since the solar irradiance is almost uniform in the State of Qatar with some minute variation in the coastal areas and northern areas the resultant solar suitability map is uniform in terms of suitable land types. A total of 7,889 km2 (53%) area is available for solar energy generation. This area is further assessed for solar energy generation suitability based on the high medium and low criteria. A highly suitable area for solar installation is located in the north-eastern coastal area of Al Khor which is about 21 km2. The second most suitable area is situated near the urban settlement on the east coast while a large portion of this land is also identified on the west coast. The size of this area is 1,523 km2 almost 37% of the total available land. Interestingly, the Al Kharsaah solar power plant (800 MWp) which was expected to be completed by 2022 also comes under the second most suitable land type area (Figure 5). These two land types are located close to urban and protected areas this is because wastewater treatment plants are installed in the urban areas. Wastewater is used for the cleaning of solar panels as dust is one of the most important limiting factors for the solar industry in the State of Qatar. In addition, the use of seawater is not considered in the AHP process as saline water has negative impacts on the efficiency and lifespan of solar panels. The remaining identified suitable area is scattered in the western coastal areas and northern areas. A summary of the land suitability for wind and solar is presented in Table 4.
3.4 Large-scale PV and wind plant production
The section presents the results of the gross electricity production from RES installed based on the highly suitable areas presented in Table 4. For wind energy, the installed capacity is limited to the 663.42 km2 (15.93%) suitability presented in Table 4. While for solar PV, installed capacity is initially limited to a 2,000 MW plant representing the 1% most suitable area. According to the National Renewable Energy Laboratory, the capacity-weighted average land use for solar PV is 8.3 acres (0.033 km2)/MW (Ong et al., 2013), and the capacity density of 3.0 ± 1.7 23 MW/km2 for wind energy (Paul et al., 2009).
Table 5 shows the result from the EnergyPLAN simulation. In Table 5, the natural gas column represents the base case where all the electricity needs of 49 TWh/year are met by natural gas power plants alone. The subsequent column shows the effect of adding the RES to the energy mix and their subsequent effect on the total cost of the Qatar energy system, CO2 emissions, and percentage emission reduction witnessed. Adding wind energy to the current system is seen to reduce emissions by 11% as compared to 7.3% from the 2,000 MW solar PV plant. The cost parameter shows that installing renewables would be cheaper over the lifetime of the project due to the recurring cost of natural gas used to run the power plant.
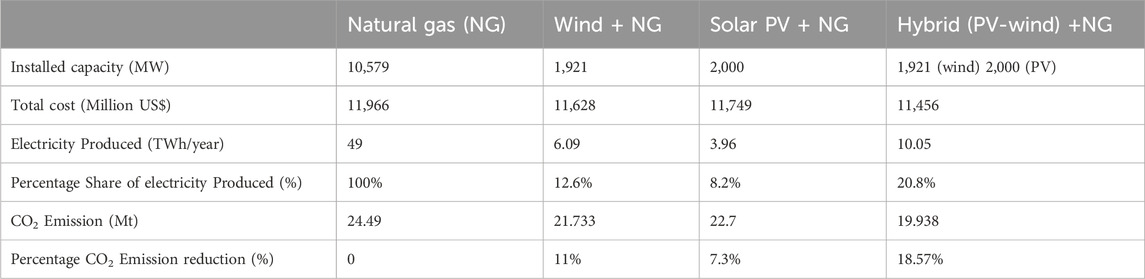
TABLE 5. Results from EnergyPLAN simulations.
Figure 6 shows the renewable share of electricity produced for a 2,000 MW solar PV plant (blue), a 1921 MW wind plant (orange), and a hybrid (grey) of both systems connected to the existing electricity grid. RES share of electricity produced is seen to peak in May-June for the hybrid system with about 27% share due to the peak solar outputs within that period of the year. Figure 7 illustrates the effect of increasing the capacity of each RES technology on the emissions. It is observed that by adding a thousand MW of solar PV (3,000 MW) the emissions decreased by 0.9 Mt of CO2 and by 1.44 Mt if 3,000 MW of wind energy could be installed. The results show that Qatar has the potential to meet 20% of energy demand by 2030 from renewable sources using solar PV or a hybrid of wind and solar. In addition, while land suitability might not favor greater than 2,000 MW installation for onshore wind energy, the country has the option of harnessing its huge coastline for offshore wind energy.
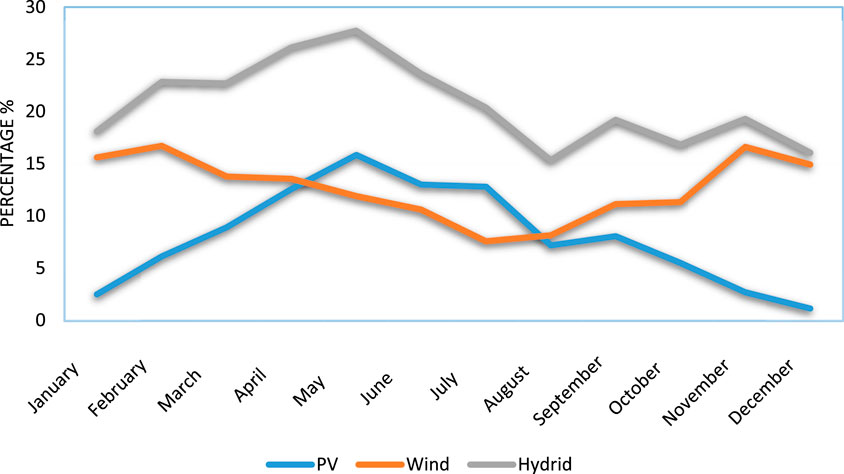
FIGURE 6. The percentage share of RE to electricity produced.
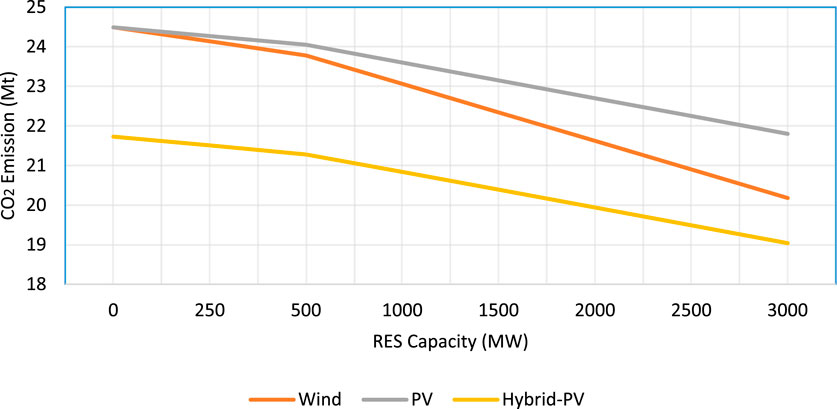
FIGURE 7. Impact of increase in the share of RE on CO2 emissions.
3.5 Carbon offset by planting trees and buying carbon offset credits
An endeavor to develop date palm plantations in the country would benefit the nation significantly in the area of carbon sequestration, job creation, export earnings as well and enhancing biodiversity. Abu-Qaoud (Abu-Qaoud, 2015) estimates that the cost of establishing a date palm offshoot is US$ 100 for the first 3 years. After which production begins in the 4 years and the cost of a tree becomes positive (+US$ 50), with revenue coming from both fruit and offshoots (Daiq, 2007). It should be noted that there is no recent study on the cost of planting date palms in Qatar. Abu-Qaoud’s (Abu-Qaoud, 2015) study was conducted in Palestine during a period that is not recent. Palestine shares a similar climatic profile with Qatar although we envisage that there will exist possible variations in the cost of planting in Qatar due mainly to the higher water stress in Qatar. Based on photosynthesis calculation from Sharif et al. (Sharif et al., 2010), a matured date palm tree (>10 years) would lead to a reduction of about 200 kg (0.2 tonnes) of CO2 annually. Hence, 10 million trees would absorb 2 Mt of CO2 annually, and an estimated 36 km2 would be sufficient to plant one million date palm trees if they are planted about 5.5 m apart. It should be noted that the carbon stock of date palm trees varies based on the location where they are planted and the ecosystem of the soil. Table 6 shows the projected revenue and cost expected from a date palm tree.
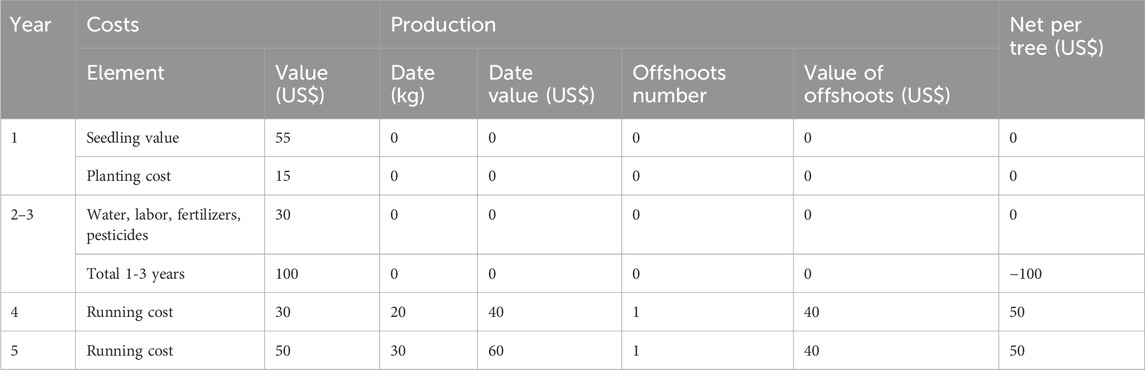
TABLE 6. Estimated cost and revenue expected from one date palm tree (Daiq, 2007; Abu-Qaoud, 2015).
The optimum case presented in this study by adopting RE systems and planting trees could lead to a net annual 12.42 Mt reduction in carbon emissions from the electricity sector. This would represent a reduction of 50.7% in electricity and heating-related emissions but only 14.28% of overall emissions by the country. Table 7 shows the impact of our optimum installed capacity per thousand megawatts on the carbon emissions from this sector. The 14.28% reduction from using RE systems (Solar PV and Wind), and planting date palm trees are short of the 25% (21.75 Mt) national target set for 2030. To achieve the target an additional 7.42 Mt needs to be removed from the current emissions level of 87 Mt per annum.
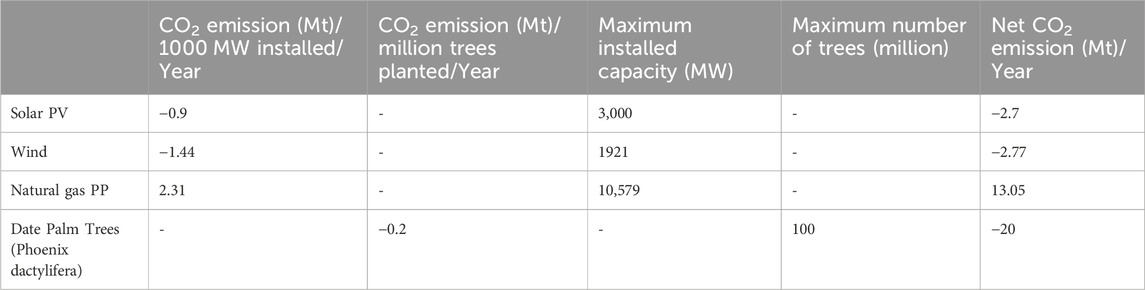
TABLE 7. CO2 emission reduction by installed capacity (1000 MW) of power generation and planting date palm.
The international carbon credit market offers another opportunity for corporate bodies to buy verifiable carbon credits to offset their unavoidable carbon emissions. While the cost of carbon credits varies based on project type, size, location, and other determining factors, the New York Mercantile Exchange, Global Emissions Offset CBL futures traded at US$ 7.53/ton in January 2022. This market could evolve to primarily help countries achieve their climate targets–a possibility outlined at COP-26 in Glasgow. Should this be the case, Bloomberg New Energy Finance estimates that the price for verified carbon offset credits could cost $11/ton by 2030, up from just $2.50 in 2020 (Bloomberg New Energy Finance, 2022). Figure 8 presents a cost comparison of various pathways to achieving a 25% (21.75 Mt) reduction in carbon emissions over 20 years. The options presented include:
• Using only verified carbon credit to offset 25% (21.75 Mt) of carbon emissions in Qatar.
• Using RES (Solar PV and Wind (5.47 Mt)), date palm trees (20 Mt), and verified carbon credit (7.42 Mt) to offset carbon emissions in Qatar.
• Using a combination of date palm trees (20 Mt) and verified carbon credit (1.75 Mt) to offset 25% of carbon emissions in Qatar.
• Using RE systems only (Solar PV and Wind) to offset 5.47 Mt (6.29%) of carbon emissions in Qatar.
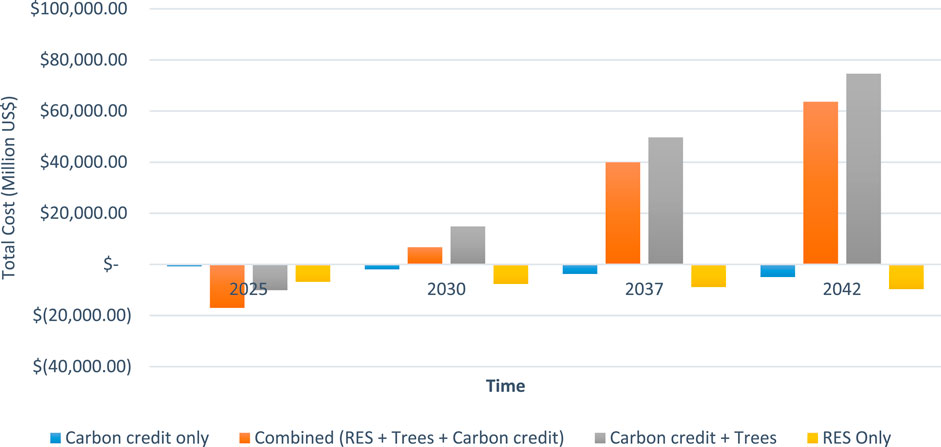
FIGURE 8. Cost comparison of emission reduction options over 20 years.
Figure 8 is computed based on data from Tables 3 and 6, at an annual interest rate of 3%. The figure shows that while the first 3 years would not have a positive yield on any of the emission reduction options, considerable returns on investments are seen from 2030 for all options paired with the date palm tree due to the potential profits from harvesting their dates.
3.6 Policy recommendations for emission reduction in other sectors
So far, this study has focused on emissions related to the electricity and heat sectors. The global share of renewable energy use is significantly improving in the electricity generation sector as compared to other sectors (REN 21, 2020). However, a collective effort to decarbonize all sectors is needed if the set goal of 25% by 2030 is to be attained. Figure 9 shows the carbon emissions by sector in Qatar since 1990. Emissions from Qatar’s energy industry accounted for 36% of total emissions in the country in 2019. This is due to the exploration and refining of crude oil and natural gas in the country. As this is a difficult-to-decarbonize sector and a major revenue earner for the country, certain measures can be taken to limit emissions from this sector.
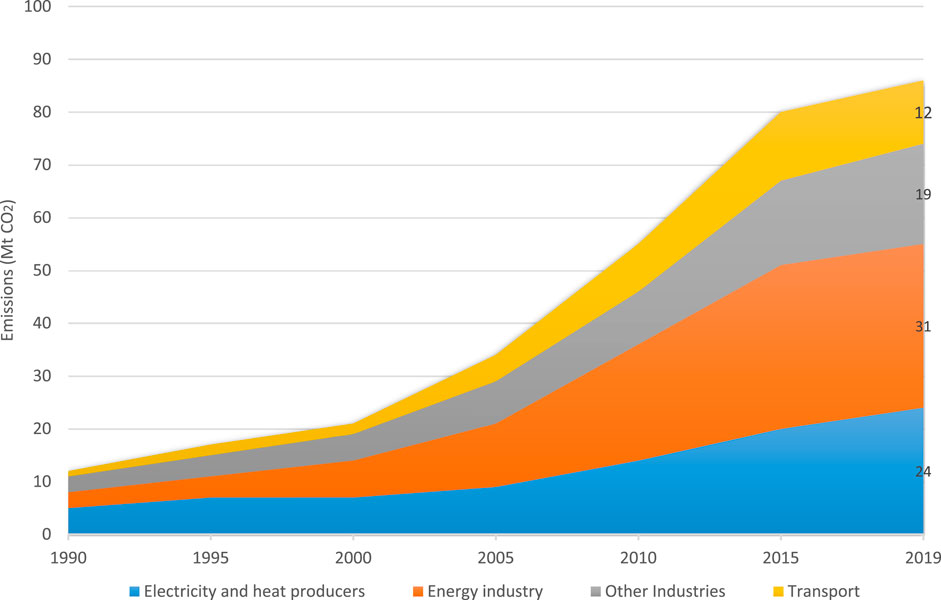
FIGURE 9. CO2 emissions by sector, Qatar 1990–2019 (Antoine Ibrahim et al., 2021).
3.6.1 Electricity, heat and cooling
In addition to the aforementioned strategies, demand-side management presents another avenue to reduce emissions in the electricity sector. Implementing policies that promote effective electricity usage can contribute to emission reduction without significant changes in technology. Qatar has already taken steps in this direction through its Qatar National Vision, which includes awareness campaigns, standardization efforts, and seasonal shutdowns aimed at reducing electricity intensity. These measures are expected to result in a 7% reduction in total power generation, as they encourage improved efficiency in buildings. Further policies can be implemented to promote the design and use of green buildings, phase out inefficient technologies, install motion sensor lighting, and implement effective water management practices. These measures collectively reduce electricity consumption and the associated emissions. To encourage private sector investment in the renewable energy sector, it is suggested that utility companies may purchase RE from individuals and cooperative bodies. This would provide an incentive for private sector involvement and investment in renewable energy projects, contributing to the overall growth of the sector.
3.6.2 Energy industries
The emissions from many industries are more difficult to attribute to one country as these sectors manufacture products that are used in many other countries of the world. Unlike in electricity generation, for energy-intensive industries, a strategy that considers its global interaction is needed. Global, national, or regional collaboration is needed in drafting policies for decarbonizing these industries. Once policies and targets are set and communicated, it should then be up to the local government and industry stakeholders to map out road maps or pathways that focus on their particular competitive (dis) advantages and potential markets (Bataille et al., 2018). Industrial decarbonization will only succeed when solutions involve all the key actors in their supply chain (e.g., government, basic materials producers, manufacturers, and retailers). Pooling research and development efforts, as well as piloting net-zero technologies, are crucial for fostering global collective learning and achieving risk and cost diversification. By collaborating across various firms and government entities, knowledge and resources can be shared to accelerate the development and implementation of net-zero technologies.
A global carbon tax is widely regarded as a promising approach to expedite the decarbonization process across various industries. By imposing carbon taxes, not only would the continued use of carbon-intensive activities be discouraged, but it would also stimulate investment and development in new technologies. The implementation of carbon taxes can generate revenue that can be directed towards funding low-interest loans, research grants, and subsidies aimed at promoting the adoption and enhancing the price competitiveness of renewable energy (RE) infrastructure. These measures would incentivize the transition to renewable energy sources and accelerate the deployment of energy-efficient processes. Furthermore, the use of carbon capture and storage (CCS) can be encouraged in the upstream oil and gas industries. This approach allows for the continued utilization of fossil fuels while significantly reducing associated emissions in this sector. Overall, a global carbon tax would provide both economic and environmental benefits by driving the shift towards cleaner energy alternatives, promoting innovation, and mitigating greenhouse gas emissions in key industries (Ghiat and Al-Ansari, 2021).
3.6.3 Other industries
Many of the industries in this section such as the chemical (plastic, fertilizers), metallurgical (aluminum, copper, iron, and steel making), and non-metallic minerals (ceramics, cement, lime, glass) are seen as hard to decarbonize because of their high-energy intensive processes. High-temperature process heat, necessary for iron and steel making, is typically generated by burning fossil fuels. In other to decrease the emissions from these sectors, energy efficiency must be of high priority. Process integration of plants can help the utilization of waste heat, along with the use of heat pumps and steam recovery heat generators, which can lead to a reduction in primary energy demand (Bamisile et al., 2020; Papadis and Tsatsaronis, 2020; Ghiat et al., 2021). The possibilities of switching fuels by using green hydrogen (Okonkwo et al., 2021b) in combustion and the electrification of some processes should be explored where possible, as these can decrease CO2 emissions in these sectors. In addition, behavioral changes by end users can decrease demand and lead to a reduction in emissions from these sectors. An example would be a shift in the use of plastic products; such a shift would not only decrease fuel consumption in this sector but would also lead to a reduction in waste. Another way to encourage behavioral change by end-users is to incorporate end-user (instead of production) based consumption carbon pricing. This is a way to initiate carbon content in decision-making at all levels of the product’s life cycle (from initial demand to material selection and production and finally end-use design).
3.6.4 Transportation
Transportation is a key sector that accounts for about 14% of local emissions in Qatar. A study on the deep decarbonization pathway for Latin America shows that low-carbon transportation can be met through different combinations of municipal planning, construction of new transit infrastructure, electrification of urban buses, trains, and vehicles, and alternative use of net-zero liquid fuels (e.g., sustainable biodiesel and ethanol) (Bataille et al., 2020). A viable policy for Qatar to consider is shifting a significant portion of its new investment towards low and zero-emission higher-capacity transport options and urban planning, as opposed to focusing primarily on lower occupancy gasoline vehicles. Liquid fuels dominate aviation and maritime transportation, and these fuels can be substituted with biofuels and new emission-free liquid fuels with minor adaptations to the existing infrastructure (Al-enazi et al., 2021; Al-enazi et al., 2022). Al-Buenain et al. (Al-Buenain et al., 2021) assert that Qatar can decrease the emissions from road transportation but requires strong government incentives to do so if it intends to reach its ambiguous target of decarbonizing mobility on roads with 10% electric vehicles by 2030. By conducting a well-to-wheel life cycle assessment, they concluded that even when powered by electricity from natural gas, EVs outperformed conventional gasoline vehicles with a difference of 12,000 gCO2eq/100 km traveled. Policies that incentivize the use of electric vehicles (EVs) are also needed. While electrifying heavy-duty and long-haul transport is presently challenging. Efforts can be made to improve vehicle fuel-efficiency standards by placing stringent emission limits on new vehicles. Implementing this approach would lead to a reduction in black carbon emissions linked to these vehicles, result in cost savings for consumers in terms of fuel expenses, and drive the adoption of electric vehicles in the market.
4 Conclusion
This study explores pathways, which Qatar can take to achieve its national set goals of reducing greenhouse gas emissions by 25% and generating at least 20% of its electricity from renewable resources by the year 2030. Wind and solar energy are two of the most abundant and important RE sources. The State of Qatar is rich in both renewable and non-RE resources. This study finds that considerable high-quality land is available for both solar (53%) and wind (37%) energy generation. However, after accounting for site selection criteria the results indicated that only 6.2% and 13.8% of Qatar is highly suitable for wind and solar energy installations, respectively. The most suitable areas for wind energy generation are located on the east coast around the Al Khor area and in the southwestern border area with Saudi Arabia. Wind speed in these areas exceeds 6 m/s and is considered best for wind energy generation. In comparison, a larger area is available for solar energy generation. Highly suitable areas for solar energy generation are in the eastern coastal areas near the urban settlement. These areas are suitable due to the availability of several wastewater treatment plants that can be used for cleaning the solar panels. The remainder of the suitable areas are identified in the western and northern areas. Qatar has the potential to meet 20% of energy demand by 2030 from renewable sources using solar PV or a hybrid of wind and solar. In addition, while land suitability might not favor greater than 2000 MW installation for onshore wind energy, the country has the option of harnessing its huge coastline for offshore wind energy. Finally, planting date palm trees (Phoenix dactylifera), would benefit the nation significantly, as an estimated 20 Mt of CO2 can be sequestered annually from them, and its revenue generation potential makes it a more cost-effective means of CO2 removal when compared to purchasing verified carbon credits.
Data availability statement
The original contributions presented in the study are included in the article/Supplementary Material, further inquiries can be directed to the corresponding author.
Author contributions
HB: Conceptualization, Data curation, Investigation, Methodology, Writing original draft. ECO: Conceptualization, Methodology, Writing original Draft. TA-A: Conceptualization, Methodology, Writing–review and editing, Supervision, Resources.
Funding
The author(s) declare financial support was received for the research, authorship, and/or publication of this article. This research was funded by the Qatar National Research Fund (QNRF) under the National Priorities Research Program (NPRP) (grant number NPRP11S-0107-180216).
Acknowledgments
The authors would like to thank Hamad Bin Khalifa University Qatar and Qatar National Research Fund for supporting this research.
Conflict of interest
The authors declare that the research was conducted in the absence of any commercial or financial relationships that could be construed as a potential conflict of interest.
Publisher’s note
All claims expressed in this article are solely those of the authors and do not necessarily represent those of their affiliated organizations, or those of the publisher, the editors and the reviewers. Any product that may be evaluated in this article, or claim that may be made by its manufacturer, is not guaranteed or endorsed by the publisher.
References
Abu-Qaoud, H. (2015). Date palm status and perspective in Palestine, Date Palm Genetic Resources and Utilization, Vol. 2. Asia and Europe, 423–439. Available at: https://link.springer.com/chapter/10.1007/978-94-017-9707-8_13.
Al-Buenain, A., Al-Muhannadi, S., Falamarzi, M., Kutty, A. A., Kucukvar, M., and Onat, N. C. (2021). The adoption of electric vehicles in Qatar can contribute to net carbon emission reduction but requires strong government incentives. Vehicles 3 (3), 618–635. doi:10.3390/vehicles3030037
Al-enazi, A., Bicer, Y., Okonkwo, E. C., and Al-ansari, T. (2022). Evaluating the utilisation of clean fuels in maritime applications: a techno-economic supply chain optimization. Fuel 322 (April), 124195. doi:10.1016/j.fuel.2022.124195
Al-enazi, A., Okonkwo, E. C., Bicer, Y., and Al-ansari, T. (2021). A review of cleaner alternative fuels for maritime transportation. Energy Rep. 7, 1962–1985. doi:10.1016/j.egyr.2021.03.036
Al Garni, H. Z., and Awasthi, A. (2017). Solar PV power plant site selection using a GIS-AHP based approach with application in Saudi Arabia. Appl. Energy 206 (October), 1225–1240. doi:10.1016/j.apenergy.2017.10.024
Al-khayri, J. M., Mohan, S., and Dennis, J. (2015). Date palm genetic resources and utilization. Springer Netherlands. Available at: https://link.springer.com/book/10.1007/978-94-017-9694-1.
Alnaser, W. E., and Almohanadi, A. H. (1990). Wind and solar energy in Qatar. Energy 15 (10), 931–934. doi:10.1016/0360-5442(90)90075-d
Aly, A., Jensen, S. S., and Pedersen, A. B. (2017). Solar power potential of Tanzania: identifying CSP and PV hot spots through a GIS multicriteria decision making analysis. Renew. Energy 113, 159–175. doi:10.1016/j.renene.2017.05.077
Antoine Ibrahim, I., Ötvös, T., Gilmanova, A., Rocca, E., Ghanem, C., and Wanat, M. (2021). International energy agency. Wolters Kluwer.
Anwarzai, M. A., and Nagasaka, K. (2017). Utility-scale implementable potential of wind and solar energies for Afghanistan using GIS multi-criteria decision analysis. Renew. Sustain. Energy Rev. 71 (December 2016), 150–160. doi:10.1016/j.rser.2016.12.048
Ao Xuan, H., Vu Trinh, V., Techato, K., and Phoungthong, K. (2022). Use of hybrid MCDM methods for site location of solar-powered hydrogen production plants in Uzbekistan. Sustain. Energy Technol. Assessments 52 (PA), 101979. doi:10.1016/j.seta.2022.101979
Atici, K. B., Simsek, A. B., Ulucan, A., and Tosun, M. U. (2015). A GIS-based Multiple Criteria Decision Analysis approach for wind power plant site selection. Util. Policy 37, 86–96. doi:10.1016/j.jup.2015.06.001
Aydin, N. Y., Kentel, E., and Sebnem Duzgun, H. (2013). GIS-based site selection methodology for hybrid renewable energy systems: a case study from western Turkey. Energy Convers. Manag. 70, 90–106. doi:10.1016/j.enconman.2013.02.004
Azizkhani, M., Vakili, A., Noorollahi, Y., and Naseri, F. (2017). Potential survey of photovoltaic power plants using Analytical Hierarchy Process (AHP) method in Iran. Renew. Sustain. Energy Rev. 75 (2016), 1198–1206. doi:10.1016/j.rser.2016.11.103
Bamisile, O., Huang, Q., Dagbasi, M., Adebayo, V., Okonkwo, E. C., Ayambire, P., et al. (2020). Thermo-environ study of a concentrated photovoltaic thermal system integrated with Kalina cycle for multigeneration and hydrogen production. Int. J. Hydrogen Energy 45 (51), 26716–26732. doi:10.1016/j.ijhydene.2020.07.029
Bataille, C., Åhman, M., Neuhoff, K., Nilsson, L. J., Fischedick, M., Lechtenböhmer, S., et al. (2018). A review of technology and policy deep decarbonization pathway options for making energy-intensive industry production consistent with the Paris Agreement. J. Clean. Prod. 187, 960–973. doi:10.1016/j.jclepro.2018.03.107
Bataille, C., Waisman, H., Briand, Y., Svensson, J., Vogt-Schilb, A., Jaramillo, M., et al. (2020). Net-zero deep decarbonization pathways in Latin America: challenges and opportunities. Energy Strategy Rev. 30 (July), 100510. doi:10.1016/j.esr.2020.100510
Betemariyam, M., and Kefalew, T. (2022). Carbon stock estimation of mixed-age date palm (Phoenix dactylifera L.) farms in northeastern Ethiopia. Heliyon 8 (1), e08844. doi:10.1016/j.heliyon.2022.e08844
Bilal, H., Govindan, R., and Al-Ansari, T. (2021). Investigation of groundwater depletion in the state of Qatar and its implication to energy water and food nexus. WaterSwitzerl. 13 (18), 2464. doi:10.3390/w13182464
Bloomberg New Energy Finance (2022). Long-term carbon offset outlook 2022. Available at: https://spotlight.bloomberg.com/story/longtermcarbonoffsetsoutlook2023/page/1?bbgsum-page=DG-WS-PROF-BLOG-POST-160708&tactic-page=726211&_gl=1*40x2kx*_ga*MTQ2OTc3MjgxNi4xNzA1ODAwMDUy*_ga_NNP7N7T2TG*MTcwNTgwMDA1Mi4xLjEuMTcwNTgwMTAxMi41OC4wLjA.
Bohra, M., and Shah, N. (2020). Optimising the role of solar PV in Qatar’s power sector. Energy Rep. 6, 194–198. doi:10.1016/j.egyr.2019.11.062
British Petroleum (2021). Statistical review of world energy. BP Energy Outlook 2021, 70. Available at: https://www.bp.com/content/dam/bp/business-sites/en/global/corporate/pdfs/energy-economics/statistical-review/bp-stats-review-2021-full-report.pdf.
Broekhoff, D., Gillenwater, M., Colbert-Sangree, T., and Cage, P. (2019). Securing cimate benefit: a guide to using carbon offsets. Stockholm Environment Institute and Greenhouse Gas Management Institute. Available at: https://www.offsetguide.org/wp-content/uploads/2020/03/Carbon-Offset-Guide_3122020.pdf.
Charabi, Y., and Gastli, A. (2011). PV site suitability analysis using GIS-based spatial fuzzy multi-criteria evaluation. Renew. Energy 36 (9), 2554–2561. doi:10.1016/j.renene.2010.10.037
Chen, M., Lund, H., Rosendahl, L. A., and Condra, T. J. (2010). Energy efficiency analysis and impact evaluation of the application of thermoelectric power cycle to today’s CHP systems. Appl. Energy 87 (4), 1231–1238. doi:10.1016/j.apenergy.2009.06.009
Coracero, E. E., and Malabrigo, P. (2020). Carbon storage potential of the tree species along the ultramafic forest in sitio dicasalarin, barangay zabali, baler, aurora, Philippines. AIMS Environ. Sci. 7 (6), 589–601. doi:10.3934/environsci.2020037
Daiq, I. (2007). Date palm economics and cultivation circumstances in Palestine. Acta Hortic. 736, 97–104. doi:10.17660/actahortic.2007.736.7
Darwish, M. A., and Mohtar, R. (2013). Qatar water challenges. Desalination Water Treat. 51 (1–3), 75–86. doi:10.1080/19443994.2012.693582
Doljak, D., and Stanojević, G. (2017). Evaluation of natural conditions for site selection of ground-mounted photovoltaic power plants in Serbia. Energy 127, 291–300. doi:10.1016/j.energy.2017.03.140
Domke, G. M., Oswalt, S. N., Walters, B. F., and Morin, R. S. (2020). Tree planting has the potential to increase carbon sequestration capacity of forests in the United States. Proc. Natl. Acad. Sci. U. S. A. 117 (40), 24649–24651. doi:10.1073/pnas.2010840117
Elboshy, B., Alwetaishi, M., Aly, R. H. M., and Zalhaf, A. S. (2022). A suitability mapping for the PV solar farms in Egypt based on GIS-AHP to optimize multi-criteria feasibility. Ain Shams Eng. J. 13 (3), 101618. doi:10.1016/j.asej.2021.10.013
Fetanat, A., and Khorasaninejad, E. (2015). A novel hybrid MCDM approach for offshore wind farm site selection: a case study of Iran. Ocean Coast. Manag. 109, 17–28. doi:10.1016/j.ocecoaman.2015.02.005
Ghasempour, R., Nazari, M. A., Ebrahimi, M., Ahmadi, M. H., and Hadiyanto, H. (2019). Multi-criteria decision making (MCDM) approach for selecting solar plants site and technology: a review. Int. J. Renew. Energy Dev. 8 (1), 15–25. doi:10.14710/ijred.8.1.15-25
Ghiat, I., and Al-Ansari, T. (2021). A review of carbon capture and utilisation as a CO2abatement opportunity within the EWF nexus. J. CO2 Util. 45 (December 2020), 101432. doi:10.1016/j.jcou.2020.101432
Ghiat, I., AlNouss, A., and Al-Ansari, T. (2021). Thermodynamic optimization of a biomass-based integrated gasification combined cycle with post combustion carbon capture using potassium carbonate. Comput. Aided Chem. Eng. 50, 695–701. doi:10.1016/B978-0-323-88506-5.50110-8
Govinda Rao, P., and Al-Kuwari, M. M. A. (2013). “Assessment of solar and wind energy potential in Qatar,” in 21 Joint GCC-Japan Environmental Symposium. Available at: https://www.jccp.or.jp/international/conference/docs/14assessment-of-solar-and-wind-energy-potential-in.pdf.
Gulf Times (2020). Qatar committed to produce energy that is cleaner, sustainable. Gulf Times. Available at: https://www.gulf-times.com/story/654184/qatar-committed-to-produce-energy-that-is-cleaner-sustainable#:∼:text=Qatar%20is%20fully%20committed%20to,national%20vision%2C%20strategies%20and%20policies.
Heintzman, P. (2021). The potential for voluntary carbon offset programs in the Canadian snow-based outdoor recreation industry. J. Outdoor Recreat. Tour. 36 (February 2020), 100422. doi:10.1016/j.jort.2021.100422
Huang, J. P., Poh, K. L., and Ang, B. W. (1995). Decision analysis in energy and environmental modeling. Energy 20 (9), 843–855. doi:10.1016/0360-5442(95)00036-g
Iea, I. E. A. (2017). CO2 emissions from fuel combustion 2017 - highlights. Int. Energy Agency 1, 1–162. Available at: https://euagenda.eu/upload/publications/untitled-110953-ea.pdf.
Intergovernmental Panel on Climate Change (IPCC) (2006) 2006 IPCC guidelines for national greenhouse gas inventories agriculture, forestry and other land use. Vol. 4. Available at: https://www.ipcc-nggip.iges.or.jp/public/2006gl/vol4.html.
Intergovernmental Panel on Climate Change (IPCC) (2022). “Climate change 2022: mitigation of climate change” in, Working Group III Contribution to the Sixth Assessment Report (AR6). Intergovernmental Panel on Climate Change, (IPCC). Available at: https://www.ipcc.ch/report/ar6/wg3/.
IRENA (2020). Renewable power generation costs in 2019. Abu Dhabi. Available at: https://www.irena.org/-/media/Files/IRENA/Agency/Publication/2020/Jun/IRENA_Power_Generation_Costs_2019.pdf.
Issa, S., Dahy, B., Saleous, N., and Ksiksi, T. (2019). Carbon stock assessment of date palm using remote sensing coupled with field-based measurements in Abu Dhabi (United Arab Emirates). Int. J. Remote Sens. 40 (19), 7561–7580. doi:10.1080/01431161.2019.1602795
Jahangiri, M., Ghaderi, R., Haghani, A., and Nematollahi, O. (2016). Finding the best locations for establishment of solar-wind power stations in Middle-East using GIS: a review. Renew. Sustain. Energy Rev. 66, 38–52. doi:10.1016/j.rser.2016.07.069
Janke, J. R. (2010). Multicriteria GIS modeling of wind and solar farms in Colorado. Renew. Energy 35 (10), 2228–2234. doi:10.1016/j.renene.2010.03.014
KAHRAMAA (2020). Annual statistics report 2020. Qatar General Electricity and Water Corporation. Available at: https://www.km.qa/MediaCenter/Publications/Annual%20Statistics%20Report%202020%20English.pdf
Liu, W., Hu, W., Lund, H., and Chen, Z. (2013). Electric vehicles and large-scale integration of wind power - the case of Inner Mongolia in China. Appl. Energy 104, 445–456. doi:10.1016/j.apenergy.2012.11.003
Løken, E. (2007). Use of multicriteria decision analysis methods for energy planning problems. Renew. Sustain. Energy Rev. 11 (7), 1584–1595. doi:10.1016/j.rser.2005.11.005
Lovrak, A., Pukšec, T., and Duić, N. (2020). A Geographical Information System (GIS) based approach for assessing the spatial distribution and seasonal variation of biogas production potential from agricultural residues and municipal biowaste. Appl. Energy 267 (May), 115010. doi:10.1016/j.apenergy.2020.115010
Lund, H. (2005). Large-scale integration of wind power into different energy systems. Energy 30 (13), 2402–2412. doi:10.1016/j.energy.2004.11.001
Lund, H. (2006). Large-scale integration of optimal combinations of PV, wind and wave power into the electricity supply. Renew. Energy 31 (4), 503–515. doi:10.1016/j.renene.2005.04.008
Lund, H. (2014). Renewable energy systems A smart energy systems approach to. Second Edition. Elsevier Inc. doi:10.1016/C2012-0-07273-0
Lund, H., and Clark, W. W. (2002). Management of fluctuations in wind power and CHP comparing two possible Danish strategies. Energy 27 (5), 471–483. doi:10.1016/s0360-5442(01)00098-6
Lund, H., and Münster, E. (2003). Modelling of energy systems with a high percentage of CHP and wind power. Renew. Energy 28 (14), 2179–2193. doi:10.1016/s0960-1481(03)00125-3
Marafia, A. H., and Ashour, H. A. (2002). Feasibility of wind energy utilization in Qatar. Eng. J. Univ. Qatar 15 (June), 241–251.
Merrouni, A. A., Mezrhab, A., and Mezrhab, A. (2016). PV sites suitability analysis in the Eastern region of Morocco. Sustain. Energy Technol. Assessments 18, 6–15. doi:10.1016/j.seta.2016.09.006
Messaoudi, D., Settou, N., Negrou, B., and Settou, B. (2019). GIS based multi-criteria decision making for solar hydrogen production sites selection in Algeria. Int. J. Hydrogen Energy 44 (60), 31808–31831. doi:10.1016/j.ijhydene.2019.10.099
Ministry of Municipality and Environment (2021). Qatar nationally determined contribution. (August). Available at: https://www.mme.gov.qa/pdocs/cview?siteID=2&docID=23348&year=2021.
Oakleaf, J. R., Kennedy, C. M., Baruch-Mordo, S., Gerber, J. S., West, P. C., Johnson, J. A., et al. (2019). Mapping global development potential for renewable energy, fossil fuels, mining and agriculture sectors. Sci. Data 6 (1), 101–117. doi:10.1038/s41597-019-0084-8
Okonkwo, E. C., Abdullatif, Y. M., and Al-ansari, T. (2021a). A nanomaterial integrated technology approach to enhance the energy-water-food nexus. Renew. Sustain. Energy Rev. 145 (May 2020), 111118. doi:10.1016/j.rser.2021.111118
Okonkwo, E. C., Al-Breiki, M., Bicer, Y., and Al-Ansari, T. (2021b). Sustainable hydrogen roadmap: a holistic review and decision-making methodology for production, utilisation and exportation using Qatar as a case study. Int. J. Hydrogen Energy 46, 35525–35549. doi:10.1016/j.ijhydene.2021.08.111
Okonkwo, E. C., Wole-Osho, I., Bamisile, O., Abid, M., and Al-Ansari, T. (2021c). Grid integration of renewable energy in Qatar: potentials and Limitations. Energy 235, 121310. doi:10.1016/j.energy.2021.121310
Okonkwo, E. C., Adun, H., Babatunde, A. A., Abid, M., and Ratlamwala, T. A. H. (2020). Entropy generation minimization in a parabolic trough collector operating with SiO2–water nanofluids using the genetic algorithm and artificial neural network. J. Therm. Sci. Eng. Appl. 12 (3), 031007. doi:10.1115/1.4044755
Okonkwo, E. C., Okwose, F., and Abbasoglu, S. (2017). Techno-economic analysis of the potential utilization of a hybrid PV-wind turbine system for commercial buildings in Jordan. Int. J. Renew. Energy Res. 7 (2), 908–914. Available at: https://www.ijrer.org/ijrer/index.php/ijrer/article/view/5735.
Ong, S., Campbell, C., Denholm, P., Margolis, R., and Garvin, H. (2013). Land-use requirements for solar power plants in the United States. National Renewable Energy Laboratory (NREL). NREL/TP-6A (June). Available at: https://www.nrel.gov/docs/fy13osti/56290.pdf.
Østergaard, P. A. (2015). Reviewing EnergyPLAN simulations and performance indicator applications in EnergyPLAN simulations. Appl. Energy 154, 921–933. doi:10.1016/j.apenergy.2015.05.086
Palmer, D., Gottschalg, R., and Betts, T. (2019). The future scope of large-scale solar in the UK: site suitability and target analysis. Renew. Energy 133, 1136–1146. doi:10.1016/j.renene.2018.08.109
Papadis, E., and Tsatsaronis, G. (2020). Challenges in the decarbonization of the energy sector. Energy 205, 118025. doi:10.1016/j.energy.2020.118025
Pascua, J. G., Alfonso, G. P., and Galicia, R. S. (2021). Carbon sequestration potential of tree species at isabela state university wildlife sanctuary (ISUWS), cabagan, isabela, Philippines. Open J. Ecol. 11 (05), 462–473. doi:10.4236/oje.2021.115030
Paul, D., Maureen, H., Jackson, M., and Ong, S. (2009). Land-use requirements of modern wind power plants in the United States. National Renewable Energy Laboratory, August. Available at: https://www.nrel.gov/docs/fy09osti/45834.pdf.
Qureshi, A., Badola, R. P., and Hussain, S. A. (2012). A review of protocols used for assessment of carbon stock in forested landscapes. Environ. Sci. Policy 16, 81–89. doi:10.1016/j.envsci.2011.11.001
Ramachandra, T. V., and Shruthi, B. V. (2007). Spatial mapping of renewable energy potential. Renew. Sustain. Energy Rev. 11 (7), 1460–1480. doi:10.1016/j.rser.2005.12.002
REN 21 (2020). Renewables 2019 global status report. Renewable energy network. Available at: https://www.ren21.net/wp-content/uploads/2019/05/gsr_2020_full_report_en.pdf.
Rytter, R. M., and Rytter, L. (2020). Carbon sequestration at land use conversion – early changes in total carbon stocks for six tree species grown on former agricultural land. Ecol Manage 466 (April), 118129. doi:10.1016/j.foreco.2020.118129
Saaty, R. W. (1987). The analytic hierarchy process-what it is and how it is used. Math. Model. 9 (3–5), 161–176. doi:10.1016/0270-0255(87)90473-8
Sánchez-Lozano, J. M., García-Cascales, M. S., and Lamata, M. T. (2014). Identification and selection of potential sites for onshore wind farms development in region of murcia, Spain. Energy 73, 311–324. doi:10.1016/j.energy.2014.06.024
Sánchez-Lozano, J. M., García-Cascales, M. S., and Lamata, M. T. (2015). Evaluation of suitable locations for the installation of solar thermoelectric power plants. Comput. Industrial Eng. 87, 343–355. doi:10.1016/j.cie.2015.05.028
Sánchez-Lozano, J. M., García-Cascales, M. S., and Lamata, M. T. (2016). Comparative TOPSIS-ELECTRE TRI methods for optimal sites for photovoltaic solar farms. Case study in Spain. J. Clean. Prod. 127, 387–398. doi:10.1016/j.jclepro.2016.04.005
Sánchez-Lozano, J. M., Henggeler Antunes, C., García-Cascales, M. S., and Dias, L. C. (2014). GIS-based photovoltaic solar farms site selection using ELECTRE-TRI: evaluating the case for Torre Pacheco, Murcia, Southeast of Spain. Renew. Energy 66, 478–494. doi:10.1016/j.renene.2013.12.038
Sánchez-Lozano, J. M., Teruel-Solano, J., Soto-Elvira, P. L., and Socorro García-Cascales, M. (2013). Geographical Information Systems (GIS) and Multi-Criteria Decision Making (MCDM) methods for the evaluation of solar farms locations: case study in south-eastern Spain. Renew. Sustain. Energy Rev. 24, 544–556. doi:10.1016/j.rser.2013.03.019
Schmidt, C. W. (2009). Carbon offsets: growing pains in a growing market. Environ. Health Perspect. 117 (2), A62–A68. doi:10.1289/ehp.117-a62
Sharif, A. O., Sanduk, M., and Taleb, H. M. (2010). The date palm and its role in reducing soil salinity and global warming. Acta Hortic. 882, 59–64. doi:10.17660/actahortic.2010.882.5
Sharma, R., Pradhan, L., Kumari, M., and Bhattacharya, P. (2021). Assessment of carbon sequestration potential of tree species in amity university campus noida. Environ. Sci. Proc. 3, 52. doi:10.3390/IECF2020-08075
Solangi, Y. A., Shah, S. A. A., Zameer, H., Ikram, M., and Saracoglu, B. O. (2019). Assessing the solar PV power project site selection in Pakistan: based on AHP-fuzzy VIKOR approach. Environ. Sci. Pollut. Res. 26 (29), 30286–30302. doi:10.1007/s11356-019-06172-0
Suh, J., and Brownson, J. R. S. (2016). Solar farm suitability using geographic information system fuzzy sets and analytic hierarchy processes: case study of Ulleung Island, Korea. Energies 9 (8), 648. doi:10.3390/en9080648
Suprova, N. T., Zidan, R., and Rashid, A. R. M. H. (2021). “Optimal site selection for solar farms using GIS and AHP: a literature review” in, Proceedings of the International Conference on Industrial and Mechanical Engineering and Operations Management, 1–13.
Sustainable Energy Planning Research Group (2018). EnergyPLAN cost database. Available at: https://www.energyplan.eu/costdatabase/.
Tahri, M., Hakdaoui, M., and Maanan, M. (2015). The evaluation of solar farm locations applying Geographic Information System and Multi-Criteria Decision-Making methods: case study in southern Morocco. Renew. Sustain. Energy Rev. 51, 1354–1362. doi:10.1016/j.rser.2015.07.054
Thomas, S. C., Malczewski, G., and Saprunoff, M. (2007). Assessing the potential of native tree species for carbon sequestration forestry in Northeast China. J. Environ. Manag. 85 (3), 663–671. doi:10.1016/j.jenvman.2006.04.027
UNFCCC (2006). Report of the conference of the parties serving as the meeting of the parties to the Kyoto protocol. UN, 1–100. March. Available at: https://unfccc.int/resource/docs/2005/cmp1/eng/08a03.pdf.
United Nations (1998). Kyoto protocol of the united nations framework convention on climate change. Available at: https://unfccc.int/resource/docs/convkp/kpeng.pdf.
Uyan, M. (2013). GIS-based solar farms site selection using analytic hierarchy process (AHP) in Karapinar region Konya/Turkey. Renew. Sustain. Energy Rev. 28, 11–17. doi:10.1016/j.rser.2013.07.042
Wang, S., Zhang, L., Fu, D., Lu, X., Wu, T., and Tong, Q. (2016). Selecting photovoltaic generation sites in Tibet using remote sensing and geographic analysis. Sol. Energy 133, 85–93. doi:10.1016/j.solener.2016.03.069
Watson, J. J. W., and Hudson, M. D. (2015). Regional Scale wind farm and solar farm suitability assessment using GIS-assisted multi-criteria evaluation. Landsc. Urban Plan. 138, 20–31. doi:10.1016/j.landurbplan.2015.02.001
Wotherspoon, A., Thevathasan, N. V., Gordon, A. M., and Voroney, R. P. (2014). Carbon sequestration potential of five tree species in a 25-year-old temperate tree-based intercropping system in southern Ontario, Canada. Agrofor. Syst. 88 (4), 631–643. doi:10.1007/s10457-014-9719-0
Keywords: solar PV, wind, carbon offset, GIS, date palm tree, EnergyPLAN
Citation: Bilal H, Okonkwo EC and Al-Ansari T (2024) A pathway to 25% reduction in greenhouse gas emission by 2030 using GIS-Based multi-criteria decision making for renewables, date palm (phoenix dactylifera), and carbon credits: a case for Qatar. Front. Energy Res. 12:1272993. doi: 10.3389/fenrg.2024.1272993
Received: 05 August 2023; Accepted: 15 January 2024;
Published: 01 February 2024.
Edited by:
Monjur Mourshed, Cardiff University, United KingdomReviewed by:
Amine Boudghene Stambouli, Oran University of Science and Technology - Mohamed Boudiaf, AlgeriaImen Ben Salem, Zayed University, United Arab Emirates
Javier Martínez Gómez, University of Alcalá, Spain
Copyright © 2024 Bilal, Okonkwo and Al-Ansari. This is an open-access article distributed under the terms of the Creative Commons Attribution License (CC BY). The use, distribution or reproduction in other forums is permitted, provided the original author(s) and the copyright owner(s) are credited and that the original publication in this journal is cited, in accordance with accepted academic practice. No use, distribution or reproduction is permitted which does not comply with these terms.
*Correspondence: Tareq Al-Ansari, dGFsYW5zYXJpQGhia3UuZWR1LnFh