 Hongbo Zou1,2
 Jialun Sun
- 1College of Electrical and New Energy Engineering, China Three Gorges University, Yichang, China
- 2Hubei Provincial Key Laboratory for Operation and Control of Cascaded Hydropower Station, China Three Gorges University, Yichang, China
- 3Power Dispatching and Control Center of Guangxi Power Grid Company, Nanning, China
To solve the problem of bolt defects in unmanned aerial vehicle inspection that are difficult to identify quickly and accurately, this paper proposes a defect detection method based on the improved YOLOv5 anchor mechanism. Firstly, the Normalized Wasserstein distance (NWD) evaluation metric and the Intersection over Union evaluation metric are combined, and the experiment determines the appropriate weight for this combination. This way, the sensitivity of using IoU alone to small objecet detection anchor box threshold changes was reduced. Furthermore, Convolutional Block Attention Module is included into the head network architecture of yolov5 in order to prioritize significant information and suppress irrelevant features. Omni-dimensional Dynamic Convolution (ODConv) is used to replace convolution in MobileNetv2. The combination module is used as the new backbone of the YOLOv5 model. It simultaneously enhances the model’s capability to extract bolt defect object information, minimizes calculation requirements, and achieves lightweight detection across the entire model. Compared with the original algorithm, the model detection Accuracy Precision (AP) is increased by 30.1%, the mean Accuracy Precision is increased by 30.4%. Other evaluation metrics of the model, such as GFlOPs and Parameters, all decreased slightly. The above results show that the improved algorithm proposed in this paper greatly improves the detection accuracy of the model on the premise of ensuring that the model is as small as possible.
1 Introduction
With the rapid development of China, electricity demand is also increasing. In the face of massive demand for power supply, the coverage of transmission lines must also be expanded (Qi, 2019; SHANG et al., 2019; Cao et al., 2021). As the main support of transmission lines, overhead transmission lines are the physical pillars of the power system (Liu Jun et al., 2020; Jain et al., 2020; LUO et al., 2021). Therefore, regular inspection of transmission line defects is an important task to ensure the stable operation of the power system. Bolts are a critical component in transmission lines as they facilitate the connection and securement of individual power components. However, due to the perennial exposure of transmission lines to the external environment, wind traction, severe weather, and other factors may cause bolt defects. Common defects are loose bolts and missing bolts. In extreme circumstances, even a minute flaw can result in the failure of transmission lines and, in more severe cases, widespread power disruptions, posing a grave threat to the stability and security of the power grid. It is evident that investigating a object detection algorithm that accurately and rapidly identifies fastener defects is of critical practical importance (MA et al., 2019; Wang B. et al., 2021; Li et al., 2021; Tian et al., 2021; Li Junlong et al., 2022; Zhang Weixin et al., 2022).
The traditional inspection method mainly relies on manual inspection. However, manual inspections have apparent drawbacks. The manual inspection operation is intensive, lengthy, and costly. In particular, some transmission lines are located in harsh environments such as mountains, snow, and rivers. In addition, the bolt has a small object and a large number, which is not convenient for manual inspection. With the development of science and technology, UAV inspection has gradually become the primary method for detecting defects in power transmission lines (Ya-wei et al., 2006; JI, 2010; LIU et al., 2019; WANG et al., 2019). At present, most of the research on overhead transmission line inspection focuses on large and medium-sized defects such as insulators, anti-bird thorns, anti-shock hammers, and bird’s nests. In reference (Wang et al., 2023), an innovation was made on the loss function, proposing a new SymLoss. By using SymLoss to optimize OPENet, a dual-head network can be used to predict anti-bird thorns and position boxes simultaneously. In reference (Zhai et al., 2022), they used 3D modeling to generate artificial samples, which supplemented the problem of insufficient training caused by a small number of data samples due to the lack of actual samples. And proposed the introduction of the GCL module into Faster R-CNN to extract geometric features of shockproof hammer defects, improving model accuracy. In reference (Zhang and He, 2022), they improved bird’s nest detection by adding a Swin transformer module to the YOLOv4 backbone network and using the Caitong SimOTA sample allocation strategy. The improvements results were significant. In contrast, defect detection of bolts is more difficult. The size of the bolt defect itself is particularly small, and even a single bolt accounts for no more than 1% of the inspection image. Moreover, the inspection image also has a complex background environment, which makes it easy to block the bolt, so it is easy to miss the key features of the bolt defect in the extracted features, resulting in low defect detection accuracy. A new measurement index, NWD (Wang J. et al., 2021), is proposed to address the problem of detecting small objects by reducing the sensitivity and positive and negative sample allocation errors of traditional IoU evaluation metrics. However, in the actual detection task, it is not all small objects. Hence, this paper takes this situation into account and establishes a converged measurement index, giving full play to the advantages of two evaluation metrics. In reference (Huang et al., 2022), they proposed a detection method based on USRNet and improved YOLOv5X. Firstly, USRNet is used to super-resolve reconstruction of the transmission line inspection image to reduce the interference of the complex background of the transmission line. Secondly, the multi-module improved YOLOv5X algorithm is used for detection, which realizes the accuracy of small object detection. However, it is necessary to carry out super-resolution reconstruction and then detection. Although the accuracy is improved, there are obvious disadvantages in speed, which does not meet the purpose of real-time detection. In reference (Zhai et al., 2023) they considered the problem of insufficient samples of insulator defects in transmission lines. In reference (Luo et al., 2023), Luo Peng et al. detected defects in ultra-small bolts. Deep extraction of valuable features of ultra -small bolts occurs through the ultra-small object perception module and local bolt detection module. And through two-stage detection, end-to-end bolt defect detection has been achieved, but only a single-level object detection label needs to be provided. This detection method greatly reduces the workload of data annotation, but due to the use of a two-stage end-to-end detection approach, the detection speed cannot meet the real-time detection requirements of unmanned aerial vehicle inspections. In reference (Zhang et al., 2023), Zhang Ke et al. proposed a bolt defect detection method that cannot be visually distinguished in transmission lines, considering the different definitions of defects for bolts at different positions. Improving the basic model with an expansion encoding module, inferring bolt position knowledge through relative position encoding of transmission line images, and ultimately obtaining model output through attribute and defect classifiers can effectively determine the attributes and defect types of bolts. Based on parallel vision theory, the prior knowledge of insulators and rule standards is fused to create artificial defect samples. Although the problem of insufficient samples is solved, after the addition of excessive artificial samples, the model is easy to extract the features of artificial samples, resulting in the difficulty of extracting the features of actual samples, and the accuracy of model detection becomes lower.
Considering the above problems, this paper studies a lightweight transmission line defect detection method based on the improved YOLOv5 anchor mechanism. By fusing NWD and IoU as a new evaluation metric, it aims to solve the problem of positive and negative sample allocation. MoblileNetv2 inserted into ODConv is introduced in the backbone network, which fully excavates the feature information extracted from small object defects while lightweight modeling so that real-time detection in bolt defects of transmission lines can be realized.
2 Image characteristics and detection methods of transmission line bolts
2.1 Image characteristics of transmission line inspection bolts
The detection object of this method is the bolt, which includes two primary defects: a missing bolt and a loose bolt. An image of the inspection bolts of a typical transmission line is shown in Figure 1. From this figure, it can be seen that in the transmission line inspection bolt image, there are the following difficulties in the inspection task:
1) The inspection object is tiny. When the drone is shooting, due to the distance from the object, some transmission line images have a large field of view, which is prone to a lack of appearance information such as texture, shape, and color. It often leads to failures, and small objects are difficult to detect.
2) The background of the detected object is complex. In the complex background of a transmission line, objects that are blurred due to image quality are difficult to detect because their contour features are not prominent and difficult to distinguish well from the environmental background. Objects also lack clearer contour features to distinguish them from occlusions, which makes object detection difficult. In view of the above characteristics of transmission line detection images, there is a need to improve the image quality of transmission line fault object detection and to enhance the ability of the object detection algorithm to detect small objects.
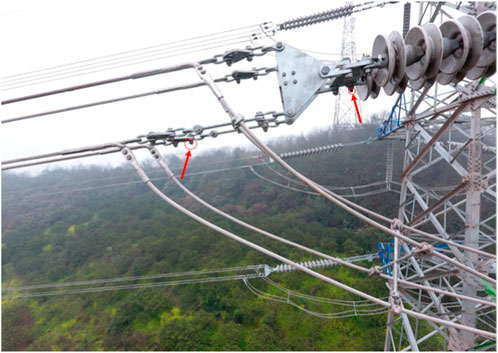
FIGURE 1. Transmission line bolt defects.
2.2 Transmission line inspection bolt image detection method
Aiming at the characteristics of the above-mentioned transmission line inspection bolt images, this paper proposes a new object detection idea of fusion evaluation metrics and omni-dimensional dynamic convolution insertion into lightweight backbone networks. In this paper, the conventional measurement method is improved to reduce the sensitivity of small object detection tasks based on anchors and improve the ability of positive and negative sample allocation. At the same time, dynamic convolution is used to extract the fine-grained pixel characteristics of small objects and insert them into MobileNetv2 to replace convolution as the backbone network. This enhances the detection speed of the entire model.
First, improve the anchor mechanism of YOLOv5. The optimal weight of NWD and IoU fusion was determined experimentally and used as a new evaluation metric. While improving the overall accuracy of the model, it also improves the training convergence speed of the model. Second, replace the backbone part of the YOLOv5 network with mobileNetv2 plugged into ODconv as the new backbone network. While enhancing the performance of the model in identifying bolt defects in transmission lines, it also improves the detection speed of the whole model. It optimizes the performance of the entire model.
3 YOLOv5’s anchor mechanism improved
The YOLOv5 model is an anchor-based model. The anchor mechanism is a technique for small objects. Because it can produce a large number of dense anchor boxes, the network can perform object classification and prediction box coordinate regression. And the dense anchor frame has a certain improvement in the recall ability of the network, which is a great advantage for small object detection. Therefore, this paper proposes a new improvement scheme for this mechanism. That is, the NWD index and the IoU index are fused as a new evaluation metric to solve the problem that positive and negative samples of object allocation in the YOLOv5 algorithm are prone to errors in small object detection to improve the performance of the model.
3.1 YOLOv5’s general evaluation metric intersection over union
3.1.1 Introduction to intersection over union
Intersection over Union is shortened to IoU. IoU is a standard that measures the accuracy of detecting objects in a specific data set. IoU is a simple measurement standard. Any task that produces bounding boxes in the output can be measured with IoU. In object recognition, a certain ratio of our commonly the prediction box to the actual box is IoU. The formula for calculating IoU is shown below:
As shown in Figure 2, IoU means the intersection of rectangle A and rectangle B divided by the union of rectangle A and rectangle B.
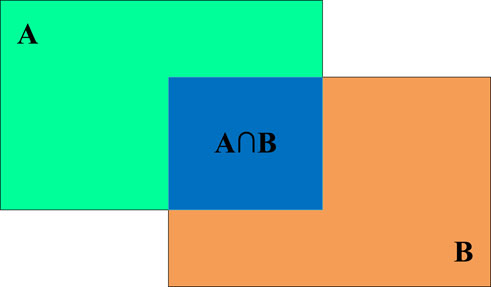
FIGURE 2. Diagram of the intersection over union.
3.1.2 Intersection over union application scenarios
In addition to being used as an evaluation index for object detection, IoU have the following three functions under the YOLOv5 algorithm:
1) In the object detection of the anchor-based method, positive samples and negative samples are distinguished according to the value of the IoU.
2) It can be optimized directly as a loss function for bounding box regression.
3) Filter the prediction box in the NMS (non-maximum suppression).
3.2 Normalized Wasserstein distance
For small object objects, since most real objects cannot be standard rectangles, bounding boxes tend to have some background information. The information and background information of the object object are concentrated on the center point and boundary of the bounding box, respectively. Then, when building a two-dimensional Gaussian distribution for a bounding box, you can set the center pixel of the bounding box to the highest weight, then gradually decrease from the center point to the boundary. For a bounding box
This way, the similarity between bounding boxes is converted into a distribution distance between Gaussian distributions. where
Using the Wasserstein distance to calculate the distribution distance, the second-order Wasserstein distance between different bounding boxes
Using the Gaussian distribution
Since the result obtained above is a distance, and IoU is a ratio, the scale value is maximum 1 and minimum is 0, so this distance needs to be normalized, so the Normalized Wasserstein Distance (NWD) is finally obtained:
3.3 Construction of fusion evaluation metrics
As shown in Figure 3, little positional deviations can result in major changes to the IoU. Due to the importance of IoU in label allocation, the difference in the value size may directly lead to the allocation of negative samples that should theoretically be assigned to positive samples. When part of the object scale is too small, the degree of overlap between the anchor box and the real box will never reach the threshold. IoU itself has its flaws, which has led to the creation of many variants of evaluation metrics based on it. IoU only works when the bounding boxes overlap, so GIoU was proposed to solve this problem by adding penalties. But when the two bounding boxes contain each other, GIoU is downgraded to IoU. Subsequently, DIoU and CIoU were proposed to overcome these problems. However, GIoU, DIoU, and CIoU are all extensions of IoU, which are more commonly used in loss functions, and there is still a problem that the position offset of small objects is sensitive in label allocation. At this point, using NWD as a new evaluation metric is considered. The main step is to model the bounding box as a two-dimensional Gaussian distribution and then use NWD to measure the similarity of the derived Gaussian distribution. NWD can measure the similarity of distributions without overlap, and NWD is not sensitive to the scale of the object, making it ideal for measuring the similarity of small objects.
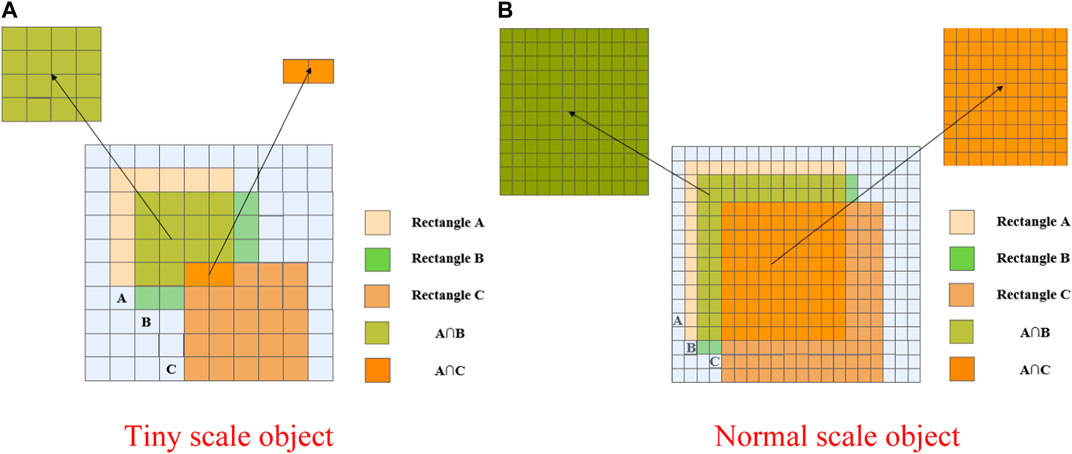
FIGURE 3. IoU change sensitivity for objects at different scales (A) Tiny scale object (B) Normal scale object.
However, there are also problems with using NWD alone as a model evaluation metric. The use of the NWD algorithm involves the optimal transportation algorithm, which increases the running complexity of the model, makes the training speed of the model slower, and also affects the training effect. Secondly, NWD performs well in object detection tasks for very small pixel objects. The dataset in this paper has both small object defects and very small object defects, so the effect of NWD alone is not good.
To this end, this paper fuses two evaluation metrics at the same time and determines the optimal combined weights of the two through experiments. We use it as a new evaluation metric to improve model’s accuracy in identifying bolt defects while also speeding up the convergence of the model.
As shown in Figure 3A shows the variation of IoU in tiny scale object; Figure 3B shows the variation of IoU in normal scale object. In Figure 3A, the value of IoU for A and B is calculated to be 0.47, and the IoU for A and C is calculated to be 0.04. In Figure 3B, the value of IoU for A and B is calculated to be 0.74, and the IoU for A and C is calculated to be 0.42. This shows that there are significant disadvantages of using IoU for tiny scale objects in object detection.
4 Improvement module introduction and improvement strategy
4.1 Introduction to omni-dimensional dynamic convolution
Omni-Dimensional Dynamic Convolution abbreviated as ODconv. Whereas conventional convolution has only one static convolution kernel and is independent of input samples, the traditional dynamic convolution kernel uses an attention mechanism to dynamically weight multiple convolution kernels and combine them. The calculation of ordinary dynamic convolution is shown in Eq. 6. ODconv focuses on all dimensions of kernel space, and its calculation is shown in Eq. 7.
Where
The same calculation method as the SE attention mechanism is used. First, the input x is compressed into a feature vector of the same length as the input channel by global average pooling (GAP). Then use fully connected layers (FC) to map eigenvectors to low-dimensional space. Then go through the ReLU activation function, and generate 4 attention scalars

FIGURE 4. Principle of omni-dimensional dynamic convolution.
4.2 Introduction and improvement of MobileNetv2
MobileNetv2 (Sandler et al., 2018) was proposed by the Google team in 2018. Compared with MobileNetv1, the accuracy rate is higher and the model is smaller. The structure of the MobileNetv2 network is shown in Table 1. Among them, Conv2d is a 2-dimensional convolution operation, Bottleneck is a bottleneck block composed of an Inverted residual block, Avgpool is an average pooling operation, t is the channel extension factor, c is the number of channels for the output feature matrix, and n represents the number of repeated Bottleneck and s means stride. s only represents the convolutional stride of the first Bottleneck in each convolutional stride. k represents the channel of the output vector.
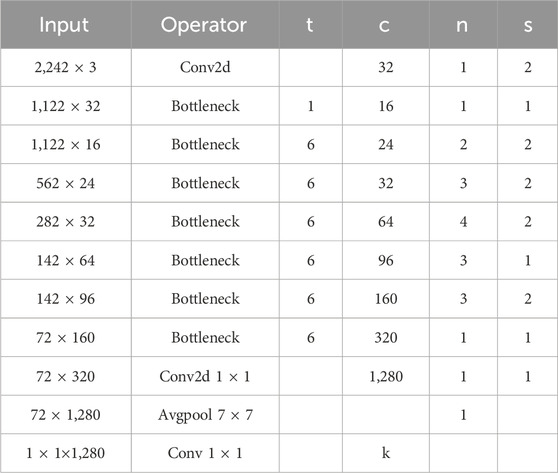
TABLE 1. MobileNetv2 network structure.
The weight of many depthwise convolutions found in MobileNetv1 was found to be 0 and did not play a role. To avoid this problem, the MobileNetv2 version borrowed from the residual structure of ResNet, thereby introducing the Inverted residual. The Flowchart of the Inverted residual is shown in the figure below.
As shown in Figure 5, Input represents the image input, Conv represents convolution operation, ReLU6 is an activation function, and its expression is y = ReLU6(x) = min(max(x,0),6). Dwise represents Depthwise convolution. Liner represents a linear activation function and its expression is y = f(x) = x.
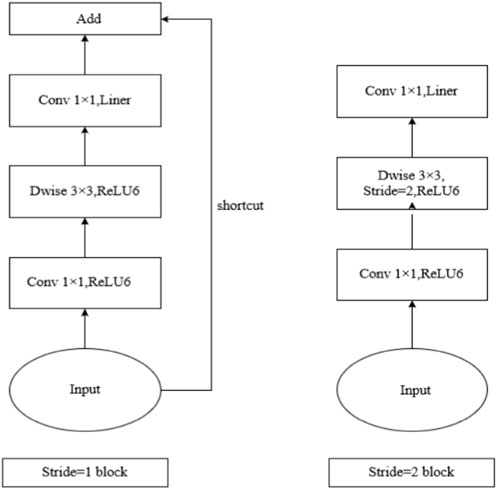
FIGURE 5. Flowchart of the Inverted residual structure.
In the case of Stride = 1, input the image input for convolution operation, the convolution core size is 1 × 1. Then use RELU6 as the activation function for processing. Then use Dwise, and its convolution core size is 3 × 3. It still uesd the ReLU6 function as the activation function. Immediately then, use the convolution of the convolution core to 1 × 1, and adjust the activation function to a linear activation function. When stride = 1 and the input feature matrix is the same as the output feature matrix shape, the shortcut connection operation is performed.
When Stride = 2, it is basically similar to Stride = 1, but there is no shortcut.
This paper uses ODConv to replace the Conv in the above structure. The improved flowchart is shown in Figure 6. The new ODConv is used and nothing else has changed.
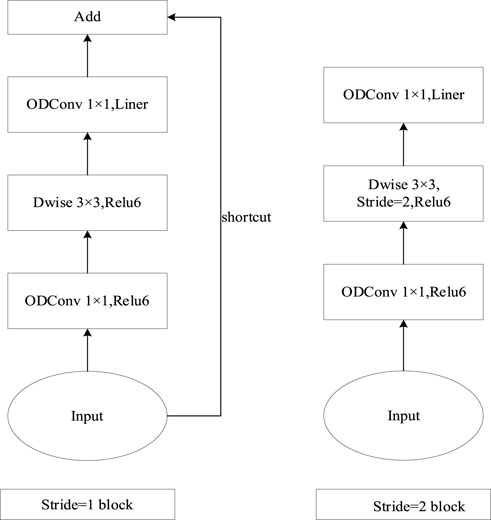
FIGURE 6. Flowchart of the improved Inverted residual structure.
4.3 Introduction and improvement of Convolutional Block Attention Module (CBAM)
The mechanism flow diagram of CBAM is shown in Figure 7. Firstly, perform global maximum pooling and global average pooling on the input feature map, and compress the feature map based on two dimensions to obtain two feature descriptions with different dimensions. The pooled feature maps share a multi-layer perceptron network, first reducing dimensionality through 11 convolutions and then increasing dimensionality through 11 convolutions. Overlay two feature maps with normalize the weights of each channel in the feature map through the sigmoid activation function. Multiply the normalized weights with the input feature map.
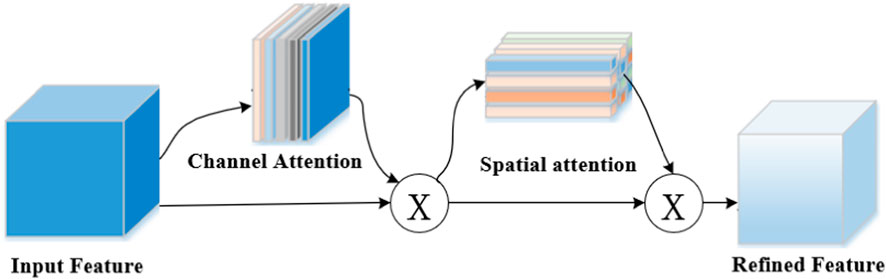
FIGURE 7. The overview of Convolutional Block Attention Module (CBAM).
We embed the CBAM attention mechanism in the head structure of YOLOv5 for deep feature extraction, that is, focusing on important features and suppressing unnecessary features. The CBAM embedding structure is shown in Figure 8.
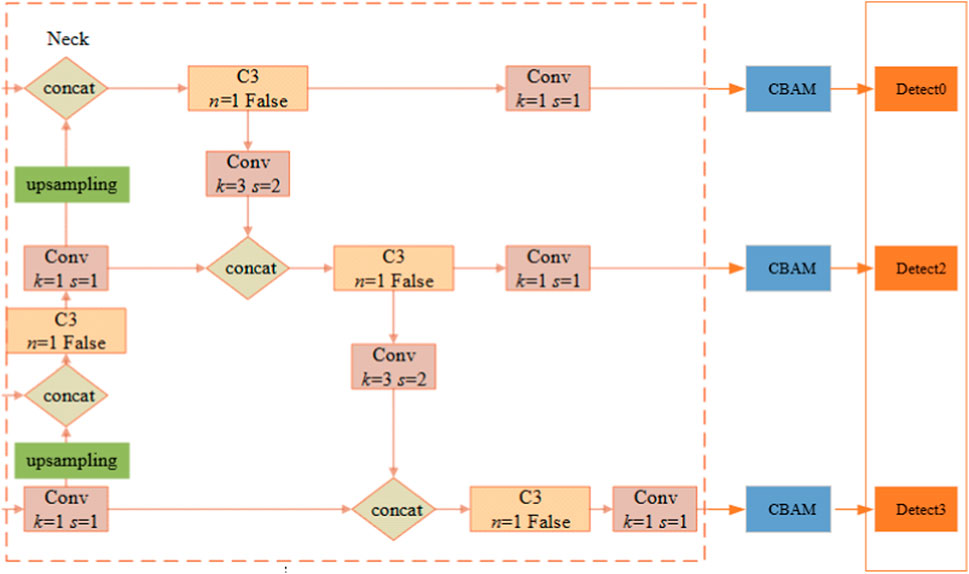
FIGURE 8. CBAM is embedded in the YOLOV5 structure diagram.
5 Experimental results and analysis
5.1 Evaluation metrics
The main purpose of the method proposed in this paper is to ensure the accuracy of the model and reduce its weight. That is, improve the detection accuracy, reduce the number of model parameters and calculations, and shorten the inference time. Parameters are used to evaluate the size of the number of parameters in the model. Giga Floating Point Operations (GFLOPs) is used to indicate the computational complexity of the network. Average Precision (AP) needs to be calculated from the accuracy and recall of the model training samples. Mean Average Accuracy (mAP) is the average of the various types of object APs detected, and the detection time is the time consumed by each image detection. The formula for calculating the above evaluation metrics are as follows:
Where TP is the number of positive samples that have been correctly identified, FP is the number of negative samples that were incorrectly identified as positive, FN is the positive sample size of false negatives, P represents the Precision value at Recall = R,
5.2 The optimal weight combination of Normalized Wasserstein distance and introduction to intersection over union determines the experiment
This experiment was conducted under the Python framework, with Python version 1.5.1. Using the Windows 10 operating system. Among them, CUDA version 11.4, CUDNN version 7.6, and Python version 3.8 are used in the software environment. The hardware environment is the Windows 10 operating system, and the CPU model of the testing device is 11th Gen Intel (R) Core (TM) i5-11400 @ 2.60GHz, and the GPU model is NVIDIA GeForce RTX 3060. The data in this article is actual data obtained from a transmission line in a certain province of the State Grid of China. The number of data samples is 845.
The NWD evaluation metric has a good effect on the detection of tiny objects. But in general inspection tasks, not all objects are tiny objects. Therefore, this article takes this into account, and in the model established in this article, NWD and IoU are used at the same time, and the two are fused to build a new evaluation metric.
In this paper, the NWD weight is selected to change from 0 to 1 with a step size of 0.1. The specific effects of the fusion evaluation metrics are shown in Table 2.
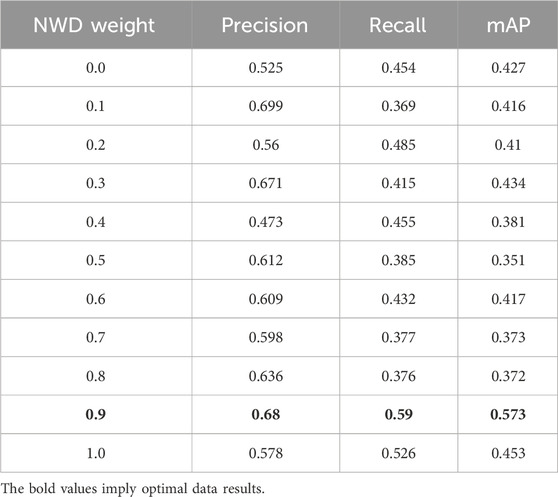
TABLE 2. Various evaluation metrics under the gradual increase in the proportion of NWD.
As can be seen from Table 2, in the overall trend, with the increase in the weight of the NWD, Precision is gradually increasing, while the change of Recall and mAP is first decreasing and then increasing, and finally the overall performance is better than the low-weight IoU.
The interpolation smoothing plot reflects the good characteristics of NWD in small object detection tasks as a whole. However, in Table 1, we find that the best fusion evaluation metric weight is 0.9NWD+0.1IoU. Its Precision is 0.68, Recall is 0.59, and mAP is 0.573. All evaluation metrics are optimal. 0.9NWD+0.1IoU is the optimal recombination in the detection task in this paper, and this paper calls the optimal index N-I metrics.
Therefore, this paper uses this fusion evaluation metric in the model training process. Figure 9A–C respectively reflect the changes of Loss, Precision, Recall and mAP in the training process using the N-I metrics algorithm.
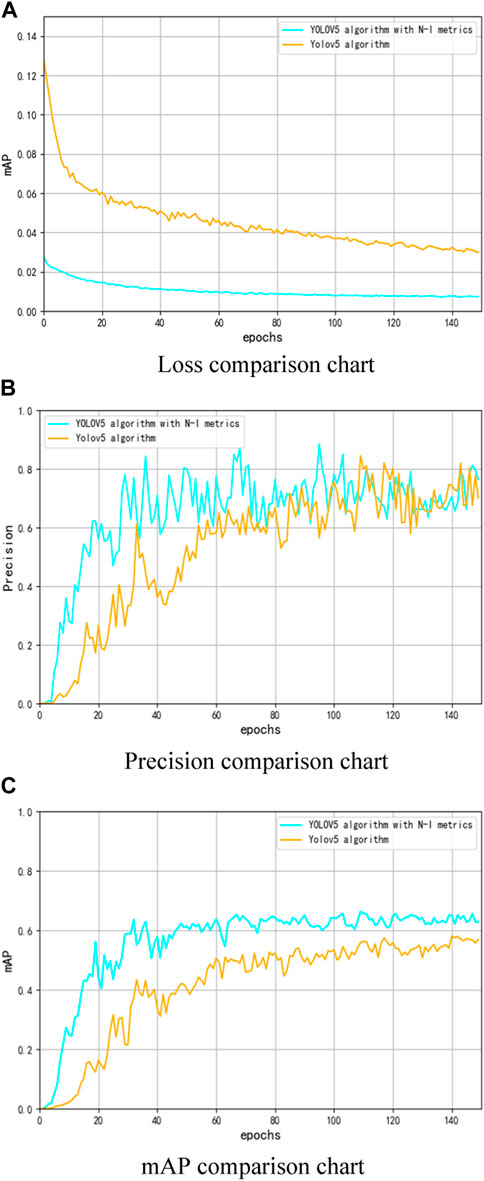
FIGURE 9. Comparison of evaluation metrics during model convergence (A) Loss comparison chart (B)Precision comparison chart (C)mAP comparison chart.

FIGURE 10. Loose and loss detection results of bolts (A) Bolt loss defect detection (B) Bolt loose defect detection.
As can be seen from Figure 9A, the model using the N-I metrics has basically converged at 60 epochs, and the loss value is stable at about 0.012. The model without improvement converges at 130epochs, and the loss value stabilizes at about 0.03 under convergence. It can be seen that the use of N-I metrics can accelerate the convergence speed of the model and reduce the loss of the model.
As can be seen from Figure 9A–C, the model using the N-I evaluation metrics have good results on all evaluation metrics compared with the model algorithm without improvement.
The above experimental results show that the N-I metrics used in this paper can further mine the object semantic information and positioning information, enhance the learning ability of the network, and improve the detection performance of the network for bolt defects in transmission lines.
5.3 Ablation experiment to improve the YOLOv5 algorithm
As shown in Table 3, the ablation experimental results of the improved YOLOv5 algorithm are shown in this paper. From the table, we can find that in the process of gradual improvement, the accuracy of the model is getting higher and higher, and the number of parameters is getting smaller and smaller. Compared with the original YOLOv5 algorithm, AP of the model is improved from 52.25% to 64% after using the N-I metrics, an increase of 22.5%. The model’s mAP increased by 4.5% from 42.7% to 44.6%. It can be seen that the fusion index proposed in this paper has a large improvement in AP of bolt defect detection in transmission lines and a small improvement in mAP. It still needs improvements in other modules. After adding CBAM, AP of the improved algorithm has not changed much, and the mAP is increased by 3.4%. It is helpful to improve the performance of the entire model. After adding the CBAM module, the number of parameters increases due to the complex direction of parameter propagation. Therefore, Parameters, and GFOLPs increased slightly.
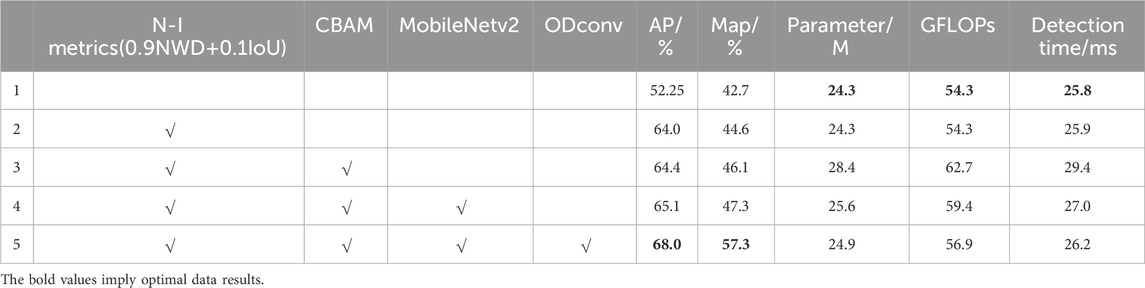
TABLE 3. Ablation experiment to improve the YOLOv5 algorithm.
On the basis of the above, this paper uses the MobileNetv2 network as the new backbone of the YOLOv5 model, aiming to lighten the model. Neither AP nor mAP has improved much. However, compared with the YOLOv5 algorithm with the addition of CBAM, the number of Parameters of the model is reduced by 9.8%, the GFLOPs of the model are reduced by 5.2% and Detect time increased by 8.1%. After replacing ordinary convolution with ODconv, the model performance has been further improved.
In summary, the final model detection AP increases by 30.1%, mAP increases by 30.4%, the number of model Parameters, GFLOPs and Detect time have fallen in small increments compared with the original model. There are obvious improvement effects under each index, which verifies the effectiveness of the proposed model.
In summary, the algorithm proposed in this paper has good performance in various evaluation metrics. It can be used as a method to detect bolt defects in transmission lines.
6 Conclusion
Considering that the object of bolt defects of transmission lines is small, it is greatly affected by complex environmental influences, and it is difficult to detect. This paper proposes an improved YOLOV5 algorithm to solve this problem. The work done in this paper mainly has the following three aspects:
1) Improve the anchor mechanism of YOLOv5. YOLOv5 is the standard anchor-based model. Based on this, this article uses NWD as a new evaluation metric, but there are also problems with a single NWD evaluation metric. Therefore, this paper fuses both evaluation metrics, and determines the optimal weight of the fusion evaluation metrics through experiments. The use of N-I metrics have significantly improved both AP and mAP compared to basic algorithms. Among them, AP increased by 22.5% and mAP increased by 4.5%.
2) Use ODconv instead of ordinary convolution and insert it into MobileNetv2 as a new backbone. ODconv itself has a good effect in small object detection, instead of ordinary convolution, it can fully mine the semantic information of bolt defects. At the same time, in order to lightweight the model, Mobilenetv2 was used as the backbone. The organic combination of the two also improves the performance of the model. Using MobileNetv2 without inserting ODconv, the improvement effect compared to the basic algorithm is not significant. After inserting ODconv, the model accuracy and detection speed both improved. Compared with the model using N-I evaluation metric, it improved by 4.45% on AP, 28.48% on mAP. Compared with the YOLOv5 algorithm with the addition of CBAM, the number of Parameters of the model is reduced by 12.3%, the GFLOPs of the model are reduced by 9.3% and Detect time increased by 10.9%.
3) The CBAM module is embedded in the head structure of yolov5. In order to focus on the important features of the bolt defect, suppress unnecessary features. In this paper, CBAM is used to focus on both channel and space. Therefore, the characteristic information of defects can be fully exploited and the model performance can be improved. Using the CBAM attention mechanism, compared to using the N-I evaluation metric, there was almost no improvement on AP, but an increase of 3.36% on mAP. After the use of CBAM, both Parameters, GFLOPs and Detect time increased slightly.
Although this article has shown significant improvement in bolt defect detection, there are still the following issues that need to be addressed:
1) The fusion weight of NWD and IO. In this article, the weight coefficient is used starting from 0, with a step size of 0.1, and continuing until 1. Can this problem be analyzed and solved as an optimization problem, but with optimal weights at the mathematical level.
2) Using MobileNetv2 on the PC end can lightweight the network. However, when chip algorithms are installed on drone onboard devices, the network actually performs poorly. How to solve the problem of ensuring that there are no network differences after transplanting PC end algorithms to drone onboard devices is also a need to consider.[ (Qian et al., 2023; Matta et al., 2012; Woo et al., 2018; Li et al., 2019; Liu X. et al., 2020; Ge and Chen, 2020; Li C. et al., 2022; Zhang Y. et al., 2022; Ouyang and Yu, 2022; Huang et al., 2023)]
Data availability statement
The original contributions presented in the study are included in the article/Supplementary material, further inquiries can be directed to the corresponding author.
Author contributions
JS: Conceptualization, Formal Analysis, Investigation, Software, Visualization, Writing–original draft, Writing–review and editing. HZ: Conceptualization, Data curation, Formal Analysis, Investigation, Methodology, Project administration, Software, Writing–original draft, Writing–review and editing. ZY: Conceptualization, Investigation, Methodology, Writing–original draft. JY: Software, Writing–review and editing. CY: Conceptualization, Writing–original draft. FL: Writing–review and editing. LX: Writing–review and editing.
Funding
The author(s) declare financial support was received for the research, authorship, and/or publication of this article. This research was funded by Major Science and Technology Special Project of Yunnan Provincial Science and Technology Department (202202AD080004).
Acknowledgments
The authors acknowledge the fund of Major Science and Technology Special Project of Yunnan Provincial Science and Technology Department (202202AD080004).
Conflict of interest
Author LX was employed by Power Dispatching and Control Center of Guangxi Power Grid Company.
The remaining authors declare that the research was conducted in the absence of any commercial or financial relationships that could be construed as a potential conflict of interest.
Publisher’s note
All claims expressed in this article are solely those of the authors and do not necessarily represent those of their affiliated organizations, or those of the publisher, the editors and the reviewers. Any product that may be evaluated in this article, or claim that may be made by its manufacturer, is not guaranteed or endorsed by the publisher.
References
Cao, D., Hu, W., Xu, X., Wu, Q., Huang, Q., Chen, Z., et al. (2021). Deep reinforcement learning based approach for optimal power flow of distribution networks embedded with renewable energy and storage devices. J. Mod. Power Syst. Clean Energy 9 (5), 1101–1110. doi:10.35833/mpce.2020.000557
Ge, Y., and Chen, S. C. (2020). Graph convolutional network for recommender systems. Ruan Jian Xue Bao/Journal Softw. 31 (4), 1101–1112. doi:10.13328/j.cnki.jos.005928
Huang, Y., Liu, H., Chen, Q., Chen, Z., Zhang, J., and Yang, C. (2022). Transmission line insulator fault detection method based on USRNet and improved YOLOv5x. Gaodianya Jishu/High Volt. Eng. 48 (9), 3437–3446. doi:10.13336/j.1003-6520.hve.20220314
Huang, Y., Sun, Q., Li, Y., Sun, C., and Chen, Z. (2023). Damping technique empowered robust energy flow calculation for integrated energy systems. Appl. Energy 343, 121168. doi:10.1016/j.apenergy.2023.121168
Jain, P. K., Gupta, S., Bhavsar, A., Nigam, A., and Sharma, N. (2020). Localization of common carotid artery transverse section in B-mode ultrasound images using faster RCNN: a deep learning approach. Med. Biol. Eng. Comput. 58, 471–482. doi:10.1007/s11517-019-02099-3
Ji, Y. (2010). The development of substation equipment inspection technology. China Sci. Technol. Inf. 22, 145–146.
Li, C., Zhou, A., and Yao, A. (2022b). “Omni-dimensional dynamic convolution,” Proceedings of the Iclr 2022 - 10th international conference on learning representations. June 2022 Vienna, Austria,
Li, J., Gu, C., Yue, X., and Li, F. (2022a). Edge-cloud computing systems for smart grid: state-of-the-art, architecture, and applications. J. Mod. Power Syst. Clean Energy 10 (4), 805–817. doi:10.35833/mpce.2021.000161
Li, Y., Gao, W., Yan, W., Huang, S., Wang, R., Gevorgian, V., et al. (2021). Data-driven optimal control strategy for virtual synchronous generator via deep reinforcement learning approach. J. Mod. Power Syst. Clean Energy 9 (4), 919–929. doi:10.35833/mpce.2020.000267
Li, Y., Zhang, H., Liang, X., and Huang, B. (2019). Event-triggered-based distributed cooperative energy management for multienergy systems. IEEE Trans. Industrial Inf. 15 (4), 2008–2022. doi:10.1109/TII.2018.2862436
Liu, J., Jia, R., Li, W., Ma, F., Abdullah, H. M., Ma, H., et al. (2020a). High precision detection algorithm based on improved RetinaNet for defect recognition of transmission lines. Energy Rep. 06, 2430–2440. doi:10.1016/j.egyr.2020.09.002
Liu, X., Xu, K., Zhou, P., Zhou, D., and Zhou, Y. (2020b). Surface defect identification of aluminium strips with non-subsampled shearlet transform. Opt. Lasers Eng. 127, 105986. doi:10.1016/j.optlaseng.2019.105986
Liu, J., Zhong, L., and Dong, Na (2019). Algorithm research of visual accurate alignment for substation inspection robot. Industrial Instrum. Automation 6, 8–13. doi:10.1109/POWERCON.2018.8602257
Luo, P., Wang, B., Wang, H., Ma, F., Ma, H., and Wang, L. (2023). An ultrasmall bolt defect detection method for transmission line inspection. IEEE Trans. Instrum. Meas. 72, 1–12. doi:10.1109/TIM.2023.3241994
Luo, P., Wang, Bo, Ma, H., Ma, F., Wang, H., and Zhu, D. (2021). Defect recognition method with low false negative rate based on combined object. High. Volt. Eng. 47 (02), 454–464. doi:10.13336/j.1003-6520.hve.20200701
Ma, F., Wang, Bo, Dong, X., Wang, H., Luo, P., and Zhou, Y. (2019). Power vision edge intelligence: power depth vision acceleration technology driven by edge computing. Power Syst. Technol. 44 (6), 2020–2029. doi:10.1088/1742-6596/2166/1/012056
Matta, N., Rahim-Amoud, R., Merghem-Boulahia, L., and Jrad, A. (2012). “Enhancing smart grid operation by using a WSAN for substation monitoring and control,” in Proceedings of the 2012 IFIP wireless days Dublin, Ireland: IFIP Wireless).
Ouyang, J., and Yu, H. (2022). Natural Language description generation method of intelligent image internet of things based on attention mechanism. Secur. Commun. Netw. 2022–11. doi:10.1155/2022/1200469
Qi, R. U. (2019). Safety management of power system automation technology. Sci. Technol. Inf. 17 (20), 142–149. doi:10.1109/APAP47170.2019.9225130
Qian, J., Lin, J., Bai, D., Xu, R., and Lin, H. (2023). Omni-dimensional dynamic convolution meets bottleneck transformer: a novel improved high accuracy forest fire smoke detection model. Forests 14 (4), 838. doi:10.3390/f14040838
Sandler, M., Howard, A., Zhu, M., Zhmoginov, A., and Chen, L.-C. (2018). “Mobilenetv2: Inverted residuals and linear bottlenecks,” in Proceedings of the IEEE conference on computer vision and pattern recognition, 4510–4520. San Juan, PR, USA.
Shang, C., Tian, L., Gao, H., et al. (2019). Substation inspection system. Innovation Appl. 32, 34–35. doi:10.2991/cas-15.2015.55
Tian, G., Gu, Y., Shi, Di, Fu, J., Yu, Z., and Zhou, Q. (2021). Neural-network-based power system state estimation with extended observability. J. Mod. Power Syst. Clean Energy 9 (5), 1043–1053. doi:10.35833/mpce.2020.000362
Wang, B., Ma, F., Ge, L., Ma, H., Wang, H., and Mohamed, M. A. (2021a). Icing-EdgeNet: a pruning lightweight edge intelligent method of discriminative driving channel for ice thickness of transmission lines. IEEE Trans. Instrum. Meas. 70, 1–12. doi:10.1109/tim.2020.3018831
Wang, J., Xu, C., Yang, W., and Yu, L. (2021b). A normalized GaussianWasserstein distance for tiny object detection. https://arxiv.org/abs/2110.13389.
Wang, Z., Liu, J., Wang, F., and Wu, J. (2023). OPENnet: object position embedding network for locating anti-bird thorn of high-speed railway. IEICE Trans. Inf. Syst. 52, 824–828. doi:10.1587/transinf.2022DLL0011
Wang, Bo, Ma, F., Dong, X., Wang, P., Ma, H., and Wang, H. (2019). Electric power depth vision: basic concepts, key technologies and application scenarios. Guangdong Electr. Power 32 (9), 3–10.
Woo, S., Park, J., Lee, J.-Y., and Kweon, I. S. (2018). CBAM: convolutional block attention module. https://arxiv.org/abs/1807.06521.
Ya-wei, B. A. I., Zheng, Y.-feng, Guo, F., Guo, H.-de, Yang, H., and Wang, Y. (2006). Substation equipments inspection and defect management system based on centralization control pattern. Power Syst. Technol. S1, 186–188.
Zhai, Y., Yang, K., Wang, Q., and Wang, Y. (2023). Disc insulator defect detection based on mixed sample transfer learning. Zhongguo Dianji Gongcheng Xuebao/Proceedings Chin. Soc. Electr. Eng. 43 (7), 2867–2876. doi:10.13334/j.0258-8013.pcsee.212774
Zhai, Y., Yang, K., Zhao, Z., Wang, Q., and Bai, K. (2022). Geometric characteristic learning R-CNN for shockproof hammer defect detection. Eng. Appl. Artif. Intell. 116, 105429. doi:10.1016/j.engappai.2022.105429
Zhang, K., Lou, W., Wang, J., Zhou, R., Guo, X., Xiao, Y., et al. (2023). PA-DETR: end-to-end visually indistinguishable bolt defects detection method based on transmission line knowledge reasoning. IEEE Trans. Instrum. Meas. 72, 1–14. doi:10.1109/TIM.2023.3282302
Zhang, W., Hu, Bo, Xie, K., Shao, C., Niu, T., Yan, J., et al. (2022a). Short-term transmission maintenance scheduling considering network topology optimization. J. Mod. Power Syst. Clean Energy 10 (4), 883–893. doi:10.35833/mpce.2020.000937
Zhang, Y., Wang, B., Ma, F., Luo, P., Zhang, J., and Li, Y. (2022b). High-precision detection method of irregular outer surface defects of power equipment based on domain adaptation network. Gaodianya Jishu/High Volt. Eng. 48 (11), 4516–4526. doi:10.13336/j.1003-6520.hve.20220047
Keywords: tiny object detection, transmission line bolt defects, evaluation metrics fusion, omnidimensional dynamic convolution, anchor-based model
Citation: Zou H, Sun J, Ye Z, Yang J, Yang C, Li F and Xiong L (2024) A bolt defect detection method for transmission lines based on improved YOLOv5. Front. Energy Res. 12:1269528. doi: 10.3389/fenrg.2024.1269528
Received: 30 July 2023; Accepted: 26 February 2024;
Published: 08 March 2024.
Edited by:
Rong Jia, Xi’an University of Technology, ChinaReviewed by:
Yushuai Li, University of Oslo, NorwayNan Li, Shenzhen Institute of Artificial Intelligence and Robotics for Society, China
Copyright © 2024 Zou, Sun, Ye, Yang, Yang, Li and Xiong. This is an open-access article distributed under the terms of the Creative Commons Attribution License (CC BY). The use, distribution or reproduction in other forums is permitted, provided the original author(s) and the copyright owner(s) are credited and that the original publication in this journal is cited, in accordance with accepted academic practice. No use, distribution or reproduction is permitted which does not comply with these terms.
*Correspondence: Jialun Sun, MjAyMTA4NTgwMDIxMjIzQGN0Z3UuZWR1LmNu