 Chien-fei Chen
 Xiaojing Xu2
- 1The Institute for a Secure and Sustainable Environment, University of Tennessee, Knoxville, TN, United States
- 2Department of Business Analytics and Statistics, University of Tennessee, Knoxville, TN, United States
- 3College of Electrical and Automation Engineering, Nanjing Normal University, Nanjing, China
- 4Department of Electrical Engineering and Computer Science, Tickle College of Engineering, University of Tennessee, Knoxville, TN, United States
- 5North China Electric Power University, Beijing, China
Introduction: Demand response programs are promising approaches to balance supply and demand and reduce or shift peak hour loads. However, the impacts of residents’ behavioral patterns and social–psychological factors on these programs are poorly understood.
Method: We used an extended model of the theory of planned behavior to understand how social–psychological factors, demographics, and household characteristics influence the demand response behaviors (i.e., adjusting A/C and shifting the time of use) of 826 US residents who participated in our study.
Results: We found that low-income households (43.7%) reported as more likely to respond to the behavior of raising A/C thermostat settings when no one is home compared to higher-income residents. Thermal comfort needs (β = 0.34) and participants’ age (β = 0.02) increased the financial incentives requested to accept higher A/C temperatures while someone is home. Thermal comfort needs (β = 0.36) and energy-saving habits (β = −0.11) are the significant predictors of increased incentives requested for higher A/C temperatures when no one is home. Older adults request higher financial incentives for shifting washer and dryer usage than younger residents. Finally, attitudes toward energy saving are the strongest predictor of electricity curtailment behavioral intention, followed by perceived behavioral control, subjective norms, cost and environmental concerns, and energy-saving habits.
Discussion: This finding suggests the potential of social–psychological variables in shaping energy consumption behaviors. This study provides insights for designing effective demand response programs and broadly analyzing energy behavioral patterns.
1 Introduction
1.1 Motivation
According to the U.S. Energy Information Administration (EIA), the commercial, residential, and industrial sectors together consumed nearly 4 trillion kWh of electricity in 2021, with the residential sector having the largest share (31%) (Energy Consumption, 2022). In 2020, depending on the region, per capita residential electricity use decreased in many states in the U.S. South; however, per capita residential electricity use rose significantly in the West census region. For example, Arizona’s per capita residential electricity use increased by 10% compared with that of 2019, the largest increase of any state, followed by Nevada, Alaska, and California (9% each) (Francis, 2021). Higher energy consumption results in peak electricity demand, increasing the risk of power system failure, economically inefficient investment, and negative environmental impact (Gyamfi et al., 2013). Recently, power grids have significantly transitioned toward renewable and carbon-free systems. As the penetration of renewables increases, power systems will have fewer conventional generators, which implies less generation reserve capability. Thus, balancing real-time electricity demand and supply motivates greater utilization of DR resources. Nonetheless, residential DR resources are underutilized in facilitating power grid operation (Lake, 2010; Carmichael et al., 2021).
Implementing DR programs is one practical approach to decreasing or shifting energy demand by reducing customers’ electricity usage in response to changes in the electricity price or financial incentives at times of high wholesale market prices or when power grid reliability is in danger (Asadinejad et al., 2018; Delavari and Kamwa, 2018; Xu et al., 2018). Other benefits of DR include securing power supply, improving system restoration capacity, reducing costly network reinforcements, improving the use of renewable sources, providing power frequency regulation services, and reducing greenhouse gas emissions (Lee et al., 2012; Chen et al., 2020a; Shen et al., 2020a). However, the main goal of demand-side management is not just to save energy; customers’ energy efficiency decisions, such as raising/lowering heating/cooling thermostat settings, can influence the estimation of DR elasticity (Asadinejad et al., 2018; Pallonetto et al., 2020). For example, residents can participate in DR through behavioral changes that curtail usage [e.g., dimming lighting levels, raising/lowering space cooling/heating settings, with even a small change leading to significant changes in demand (Perez et al., 2016; Wang et al., 2021a)]. These programs may also shift electricity use from peak to off-peak periods, mainly through wet appliances (Kobus et al., 2015; Sadeghianpourhamami et al., 2016; Sharda et al., 2021), or allow the adoption of independently generated energy that reduces dependence on the power grid (Siano, 2014).
DR programs can be divided into two main categories: price- and incentive-based programs (Asadinejad et al., 2018; Fonseca et al., 2021). The price-based programs provide customers with different prices at various periods, such as time of use (TOU) pricing, real-time pricing (RTP), and inclining block rate (IBR) tariffs (Siano, 2014; Deng et al., 2015). On the other hand, incentive-based programs generally use financial incentives to encourage the reduction in demand by providing customers with load modification incentives, including direct load control (DLC), interruptible/curtailable load, demand bidding and buyback, and emergency demand reduction programs (Deng et al., 2015). Recently, incentive-based programs have received more attention because they are perceived as being more effective than price-based ones (Asadinejad et al., 2018; Xu et al., 2018).
With transportation, heating, and industrial electrification, it is expected that electrification will double power generation by 2050 (Chatzivasileiadi et al., 2017; Orths et al., 2019). It is a tremendous challenge for power operators to undertake such high demand and maintain the stability of the power system (O’Connell et al., 2021). One of the main ways for electrical operators to meet this challenge is DR and inducing peak reductions (Gao et al., 2019). For example, in the U.S., DR projects have provided peak reductions of 31,508 MW in 2017, of which the residential sector provided 28.5% of the peak savings (Hu et al., 2021). Additionally, DR is essential for meeting the recent increase in electric vehicle (EV) charging demand (Chen et al., 2020b). However, some scholars believe that EV users’ participation in DR requires the right technology and the appropriate incentives, energy policy, infrastructure, and government support (Steward, 2017; Vandenbergh and Gilligan, 2017). At the same time, the charging and driving patterns of EV users and relevant social–psychological factors are critical potential factors in improving DR programs (Axsen et al., 2015; Li et al., 2017; Chen et al., 2020b; Geels et al., 2020).
Despite DR potential, concerns remain regarding the uncertainty of DR programs, specifically in the amount of reducible load, financial viability, and negative impact on thermal comfort (Siano, 2014). Additionally, the performance of DR programs may vary over time and between contexts (Gyamfi et al., 2013; Hu et al., 2018): first, the energy-saving measures and related impacts, as well as methodologies, vary between studies, such as the duration of the study period; and second, at the current stage, most empirical studies attempting to investigate residents’ responses to DR programs are pilot studies on relatively small samples of consumers whose household characteristics are not representative of a general population. This situation makes it difficult to generalize the findings. It is, therefore, essential to investigate the potential social–psychological and demographic factors influencing residents’ DR participation based on a larger and better representative sample.
1.2 Literature review
Before analyzing the factors influencing DR acceptance, it is essential to recognize the main challenges of analyzing residential energy behaviors and DR implementation. As a result of the review on residential energy usage and DR literature, we could identify the following three primary types of challenges in addition to the issues of DR implementation discussed earlier.
Both price- and incentive-based DR programs are based on the assumption of rationality and utility maximization borrowed from the microeconomic theory, which argues that people are self-interested and instrumental and behave as rational actors who consistently weigh the expected costs and benefits of their actions (Gyamfi et al., 2013; Good, 2019). However, individuals do not always make rational decisions (Stern et al., 1986; Moreira et al., 2020); they lose their self-control, procrastinate, and fall prey to the effects of decision framing, reference dependence, cognitive load, emotions, habits, routines, etc. (Thaler and Sunstein, 2008; Dowlatabadi and Wilson, 2018). Additionally, the impact of incentives is inconsistent, and researchers have shown that targeted behavioral change ceases after removing the incentive (Ryan et al., 1999), suggesting that behavioral change depends on the incentive type, reinforcement schedule, and the type of behavior (Maki et al., 2016). Some scholars also argue that technology and price are just two of many factors that affect the adoption of energy efficiency measures (Rathi and Chunekar, 2015; Chen et al., 2017a). Therefore, residents are not making decisions about electricity use based on cost minimization only; the limited ability to access and process information also affects an individual’s behavior (Stern et al., 1986). Another issue with the rationality assumption is that it does not fully explain why household energy behaviors and the effects of incentives vary across socio-demographic groups (Vassileva et al., 2012a; Frederiks et al., 2015a). In summary, this branch of literature highlights the limitations of simplistic rational assumptions in explaining household energy behaviors.
Residential demands are considered hard to control as end users’ energy consumption patterns and preferences vary by demographics and other social–psychological attributes (Hu, 2015; Xu et al., 2018). Compelling evidence has shown that household characteristics and demographics (some referred to as socio-demographics) are linked to pro-environmental energy use behaviors and DR participation (Hayn et al., 2014; Frederiks et al., 2015a; Frederiks et al., 2015b; Hu, 2015; Yamaguchi et al., 2020; Falaki et al., 2021). For example, a review summarized that age, gender, education, employment status, income, household, dwelling size, and homeowner status significantly impacted household energy use (Frederiks et al., 2015b). Additionally, recent studies have found that appliances, occupant behavior, and building features (e.g., building orientation) could predict a household’s non-heating electricity consumption (Huebner et al., 2016; Shen et al., 2020b). However, the relationship between demographics, household characteristics, and residential energy consumption is not always consistent. A review of 10 empirical studies in Europe indicated that household size, dwelling size, income, employment status, and rural versus urban location have almost always had a significant relationship with energy demand. In contrast, age and homeownership sometimes have a significant relationship, and education level rarely matters (Hayn et al., 2014). Similarly, Fell et al. (2015a) found that factors such as age, gender, income, education, employment status, social grade, and housing tenure were not consistently associated with residents’ willingness to switch to a TOU pricing tariff in Great Britain. Another study reported that the desire to switch to a TOU tariff was unrelated to gender or homeownership (Nicolson et al., 2017).
A better estimation of DR behavior from the details of customers’ diverse demographics may be essential for performing a cost–benefit analysis, generating a better DR implementation plan, and increasing power system efficiency (Nolan and O’Malley, 2015; Fang et al., 2016). Furthermore, studies of price elasticity indicate a somewhat skewed distribution; in one study, 50% more low-income households (LIHs) responded to the price-based DRs compared to their higher-income counterparts (Parker et al., 1996), which suggests that despite lower energy usage, LIHs may be more responsive to price-based DR, highlighting the importance of studying DR through an energy justice lens. LIHs represent an important but often-neglected segment of the residential energy sector for DR research (Chen et al., 2017a). A combination of DR program factors was discovered to contribute to the burden of energy costs in LIHs: 1) higher cost of peak prices and smart appliances, 2) building and appliance inefficiencies, 3) inflexible schedule, and 4) behavioral patterns. Researchers should, therefore, consider LIHs’ or underserved communities’ needs and barriers to adopting or changing DR behaviors when investigating DR potentials (Chen et al., 2017a). In summary, this line of research emphasizes inconsistencies in the impact of traditional demographic factors on energy consumption, the uncertainties brought by the impact of evolving technology, and the complex interplay of social and economic factors represented by LIHs.
Evidence shows that price alone is insufficient to change energy habits or influence technology adoption; other social–psychological factors such as environmental concern, comfort need, or health concern play a critical role in adopting pro-environmental behaviors and lowering energy consumption (Delmas et al., 2013; Chen et al., 2017a; Li et al., 2021). Scholars also suggest that framing an environmental issue or energy conservation effort influences individuals’ decisions; for example, Xu et al. (2015) indicated that environmentally-framed benefits induced more positive attitudes toward energy savings than economically-framed benefits among residents with moderate levels of environmental concern and liberal political identities. Another study reported that health-based messages, rather than cost-saving ones, encouraged reductions of 8%–10% in household energy use over 100 days (Asensio and Delmas, 2016).
A recent study found that customer non-economic psychological factors (i.e., customer aversion to loss endowment and awareness of carbon emissions) and emission tax influence the acceptance of incentive-based demand response (IBDR) programs (Lin et al., 2022). That is, an increase in customers with a high level of endowment valuation or carbon awareness leads to more energy demand reduction but lower total cost and carbon emission. Customers who are more concerned about climate change are willing to participate in DR events. Within limited studies, some researchers have consistently identified trust and confidence in the utility company as important influences on customers’ acceptance of direct load control (DLC) programs, an essential type of DR (Fell et al., 2015b; Stenner et al., 2017). Trust in utilities is also positively related to public acceptance of smart meters (Chen et al., 2017b) and home energy management systems (Chen et al., 2021). Additionally, scholars found that lack of knowledge and awareness, technology anxiety, and privacy and cybersecurity concerns are the barriers for some residents to adopt home energy management systems (Chen et al., 2020c; Chen et al., 2021).
Other factors such as attitudes from the TPB, including personal beliefs, norms, values, behavioral tendencies, and external conditions, such as incentives, policies, and costs, will affect people’s energy use behavior (Guagnano et al., 1995; Wang et al., 2021b). Furthermore, a study based on a twenty-seven-country sample concluded that perceived behavioral control (also from the TPB) was the strongest predictor of willingness to sacrifice for the environment, which, in turn, affected a variety of pro-environmental behaviors (Oreg and Katz-Gerro, 2006). Our study was designed to investigate the importance of social and psychological factors in shaping behaviors related to energy consumption and based on the TPB (Vassileva et al., 2012b).
Based on a rational decision-making framework, the TPB is a widely adopted social–psychological theory to explain how attitudes, social norms, and perceived behavioral control (PBC) impact behavioral intention (Ajzen, 1991; Linda et al., 2015; Chen, 2016; Wolske et al., 2017; Ji and Chan, 2020; Fu et al., 2021). The TPB assumes that behavioral intention is the antecedent of actual behavior; thus, the more substantial the intention is, the more likely the behavior will be executed. Despite significant supporting evidence, Ajzen encourages scholars to include additional predictors in the model to enhance the proportion of variance in intention or behavior that can be explained. Empirically, other researchers have demonstrated that an extended TPB model has better explanatory power for adopting renewable energy technologies (Chen et al., 2016; Wang et al., 2016; Conradie et al., 2021) and other pro-environmental and energy-saving behaviors (Bamberg, 2003; Chen et al., 2017a). Based on previous literature, this study tested how an extended TPB model, with the addition of essential variables including environmental concern, cost concern, thermal comfort need, and energy-saving habits, successfully explains both DR acceptance with financial incentives and intention to engage in electricity curtailment behaviors.
1.3 Challenges and paper contributions
This study examined the influence of social–psychological factors, demographics, and household characteristics on public acceptance of residential DR programs with financial incentives and energy-saving intentions in the U.S. Specifically, this study focused on cooling practices, one of the significant contributors to residential energy demand (Strengers, 2010; Asadinejad et al., 2018; Xu et al., 2018), and on shifting washer and dryer time of use as an indicator of typical flexible loads (Mohseni et al., 2017). To provide a deeper analysis of DR acceptance, this study investigated the level of financial incentives that residents requested to get their engagement in each DR-related behavior of interest (as opposed to asking participants to provide a simple rating on their level of willingness to participate in the corresponding behavior) and the influence of social–psychological factors and household characteristics on DR acceptance. Additionally, this study analyzed how these factors impact residents’ intention to engage in electricity curtailment behaviors without incentives. It is important to note that our research was designed to estimate willingness to participate in DR incentive-based programs instead of calculating DR based on electricity pricing.
Specifically, this study attempted to answer the following research questions: 1) “What are the important social–psychological factors influencing DR acceptance and behavioral intention to save energy after accounting for different demographics and household characteristics?” 2) “Are DR acceptance and intention to save energy affected by the same factors?” 3) “What is the reasoning behind accepting or not accepting DR?” 4) “What are the distinct characteristics of DR flexible and inflexible respondents?” This study made three primary contributions. First, the research highlighted the critical role of social–psychological factors, which is often ignored in DR literature, in understanding energy use and DR-related behaviors. Importantly, this study provides fundamental knowledge for better analyzing the underlying drivers influencing DR participation, both with and without financial incentives. Traditional DR programs primarily focus on customers’ responses to electricity prices or other financial incentives, but they often fail to consider the underlying drivers of customers’ behavior. Understanding these factors and related behavioral patterns can help estimate the reasons for incentive-based elasticity, where elasticity is defined as the effect of demand response changes with financial incentives (Asadinejad et al., 2018). Second, the results of this study provide insights for utility companies and policymakers to design suitable DR programs to potentially reduce the cost of implementing DR based on the analysis of a larger sample of customers, thus, potentially increasing DR performance. Specifically, our analysis regarding the impact of different financial incentives on DR program response will help utilities and policymakers develop an approach that allows for estimating DR potential from residents with diverse household and social–psychological characteristics. Third, this study enriches DR literature by adopting and extending the well-established theory of planned behavior (TPB) to examine the public’s DR acceptance. This approach is unique because most pro-environmental behavior (PEB) and energy conservation literature have adopted social–psychological theories, while DR research has neglected to do so, except for a few isolated studies (Strengers (2012)).
1.4 Paper organization
This paper is structured as follows: Section 2 explains the research method with the details of participants and survey procedure (Section 2.1), analytic approach (Section 2.2), and survey measures (Section 2.3). Section 3 reports the results with the details of descriptive statistics (Section 3.1), correlations among significant variables (Section 3.2), and results of regression analysis (Section 3.3). Finally, Section 4 provides policy implications and a consultive summary.
2 Method
2.1 Participants and procedure
This study designed an internet-based survey administered through Amazon Mechanical Turk (MTurk), a widely used Internet marketplace that enables researchers to collect data on human intelligence tasks rapidly and inexpensively (Buhrmester et al., 2011). The online survey was composed of 50 questions arranged in multiple themes: the requested incentives for engaging in DR behaviors, intention to engage in curtailment behaviors, social–psychological factors, energy-saving habits, and demographics. Everyone residing in the U.S. and paying non-flat-rate utility bills could participate and were compensated with a small financial incentive through Amazon Payment.
Within the sample of 826 U.S. residents, 41.97% of the participants were males, and 58.03% were females. Ages ranged from 18 to 76 (Mean = 35.01). The majority of participants were White (83.25%), followed by Black (4.73%), Latino (4.73%), Asian (4.13%), multi-race (2.31%), and Native American (0.48%). Most participants (52.14%) had a bachelor’s degree/equivalent or above, and 49.57% reported owning their place of residence. Additionally, about a quarter (24.94%) lived in dwellings smaller than 950 sq. ft., and another quarter (25.54%) lived in dwellings larger than 1900 sq. ft. Two-person households were the most common (33.90%), followed by three-person (22.15%), four-person (19.61%), and even larger households (13.56%), while single-person households were the least common (10.53%). Most participants (40.07%) identified themselves as democrats, 28.08% identified themselves as republicans, 19.73% as independents, and 11.86% as apolitical. Compared to U.S. Census data, our sample has younger individuals and higher proportions of women, white people, and democrats than the U.S. population.
2.2 Analytic approach
Using IBM SPSS 24.0 and R software, we analyzed descriptive statistics, correlations, principal component analysis (PCA), and OLS multiple linear regression models. The basic descriptive statistics helped analyze univariate and bivariate sample characteristics. A PCA with varimax rotation was conducted to further explore the structure among all social–psychological predictors and check for independence (Table 1). Eight meaningful principal components (with eigenvalue >1.00) emerged from the PCA, and each component aligned well with a distinct group of items intended to measure a single social–psychological variable. The cross-loadings were very low. Moreover, the results support distinguishing space heating and cooling habits from other electricity curtailment habits because the two components emerged as distinct components. Finally, several multiple linear regression models were fitted to test the impact of demographics and social–psychological factors on the dependent variables. The linearity assumption is explained in Section 3.1.1. The bootstrapping tests with 5,000 resamples and a 95% bias-corrected confidence interval tested the robustness of the regression coefficients.
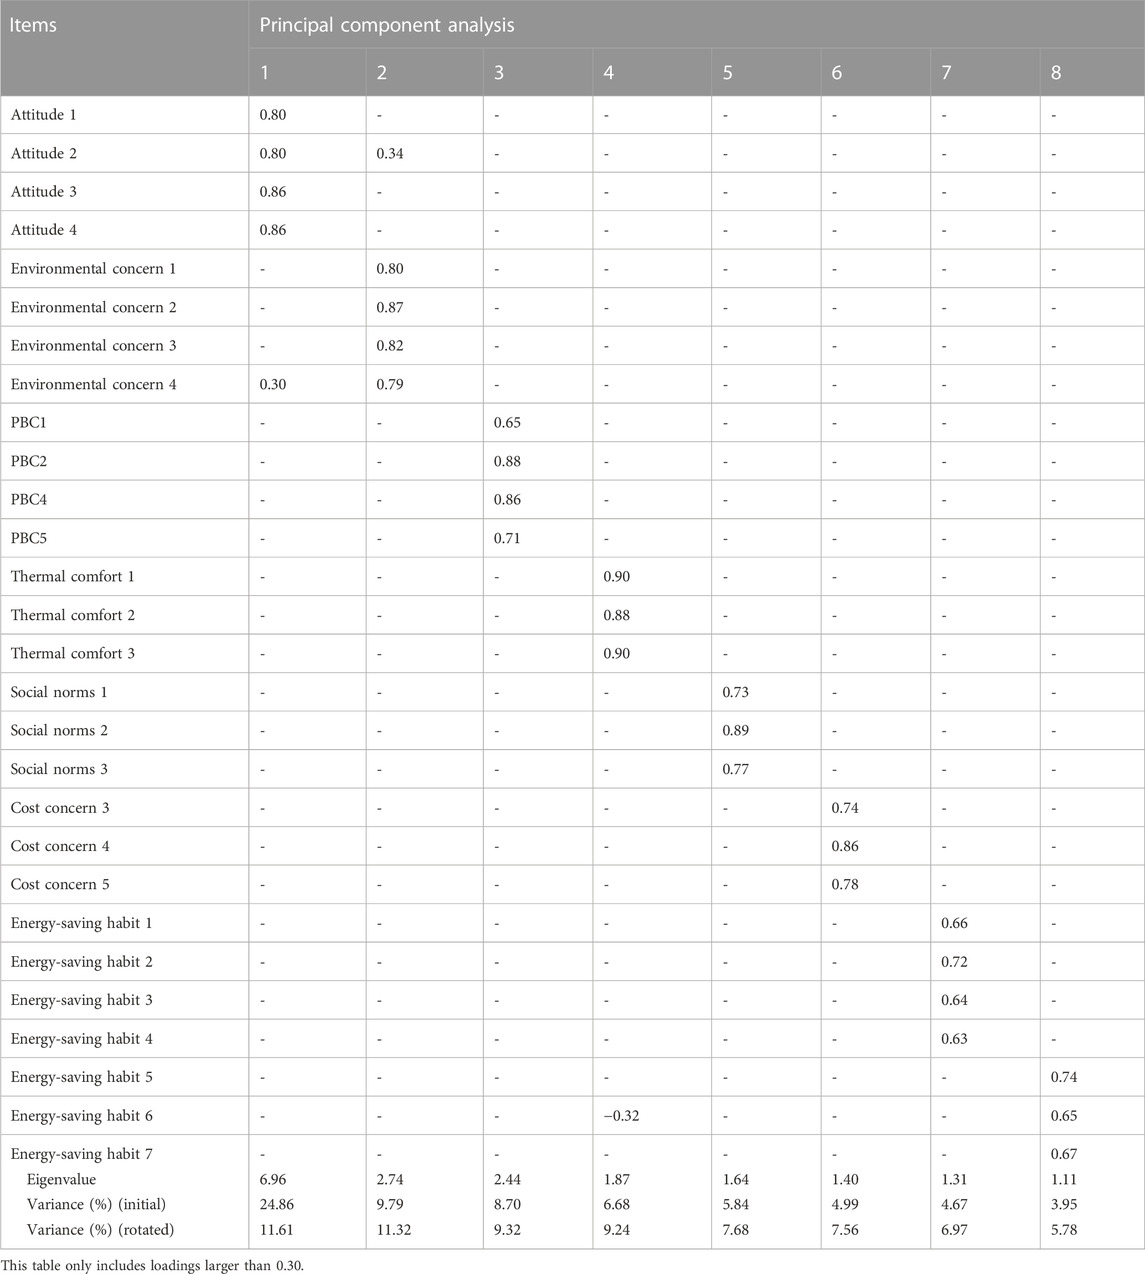
TABLE 1. Principal component analysis on independent variables with varimax rotation.
2.3 Measures
2.3.1 Dependent variables
2.3.1.1 Incentives requested to accept DR behaviors
This study investigated the incentives requested for engaging in three DR behaviors, resulting in three dependent variables. The three DR behaviors of interest are as follows: “raising the cooling thermostat setting by 2–3°F in summer when someone is home,” “raising the cooling thermostat setting by 5°F or more in summer, or completely shutting it down before someone leaves home for more than 4 h,” and “shifting the washer and dryer use time to after 11 PM. only, assuming that the utility company would provide a programmable device for free.” These behaviors were chosen because space cooling consumes the most energy, and laundry devices account for the largest deferrable loads in households (US Energy Initiatives Corp Inc Common Stock, 2018). Research further demonstrates, by both simulation and field experiments, that adjusting A/C thermostat settings, even within a small range, contributes significantly to DR peak load reduction (Wang et al., 2013; Ali et al., 2014; Perez et al., 2016). Moreover, adjusting thermostat settings improves the overall longevity of the A/C, as opposed to cutting the power supply. The survey asked participants what the minimum financial incentive would be for them to engage in each DR behavior. The incentives were based on relative reductions to monthly utility bills. For A/C behaviors, the participants were asked to choose one of the following options: “I would do that regardless of rewards,” “<5% of my monthly bill,” “≥5% of my monthly bill,” “≥10% of my monthly bill,” all the way to “≥25% of my monthly bill,” and “I would not do it no matter how much I would be rewarded.” For washer and dryer behaviors, the options were as follows: “I would do that regardless of rewards,” “<3% of my monthly bill,” “≥3% of my monthly bill,” “≥5% of my monthly bill,” “≥7% of my monthly bill,” to “≥10% of my monthly bill,” and “I would not do it no matter how much I would be rewarded.” The rewards for washer and dryer behaviors were smaller than those for A/C behaviors because shifting washer and dryer schedules has a more minor impact on power systems (Asadinejad et al., 2018).
This study intentionally included two options on each end of the spectrum: performing and not performing the behavior, regardless of the incentive amount. We expected that making decisions about these extremes would be different from choosing a very small or large incentive level. Therefore, we had the option of excluding respondents who chose these extremes or using the complete set of observations, including the full range of responses (from one to eight). The main drawback of the first approach is that a significant number of observations are removed, while the main disadvantage of the second approach is that responses might be non-linear, especially at the extremes (i.e., the difference between the “I would do that regardless of rewards” and “<5% of my monthly bill” may not be the same as the difference between “<5% of my monthly bill” and “≥5% and <10% of my monthly bill”). This study fitted the same regression model on the complete data and the subset of data that excludes extreme responses to investigate the regression residuals (differences between the fitted and observed values) plotted against fitted values. The variance in the residuals for each response value was similar (Figures 1–3), suggesting that the response was not only linear for the six incentive levels but also extended to the extreme responses. Furthermore, the regression results were similar for both regression models. Thus, we present the second regression model that does not exclude extreme responses in this paper.
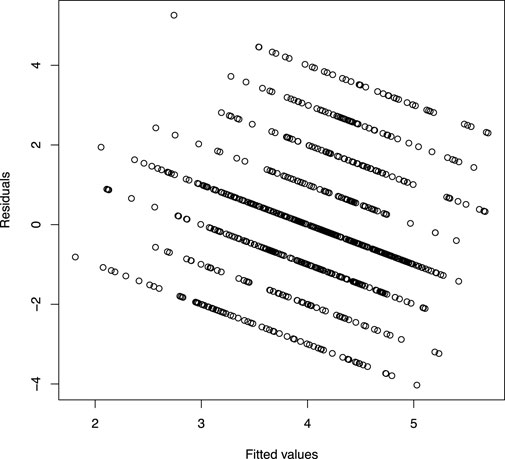
FIGURE 1. Residual plot of the incentive requested for adjusting A/C thermostat settings when someone is home.
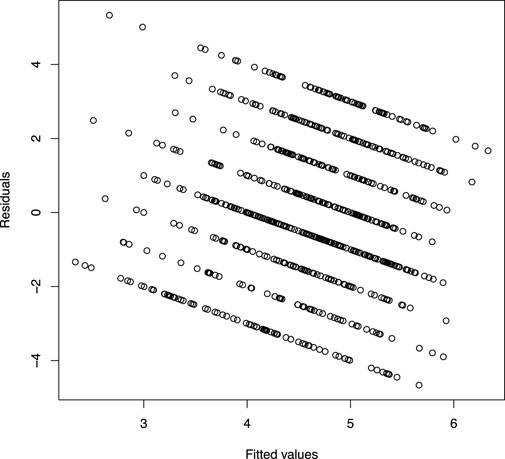
FIGURE 2. Residual plot of the incentive requested for adjusting A/C thermostat settings when no one is home.
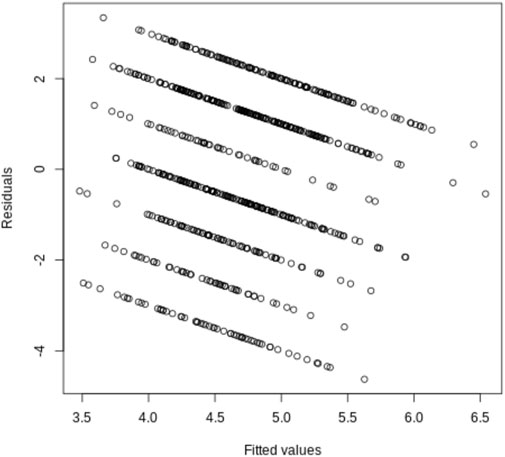
FIGURE 3. Residual plot of the incentive requested for shifting washer and dryer use time.
2.3.1.2 Intention to save energy
Another dependent variable was measured by residents’ behavioral intention to engage in electricity curtailment behaviors, and three items were used to measure this variable, as shown in Table 2. Participants were asked to rate how much they agreed with each statement on a 7-point Likert scale, from “1 = strongly disagree” to “7 = strongly agree.” Based on good internal consistency (Cronbach’s α = 0.80), we used the average score across the three items to indicate the level of intention.
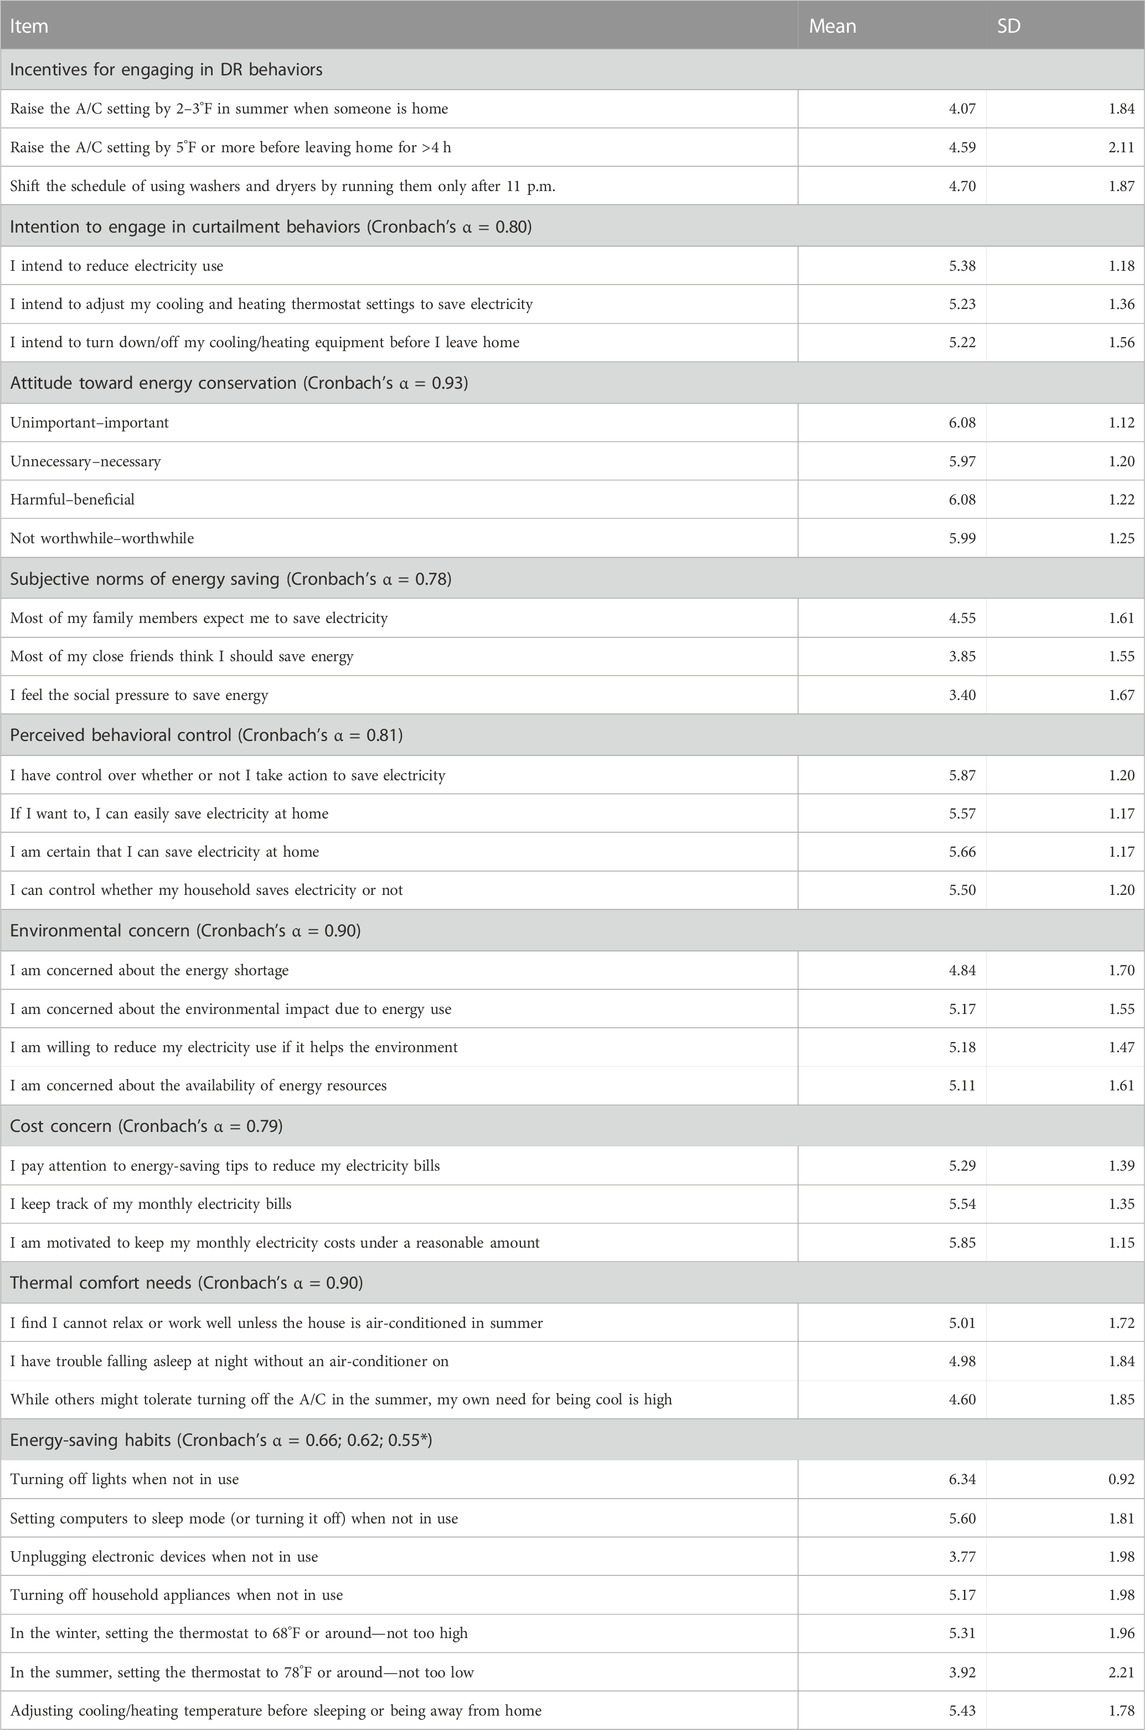
TABLE 2. Mean and standard deviation of major variables.
2.3.2 Independent variables
2.3.2.1 Social–psychological predictors
All the social–psychological variables were measured by a 7-point Likert scale, where one indicated “strongly disagree” or “never” and seven indicated “strongly agree” or “very often.” Table 2 presents each variable’s description, mean, and standard deviation. Cronbach’s alpha values were also included to indicate the levels of internal consistency across items.
2.3.2.2 Demographics and household characteristics
Participants also reported demographic information, including age, income, education level, and household characteristics, such as homeownership status and square footage. Homeownership was coded as one for “homeowner,” and home square footage was recorded as an ordinal variable from one (very small) to four (large), based on the quartiles1 of the distribution.
3 Results
3.1 Descriptive statistics
3.1.1 Incentives for adjusting 2°F–3°F at home and 5°F or more away from home
When asked about the incentive amount needed to adjust the thermostat 2°F–3°F, most participants (30.63%) indicated needing at least a 10%–15% reduction in utility bills, while 17.55% of participants indicated needing a 5%–10% reduction (Figure 4). Some participants (5.09%) rejected this DR behavior regardless of the incentive amount, but 9.08% of the participants were willing to do it without any incentives. When asked about the amount of incentive requested for raising A/C thermostat settings by 5°F or turning it off completely when no one is home, most participants (20.94%) needed a 10%–15% reduction on their bills, followed by 12.47% of participants needing a 5%–10% reduction, and 12.47% of participants needing more than 25%. Meanwhile, 9.32% of the participants rejected this DR behavior regardless of the incentive amount, while 10.05% were willing to do it without any incentives. The reductions needed to perform this DR behavior were more spread out than those for adjusting A/C thermostat settings when someone is home. In other words, residents’ opinions seemed more diverse in choosing the incentive level for adjusting A/C thermostat settings when no one was home. In contrast, residents had similar mindsets, somewhat more positive ones, in deciding the incentive levels for adjusting thermostat settings when they were home.
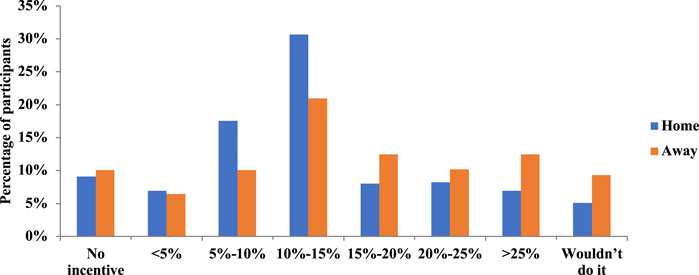
FIGURE 4. Distributions of required incentives for adjusting A/C thermostat settings in summer.
3.1.2 Incentives for shifting washer and dryer use time to off-peak hours
For the incentive levels needed for participants to shift their laundry washing and drying time to off-peak hours during weekdays, 23.61% of the participants preferred a bill reduction of more than 10%, followed by 19.25% requiring a 5%–7% bill reduction (Figure 5). Quite a few participants (16.95%) said that they would not shift their use time, regardless of incentives. In contrast, 7.14% of participants said they would change to off-peak hours without any incentive.

FIGURE 5. Distributions of required incentives for shifting washer and dryer usage.
3.1.3 When incentives do not matter—Responsive vs. non-responsive groups
For each of the three DR behaviors, a notable portion of the participants indicated that they would raise their A/C setting when someone was home (9.08%), increase their A/C setting when no one is home without any incentives (10.05%), and shift washer and dryer time (7.14%) regardless of incentive levels (i.e., the most responsive group). Additionally, similar portions of participants were unwilling to raise their A/C setting when someone was home (5.09%), increase their A/C setting when no one was home (9.32%), or shift their washer and dryer times (16.95%) regardless of incentive levels (i.e., the non-responsive group). To better understand the reasoning behind these two extreme choices, we asked participants why they picked their answers. Among the most responsive group, the most-reported reason for adjusting A/C settings when at home (Figure 6) was “to save money,” followed by “it suits my values” and “it goes along with our habits.” Additionally, participants also cited “2–3°F would not make big differences,” “to save the environment,” and “to save resources” as important reasons. On the other hand, the most cited reasons for the non-responsive group (Figure 7) were “medical and physical needs,” followed by “cannot endure being cold/hot.” A notable portion of respondents also mentioned reasons such as “I have set the temperature at the highest that I can” or “I cannot raise the temperature further,” or they even cited their pet’s needs as a barrier to adjusting A/C settings.
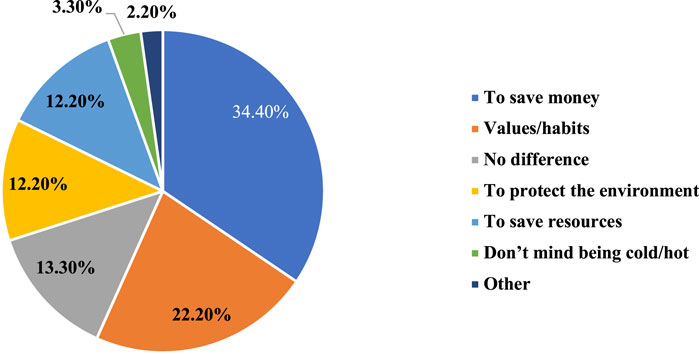
FIGURE 6. Reasons for participating in demand response without incentives.
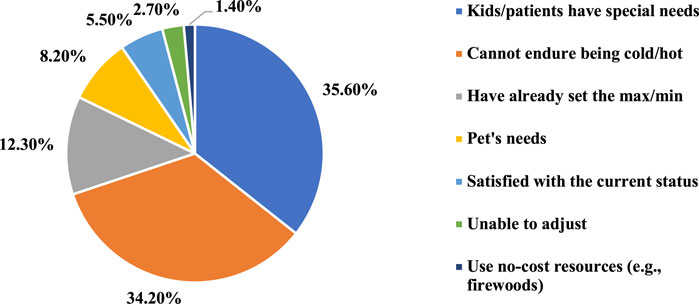
FIGURE 7. Reasons for not participating in demand response regardless of incentives.
To investigate the difference between the most responsive and the non-responsive groups in demographic and household characteristics, t-tests and χ2 tests of independence were conducted. Because our data showed that the most responsive and non-responsive participants in one DR program did not necessarily respond the same way to another DR program, analysis was conducted for each program separately. Regarding the DR behavior of raising A/C thermostat settings when someone was home, the most responsive group was younger (M = 33.08) than the non-responsive group (M = 38.32), with an alpha level of 0.05, t (114) = −2.30. However, the two groups were very similar in demographics and household characteristics. As for the behavior of raising A/C thermostat settings when no one was home, χ2 (2, N = 826) = 8.49, p < 0.05, the most responsive group tended to be of lower-income (43.37%; defined as households with an annual income of ≤ $35,000) than that of the non-responsive people (24.68%), indicating higher DR potential among lower-income residents than among higher-income residents. Furthermore, the most responsive participants tended to be renters (63.41%), χ2 (2, N = 826) = 7.61, p < 0.05, compared to 41.56% of the non-responsive participants (Figures 8, 9). Last, regarding shifting washer and dryer use time, the most responsive group was younger (M = 34.81) than the non-responsive group (M = 40.23), with an alpha level of 0.05, t (195) = −2.85. Meanwhile, the most responsive participants tended to be homeowners (67.80%), χ2 (1, N = 826) = 14.95, p < 0.001, compared to 37.86% of non-responsive participants. The results suggest DR programs need to consider age, income, and homeownership when predicting public acceptance and an appropriate incentive level.
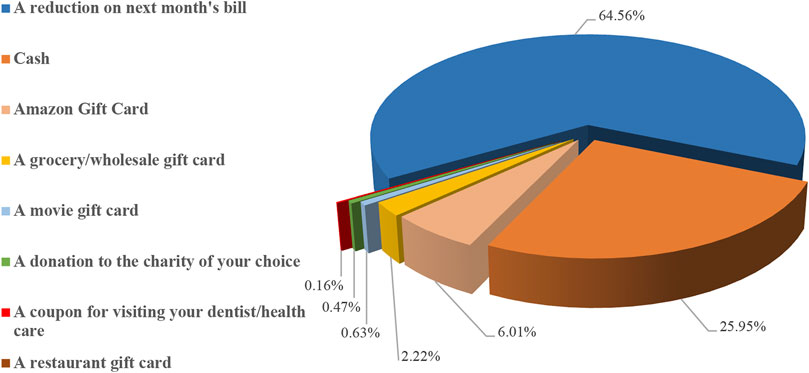
FIGURE 8. Preference for incentive form.
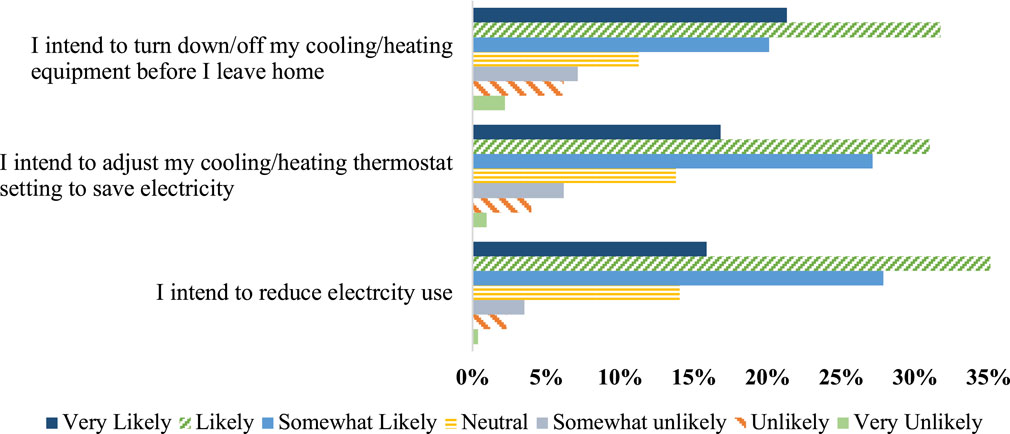
FIGURE 9. Distributions of intention to save electricity.
3.1.4 Preferred type of incentives for DR behaviors
While this study primarily conceptualized DR financial incentives as a monthly bill reduction, we also considered if there are other financial incentives that participants may be interested in. This study, therefore, asked the participants to choose their preferred type of incentive for accepting the DR behavior of adjusting A/C thermostat settings by 2°F–3°F when someone is home (Figure 8). A reduction on the monthly bill was indeed the most popular form of incentive, chosen by 64.56% of the participants. Cash was the second most popular form, preferred by 25.95% of the participants. Although one possible explanation is that it is not very convenient to turn the gift card into a physical need, thus this indirect incentive is troublesome for residents.
3.1.5 Intention to engage in electricity curtailment behaviors
Most respondents reported some level of intention to save energy but not strongly (M = 5.28, SD = 1.16), based on a 7-point Likert scale. In each intention question, more than 70% of the participants responded positively (Figure 9). On reducing electricity use in general, 15.86% indicated a firm intention, and 35.96% indicated a moderate intention. Regarding the specific behavior of adjusting thermostat settings to save electricity, 16.83% of the participants reported a strong intention, and 30.99% indicated a moderate intention. Meanwhile, 21.31% of the participants showed a strong intention to turn down/off their cooling/heating devices before leaving home, and 31.72% reported a moderate intention. Overall, the answers were relatively consistent across these three behavioral items.
3.2 Correlations among major variables
Table 3 illustrates the correlations between significant variables and the mean and standard deviation of each variable. Each requested incentive had a negative and weak correlation with energy-saving intention, meaning that residents with a higher energy-saving intention tended to ask for lower financial incentives for participating in DR behaviors, but not necessarily. Among the three requested incentives, the ones regarding A/C use were moderately correlated, and both were related to the dependent variable of washer and dryer use to a lesser extent. Among all the social–psychological variables, the highest correlation was between environmental concern and attitudes toward energy saving (r = 0.57, p < 0.001), followed by attitudes and cost concern (r = 0.44, p < 0.001), environmental concern and subjective norms (r = 0.36, p < 0.001), and attitudes and subjective norms (r = 0.34, p < 0.001). None of the social–psychological variables were highly correlated and are, therefore, suitable for being independent variables of one regression model.
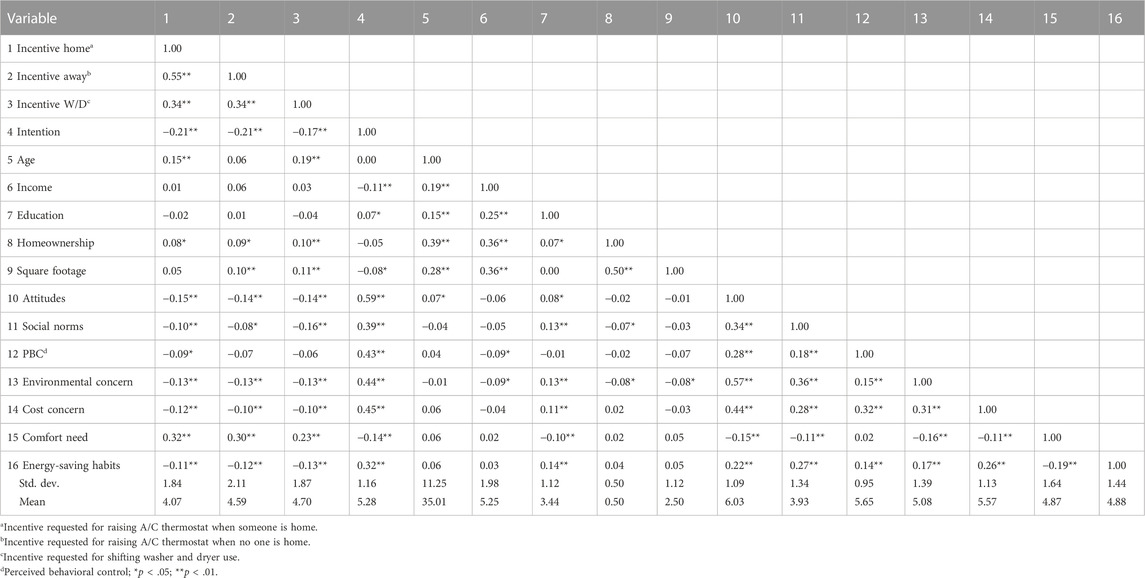
TABLE 3. Correlations of major variables.
3.3 Results of regression analysis
Four separate regression models were used to analyze how demographics, household characteristics, and social–psychological factors predicted the necessary incentive levels for participants to accept each of the three DR behaviors and electricity curtailment intention in general. The social psychological variables include the three major components of TPB (i.e., attitude toward energy saving, social norms, and PBC) and additional variables that extend the TPB model: cost and environmental concerns, thermal comfort needs, and energy-saving habits.
3.3.1 Predicting incentives requested for A/C-related behaviors
Model 1 predicted the factors influencing the incentive level needed for participants to increase their thermostat settings by 2°F–3°F while someone is home during the weekdays in summer (Table 4). Overall, all the predictors in model 1 accounted for 13% of the variance in the necessary incentive levels. Among all the predictors, only age and comfort needs were statistically significant (p < 0.005). Elderly residents and those with higher comfort need tended to indicate a higher incentive level than their counterparts. The regression equation is given as follows:
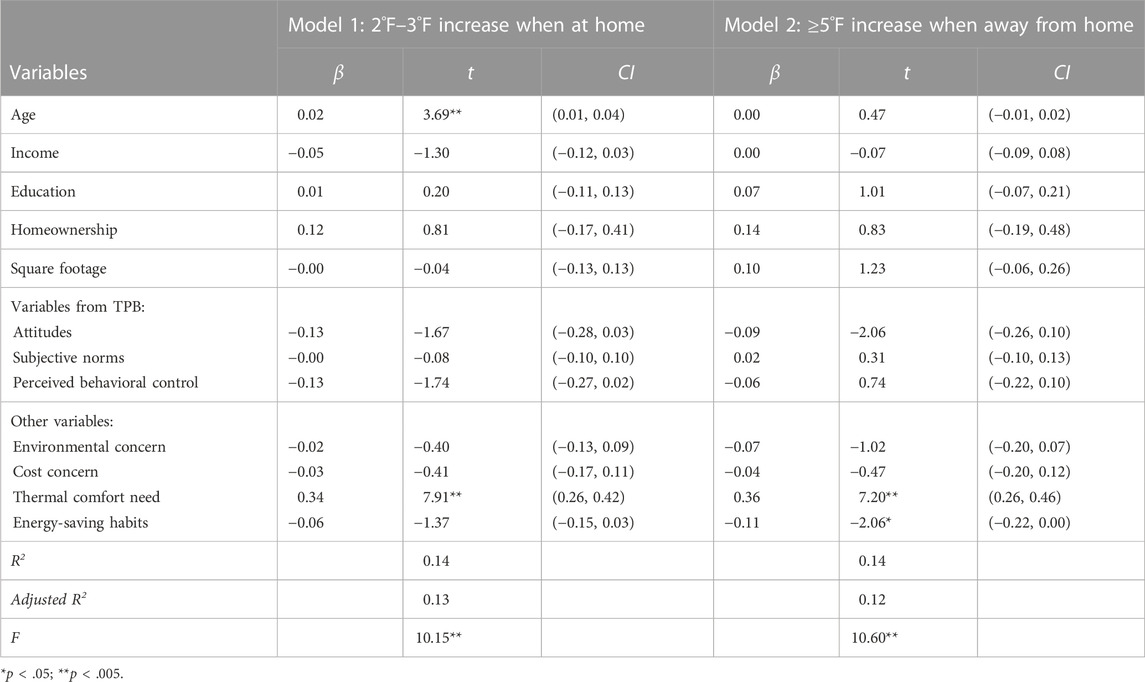
TABLE 4. Regression models on incentive requested for adjusting 2°F–3°F when at home (model 1) and 5°F or more when away from home (model 2).
Model 2 predicted the incentive needed to raise the thermostat setting to 5°F or more (or shut down the A/C completely) when no one is home (Table 4). The predictors accounted for 12% of the variance in the necessary incentive levels. Higher comfort needs were significantly predictive of requesting higher financial incentives (p < 0.001). Also, energy-saving habits were positively related to requesting lower incentives (p < 0.05). The regression equation is given as follows:
To further compare the predictive power of demographic factors with that of social–psychological variables (i.e., the ones included in the extended TPB model), we fit both regression models first with demographic predictors only and then with social–psychological predictors only. Results show that social–psychological variables better predicted the incentives needed to raise A/C settings when someone is home (adjusted R2 = 0.11) and when nobody is home (adjusted R2 = 0.10) than demographics did (adjusted R2 = 0.02 and 0.00, respectively). In terms of the significance of each predictor, the results were the same as when all the variables were included in a single regression model, except for the energy-saving habits (heating/cooling related) coefficient, which was no longer significant (p = .07). Supplementary Table A1 in Supplementary Appendix presents the detailed results. It can be observed from Table 4 that in air-conditioning-related DR projects, no matter how many degrees the air-conditioning is increased, the thermal comfort need of residents is the main influencing factor. Therefore, when companies formulate DR project plans or publicize DR, they need to focus on the thermal comfort of residents.
3.3.2 Predicting incentives requested for shifting washer–dryer use time
Regression model 3 was also conducted to predict the incentives needed to shift the washer–dryer use time to off-peak hours (11 p.m., in this case) during weekdays. The predictors, similarly, included the three TPB variables, cost and environmental concerns, and energy-saving habits. This regression model used everyday practices such as turning off lights and putting computers into sleep mode when not in use, instead of space heating and cooling behaviors, to measure daily energy-saving habits. A/C-related energy-saving habits, therefore, were not included in this model because they may relate to particular health and caring needs and, therefore, are not predictive of washer and dryer use. The variable of comfort need was also excluded for the same reason.
The predictors accounted for 6% of the variance in the requested incentive levels (Table 5), and age was a positive predictor (B = .003; p < 0.01). An increase in age was associated with increased incentive needed to shift washer and dryer use time. Positive attitudes toward energy-saving (B = −0.19, p < 0.05) and social norms saving (B = −0.13, p < 0.05) were also related to needing lower levels of incentives. The regression equation is given as follows:
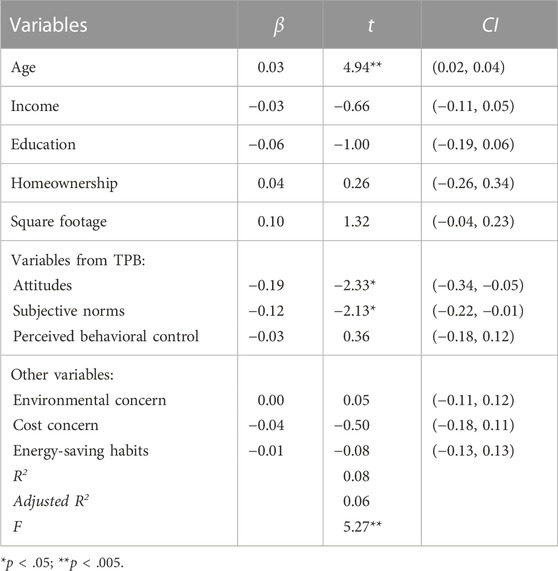
TABLE 5. Regression model (model 3) on incentives required for shifting washer and dryer usage.
When demographic and social–psychological variables were included in two separate models to compare their predictive power, neither model performed adequately (adjusted R2 = 0.04 and 0.03, respectively). See Supplementary Table A2 in Supplementary Appendix for detailed results. This finding was expected because the entire model with all predictors also had low R2. Therefore, unmeasured factors might exist that explain the incentive needed to shift washer and dryer use time. One possible explanation is that it is unrealistic for residents to use washers and dryers during off-peak hours since their rest and working hours are hard to change. The low R2s of models 1–3 imply that explanations of the incentive levels needed to participate in DR programs (i.e., reducing energy consumption during peak hours) require different types of predictors than what are commonly used to characterize energy curtailment behaviors in general (and used in this study). Our findings do not support an immediate (and necessary) practical implication that utilities might receive a better response to incentives by targeting a particular demographic or a particular set of users with specific social–psychological attributes.
3.3.3 Predictors of electricity curtailment intention
Last, regression model 4 was fitted to predict electricity curtailment intention. Once again, the three TPB variables, cost and environmental concerns, comfort need, and overall energy-saving habits (not cooling/heating related) were included as the predictors (Table 6). This model fit much better than the previous models, with the predictors accounting for 49% of the variance in the behavioral intention to reduce electricity. The regression equation is given as follows:
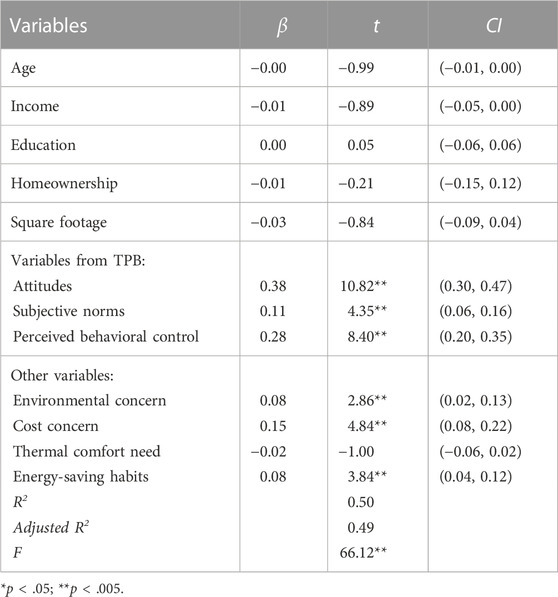
TABLE 6. Regression model (model 4) on residents’ intention to engage in curtailment behavior.
Interestingly, all the social–psychological variables, except for thermal comfort needs, were significantly predictive of the intention to save energy, while none of the demographic variables were. Specifically, positive attitudes toward energy-saving were the most important predictor of higher levels of energy-saving intention, followed by a higher level of PBC. In addition, strong social norms, cost and environmental concerns, and good energy-saving habits were also positively related to residents’ intention to save energy.
To compare the predictive power of demographic factors with that of social–psychological variables more directly, we fit the regression model first with demographic predictors only and then with social–psychological predictors only. Results show that social–psychological variables predicted intention to engage in energy curtailment behaviors far better (adjusted R2 = 0.49) than demographics did (adjusted R2 = 0.02). In the model with demographic variables only, income and education level emerged as significant predictors of intention. Higher income was negatively associated with energy-saving intention (p < 0.001), while higher education level was positively associated (p < 0.001). In the model with social–psychological variables only, the results were unchanged from the entire model. Supplementary Table A3 in Supplementary Appendix presents the detailed results.
4 Policy implications and conclusion
Our investigation has shed light on the crucial factors influencing the intention to engage in electricity curtailment behaviors and the level of financial incentives residential energy consumers need to participate in voluntary DR behaviors. Additionally, we focused on the influence of social–psychological factors, demographics, and household characteristics on DR behavior acceptance. Three crucial lessons for DR research, utility companies, and policymakers are discussed below.
First, in agreement with the literature discussed earlier, we found that people do not behave consistently, and a significant fraction of residents varied their responses for each DR program. Therefore, the implementation of DR programs should not only differentiate customers concerning their demographics, social–psychological factors, and household characteristics but also make adjustments for the specific type of DR program itself. Utility companies should investigate customers’ attitudes and significant barriers to DR acceptance.
The reasons behind residents’ decisions not to participate in DR programs are noteworthy; current energy practices and personal needs are most important, which can provide insights for utility companies and policymakers to design practical DR and energy-saving programs based on personalized needs. In particular, this study investigated why incentives do not matter to particular residents by comparing the most responsive group (i.e., those who accepted DR without any incentive) and the non-responsive group (i.e., those who rejected DR regardless of incentive levels). While saving money appears to be the most frequently reported reason to participate in the A/C DR behaviors by the most responsive group, personal values and energy-saving habits are also important. Interestingly, the people who did not ask for extra rewards still appeared to care about saving money. A possible explanation is, according to the mental accounting theory in behavioral economics, that people allocate money into different accounts according to its sources, purposes, etc.; therefore, the money that one owns and the money that one can hold in the future is treated differently (Thaler, 2011; Shavit, 2012). Understanding the effects of incentives on less restricted customers, perhaps by identifying them using their typical home temperature settings, would provide more precise signals of who may respond to financial incentives better.
Second, demographic variables alone cannot adequately account for the variances in the incentives needed to participate in DR programs or general energy use curtailment behaviors. For example, the R2s across all models showed that only contain demographic predictors are less than 5%. In contrast, social–psychological variables (i.e., the variables in the extended TPB model) explained nearly half of the variance in curtailment intention and about 10% of the variance in incentives needed to raise A/C thermostat settings in summer, which greatly outperforms the demographic variables. This finding suggests that the traditional approach of providing financial incentives to the demographic sector perceived to be most responsive (e.g., LIHs) is not likely to be very effective. Instead, utility companies and other organizations need to pay more attention to developing and disseminating DR-promoting and energy-saving messages based on the customers’ social–psychological characteristics.
Regarding the relationships between individual predictors and our outcome variables, we found that older consumers need higher incentives to raise A/C thermostat settings when someone is home and shift the use of washers and dryers to off-peak hours. This study also found that having lower income and higher education are associated with higher energy curtailment intention. Dwelling size, often associated with household energy use, did not play a role in any predictive models. These findings confirm that the demographic variables important for household energy consumption are not necessarily crucial for energy-saving intention (Abrahamse and Steg, 2009) or DR participation. Previous research also failed to find significant relationships between demographics and DR interest (Fell et al., 2015a). Among social–psychological variables, residents’ thermal comfort needs are highly relevant to how they react to A/C-related DR programs; people with higher thermal comfort needs tend to request higher rewards, and this factor dominates all other variables in both A/C models.
Third, the extended TPB model performs much better in predicting general energy curtailment intention than in predicting incentives needed to participate in DR programs (Chen, 2016; Chen et al., 2017a). One possible explanation is that financial incentives are a proxy measure for consumer DR participation intention. In contrast, a more direct measure of actual DR adoption could boost the predictive power. However, we believe it is more likely that some important factors contributing to DR interest and/or adoption intention are overlooked in traditional models like the TPB. Therefore, for future studies, a framework that contains more social–psychological variables (e.g., trust in utilities) relating to specific DR programs and measures residents’ experiences and familiarity with DR programs may be able to predict DR adoption more accurately.
Our findings also point to future investigations that are likely to produce valuable results or close existing gaps in knowledge. Future research in DR and energy should explore the effects of climate zones and other demographics (e.g., ethnic background and political orientation) and household characteristics (e.g., household size and the presence of seniors or young children). In particular, future research should investigate residents’ flexibility in responding to DR behaviors. Additionally, it is important to improve DR research methodology; studies from large-scale randomized controlled field experiments with representative samples are necessary to ensure that the observed effects are due to the implementation of DR programs (either electricity price- or incentive-based) and are not results of other energy saving programs or policies (Vassileva et al., 2012b). This work will serve as a platform to continue the essential conversation on the relative impact of financial or behavioral incentives and inspire further applications to a wide range of energy behaviors and policies. More importantly, improving energy justice issues through DR and other energy efficiency programs among vulnerable populations (e.g., LIHs, older adults, or people with disabilities) is essential for future work.
Data availability statement
The datasets presented in this article are not readily available because the study involves human subjects. Requests to access the datasets should be directed to cchen26@utk.edu.
Ethics statement
This study involving human participants was reviewed and approved by the Institutional Review Board (IRB) at the University of Tennessee, Knoxville, U.S.A. to confirm the study meets national guidelines for research on humans. The participants provided their written informed content prior to participate in this study.
Author contributions
CC designed the study, wrote the literature review, and reviewed the data analysis. XX conducted data analysis and wrote the results. AM contributed to data analysis and edited the paper. ZC helped in literature review, graphs and tables, and overall writing, and QS helped in revising the results and literature review.
Conflict of interest
The authors declare that the research was conducted in the absence of any commercial or financial relationships that could be construed as a potential conflict of interest.
Publisher’s note
All claims expressed in this article are solely those of the authors and do not necessarily represent those of their affiliated organizations, or those of the publisher, the editors, and the reviewers. Any product that may be evaluated in this article, or claim that may be made by its manufacturer, is not guaranteed or endorsed by the publisher.
Supplementary material
The Supplementary Material for this article can be found online at: https://www.frontiersin.org/articles/10.3389/fenrg.2023.932134/full#supplementary-material
Footnotes
1Quartiles divide the observations into four groups of equal size based on the value of the variable.
References
Abrahamse, W., and Steg, L. (2009). How do socio-demographic and psychological factors relate to households' direct and indirect energy use and savings? J. Econ. Psychol. 30 (5), 711–720. doi:10.1016/j.joep.2009.05.006
Ajzen, I. (1991). The theory of planned behavior, organizational behavior and human decision processes. J. Leis. Res. 50 (2), 176–211.
Ali, M., Safdarian, A., and Lehtonen, M. (2014). “Demand response potential of residential HVAC loads considering users preferences,” in IEEE PES innovative smart grid technologies (Europe).
Asadinejad, A., Rahimpour, A., Tomsovic, K., Qi, H., and Chen, C. f. (2018). Evaluation of residential customer elasticity for incentive based demand response programs. Electr. Power Syst. Res. 158, 26–36. doi:10.1016/j.epsr.2017.12.017
Asensio, O. I., and Delmas, M. A. (2016). The dynamics of behavior change: Evidence from energy conservation. J. Econ. Behav. Organ. 126, 196–212. doi:10.1016/j.jebo.2016.03.012
Axsen, J., Bailey, J., and Castro, M. A. (2015). Preference and lifestyle heterogeneity among potential plug-in electric vehicle buyers. Energy Econ. 50, 190–201. doi:10.1016/j.eneco.2015.05.003
Bamberg, S. (2003). How does environmental concern influence specific environmentally related behaviors? A new answer to an old question. J. Environ. Psychol. 23 (1), 21–32. doi:10.1016/s0272-4944(02)00078-6
Buhrmester, M., Kwang, T., and Gosling, S. D. (2011). Amazon's mechanical Turk: A new source of inexpensive, yet high-quality, data? Perspect. Psychol. 6 (1), 3–5. doi:10.1177/1745691610393980
Carmichael, R., Gross, R., Hanna, R., Rhodes, A., and Green, T. (2021). The Demand Response Technology Cluster: Accelerating UK residential consumer engagement with time-of-use tariffs, electric vehicles and smart meters via digital comparison tools. Renew. Sustain. Energy Rev. 139, 110701. doi:10.1016/j.rser.2020.110701
Chatzivasileiadi, A., Ampatzi, E., and Knight, I. P. (2017). The implications of demand response measures and electrification of transport on UK household energy demand and consumption. Energy Procedia 134, 89–98. doi:10.1016/j.egypro.2017.09.530
Chen, C.-f., Wang, Y., Adua, L., and Bai, H. (2020). Reducing fossil fuel consumption in the household sector by enabling technology and behavior. Energy Res. Soc. Sci. 60, 101402. doi:10.1016/j.erss.2019.101402
Chen, C.-F., Xu, X., Adams, J., Brannon, J., Li, F., and Walzem, A. (2020). When East meets West: Understanding residents’ home energy management system adoption intention and willingness to pay in Japan and the United States. Energy Res. Soc. Sci. 69, 101616. doi:10.1016/j.erss.2020.101616
Chen, C.-f., Xu, X., and Day, J. K. (2017). Thermal comfort or money saving? Exploring intentions to conserve energy among low-income households in the United States. Energy Res. Soc. Sci. 26, 61–71. doi:10.1016/j.erss.2017.01.009
Chen, C.-f., Xu, X., and Frey, S. (2016). Who wants solar water heaters and alternative fuel vehicles? Assessing social–psychological predictors of adoption intention and policy support in China. Energy Res. Soc. Sci. 15, 1–11. doi:10.1016/j.erss.2016.02.006
Chen, C. F., Nelson, H., Xu, X., Bonilla, G., and Jones, N. (2021). Beyond technology adoption: Examining home energy management systems, energy burdens and climate change perceptions during COVID-19 pandemic. Renew. Sustain. Energy Rev. 145, 111066. doi:10.1016/j.rser.2021.111066
Chen, C. F., Xu, X., and Arpan, L. (2017). Between the technology acceptance model and sustainable energy technology acceptance model: Investigating smart meter acceptance in the United States. Energy Res. Soc. Sci. 25, 93–104. doi:10.1016/j.erss.2016.12.011
Chen, M.-F. (2016). Extending the theory of planned behavior model to explain people's energy savings and carbon reduction behavioral intentions to mitigate climate change in Taiwan–moral obligation matters. J. Clean. Prod. 112, 1746–1753. doi:10.1016/j.jclepro.2015.07.043
Chen, X., Hu, Q., Shi, Q., Quan, X., Wu, Z., and Li, F. (2020). Residential HVAC aggregation based on risk-averse multi-armed bandit learning for secondary frequency regulation. J. Mod. Power Syst. Clean Energy 8 (6), 1160–1167. doi:10.35833/mpce.2020.000573
Conradie, P. D., De Ruyck, O., Saldien, J., and Ponnet, K. (2021). Who wants to join a renewable energy community in flanders? Applying an extended model of theory of planned behaviour to understand intent to participate. Energy Policy 151, 112121. doi:10.1016/j.enpol.2020.112121
Delavari, A., and Kamwa, I. (2018). Improved optimal decentralized load modulation for power system primary frequency regulation. IEEE Trans. Power Syst. 33 (1), 1013–1025. doi:10.1109/tpwrs.2017.2708058
Delmas, M. A., Fischlein, M., and Asensio, O. I. (2013). Information strategies and energy conservation behavior: A meta-analysis of experimental studies from 1975 to 2012. Energy Policy 61, 729–739. doi:10.1016/j.enpol.2013.05.109
Deng, R., Yang, Z., Chow, M. Y., and Chen, J. (2015). A survey on demand response in smart grids: Mathematical models and approaches. IEEE Trans. Industrial Inf. 11 (3), 570–582. doi:10.1109/tii.2015.2414719
Dowlatabadi, H., and Wilson, C. (2018). Models of decision making and residential energy use. Renewable Energy.
Energy Consumption (2022). Residential, commercial, and industrial sectors. Washington, DC: U.S. Energy Information Administration.
Falaki, F., Merabtine, A., and Martouzet, D. (2021). A Spatio-Temporal Analysis of electric appliance end-use demand in the residential sector: Case study of Tours (France). Sustain. Cities Soc. 65, 102635. doi:10.1016/j.scs.2020.102635
Fang, X., Hu, Q., Li, F., Wang, B., and Li, Y. (2016). Coupon-based demand response considering wind power uncertainty: A strategic bidding model for load serving entities. IEEE Trans. Power Syst. 31 (2), 1025–1037. doi:10.1109/tpwrs.2015.2431271
Fell, M., Nicolson, M., Huebner, G., and Shipworth, D. (2015a). Is it time? Consumers and time of use tariffs.
Fell, M., Shipworth, D., Huebner, G., and Elwell, C. A. (2015b). “Knowing Me, Knowing You: The role of trust, locus of control and privacy concern in acceptance of domestic electricity demand-side response,” in Eceee 2015 Summer Study on energy efficiency.
Fonseca, da, Chvatal, K. M. S., and Fernandes, R. A. S. (2021). Thermal comfort maintenance in demand response programs: A critical review. Renew. Sustain. Energy Rev. 141, 110847. doi:10.1016/j.rser.2021.110847
Francis, M. (2021). Per capita U.S. residential electricity use was flat in 2020, but varied by state. August 6 Available at: https://www.eia.gov/todayinenergy/detail.php?id=49036.
Frederiks, E. R., Stenner, K., and Hobman, E. V. (2015). Household energy use: Applying behavioural economics to understand consumer decision-making and behaviour. Renew. Sustain. Energy Rev. 41, 1385–1394. doi:10.1016/j.rser.2014.09.026
Frederiks, E., Stenner, Karen, and Hobman, Elizabeth (2015). The socio-demographic and psychological predictors of residential energy consumption: A comprehensive review. Energies 8 (1), 19961073573–19961073609. doi:10.3390/en8010573
Fu, W., Zhou, Y., Li, L., and Yang, R. (2021). Understanding household electricity-saving behavior: Exploring the effects of perception and cognition factors. Sustain. Prod. Consum. 28, 116–128. doi:10.1016/j.spc.2021.03.035
Gao, J., Ma, Z., and Guo, F. (2019). The influence of demand response on wind-integrated power system considering participation of the demand side. Energy 178, 723–738. doi:10.1016/j.energy.2019.04.104
Geels, F. W., Sovacool, B. K., and Sorrell, S. (2020). “Of emergence diffusion and impact: A sociotechnical perspective on researching energy demand,” in Transitions in energy efficiency and demand: The emergence diffusion and impact of low carbon innovation, 15–33.
Good, N. (2019). Using behavioural economic theory in modelling of demand response. Appl. Energy 239, 107–116. doi:10.1016/j.apenergy.2019.01.158
Guagnano, G. A., Stern, P. C., and Dietz, T. (1995). Influences on attitude-behavior relationships: A natural experiment with curbside recycling. Environ. Behav. 27 (5), 699–718. doi:10.1177/0013916595275005
Gyamfi, S., Krumdieck, S., and Urmee, T. (2013). Residential peak electricity demand response—highlights of some behavioural issues. Renew. Sustain. Energy Rev. 25, 71–77. doi:10.1016/j.rser.2013.04.006
Hayn, M., Bertsch, V., and Fichtner, W. (2014). Electricity load profiles in Europe: The importance of household segmentation. Energy Res. Soc. Sci. 3, 30–45. doi:10.1016/j.erss.2014.07.002
Hu, M., Xiao, F., and Wang, S. (2021). Neighborhood-level coordination and negotiation techniques for managing demand-side flexibility in residential microgrids. Renew. Sustain. Energy Rev. 135, 110248. doi:10.1016/j.rser.2020.110248
Hu, Q. (2015). An approach to assess the responsive residential demand to financial incentives. In IEEE Power and Energy Society General Meeting.
Hu, Q., Li, F., Fang, X., and Bai, L. (2018). A framework of residential demand aggregation with financial incentives. IEEE Trans. Smart Grid 9 (1), 497–505. doi:10.1109/tsg.2016.2631083
Huebner, G., Shipworth, D., Hamilton, I., Chalabi, Z., and Oreszczyn, T. (2016). Understanding electricity consumption: A comparative contribution of building factors, socio-demographics, appliances, behaviours and attitudes. Appl. Energy 177, 692–702. doi:10.1016/j.apenergy.2016.04.075
Ji, W., and Chan, E. H. W. (2020). Between users, functions, and evaluations: Exploring the social acceptance of smart energy homes in China. Energy Res. Soc. Sci. 69, 101637. doi:10.1016/j.erss.2020.101637
Kobus, C. B. A., Klaassen, E. A., Mugge, R., and Schoormans, J. P. (2015). A real-life assessment on the effect of smart appliances for shifting households’ electricity demand. Appl. Energy 147, 335–343. doi:10.1016/j.apenergy.2015.01.073
Lake, C. (2010). PJM empirical analysis of demand response baseline methods. Available at: http://www.pjm.com/.
Lee, M., Aslam, O., Foster, B., Kathan, D., Kwok, J., and Medearis, L. (2012). Assessment of demand response and advanced metering: Staff report. Washington, DC, Washington: Federal Energy Regulatory Commission, 120.
Li, W., Long, R., Chen, H., and Geng, J. (2017). A review of factors influencing consumer intentions to adopt battery electric vehicles. Renew. Sustain. Energy Rev. 78, 318–328. doi:10.1016/j.rser.2017.04.076
Li, X., Zhang, D., Zhang, T., Ji, Q., and Lucey, B. (2021). Awareness, energy consumption and pro-environmental choices of Chinese households. J. Clean. Prod. 279, 123734. doi:10.1016/j.jclepro.2020.123734
Lin, J., Dong, J., Liu, D., Zhang, Y., Ma, T., Lund, H., et al. (2022). From peak shedding to low-carbon transitions: Customer psychological factors in demand response.
Linda, S., Goda, P., and Ellen, V. (2015). Understanding the human dimensions of a sustainable energy transition. Front. Psychol. 6, 805. doi:10.3389/fpsyg.2015.00805
Maki, A., Burns, R. J., and Rothman, A. J. (2016). Paying people to protect the environment: A meta-analysis of financial incentive interventions to promote proenvironmental behaviors. J. Environ. Psychol. 47, 242–255. doi:10.1016/j.jenvp.2016.07.006
Mohseni, A., Mortazavi, S. S., Ghasemi, A., Nahavandi, A., and Talaei abdi, M. (2017). The application of household appliances' flexibility by set of sequential uninterruptible energy phases model in the day-ahead planning of a residential microgrid. Energy 139, 315–328. doi:10.1016/j.energy.2017.07.149
Moreira, C., Tiwari, P., Pandey, H. M., Bruza, P., and Wichert, A. (2020). Quantum-like influence diagrams for decision-making. Neural Netw. 132, 190–210. doi:10.1016/j.neunet.2020.07.009
Nicolson, M., Huebner, G., and Shipworth, D. (2017). Are consumers willing to switch to smart time of use electricity tariffs? The importance of loss-aversion and electric vehicle ownership. Energy Res. Soc. Sci. 23, 82–96. doi:10.1016/j.erss.2016.12.001
Nolan, S., and O’Malley, M. (2015). Challenges and barriers to demand response deployment and evaluation. Appl. Energy 152, 1–10. doi:10.1016/j.apenergy.2015.04.083
O'Connell, S., Reynders, G., and Keane, M. M. (2021). Impact of source variability on flexibility for demand response. Energy 237, 121612. doi:10.1016/j.energy.2021.121612
Oreg, S., and Katz-Gerro, T. (2006). Predicting proenvironmental behavior cross-nationally: Values, the theory of planned behavior, and value-belief-norm theory. Environ. Behav. 38 (4), 462–483. doi:10.1177/0013916505286012
Orths, A., Anderson, C. L., Brown, T., Mulhern, J., Pudjianto, D., Ernst, B., et al. (2019). Flexibility from energy systems integration: Supporting synergies among sectors. IEEE Power Energy Mag. 17 (6), 67–78. doi:10.1109/mpe.2019.2931054
Pallonetto, F., De Rosa, M., D’Ettorre, F., and Finn, D. P. (2020). On the assessment and control optimisation of demand response programs in residential buildings. Renew. Sustain. Energy Rev. 127, 109861. doi:10.1016/j.rser.2020.109861
Parker, D. S., Mazzara, M., and Sherwin, J. R. (1996). “Monitored energy use patterns in low-income housing in a hot and humid climate,” in Symposium on improving building systems in hot and humid climates.
Perez, K. X., Baldea, M., and Edgar, T. F. (2016). Integrated HVAC management and optimal scheduling of smart appliances for community peak load reduction. Energy Build. 123, 34–40. doi:10.1016/j.enbuild.2016.04.003
Rathi, S. S., and Chunekar, A. (2015). Not to buy or can be ‘nudged’ to buy? Exploring behavioral interventions for energy policy in India. Energy Res. Soc. Sci. 7, 78–83. doi:10.1016/j.erss.2015.03.006
Ryan, E. L. D. R. K. R. M., Koestner, R., and Ryan, R. M. (1999). The undermining effect is a reality after all—extrinsic rewards, task interest, and self-determination: Reply to eisenberger, pierce, and cameron (1999) and lepper, henderlong, and gingras (1999). Psychol. Bull. 125 (6), 692–700. doi:10.1037/0033-2909.125.6.692
Sadeghianpourhamami, N., Demeester, T., Benoit, D., Strobbe, M., and Develder, C. (2016). Modeling and analysis of residential flexibility: Timing of white good usage. Appl. Energy 179, 790–805. doi:10.1016/j.apenergy.2016.07.012
Sharda, S., Singh, M., and Sharma, K. (2021). Demand side management through load shifting in IoT based HEMS: Overview, challenges and opportunities. Sustain. Cities Soc. 65, 102517. doi:10.1016/j.scs.2020.102517
Shavit, M. R. (2012). Whose money is it anyway? Using prepaid incentives in experimental economics to create a natural environment. Experimental Economics.
Shen, M., Lu, Y., Wei, K. H., and Cui, Q. (2020). Prediction of household electricity consumption and effectiveness of concerted intervention strategies based on occupant behaviour and personality traits. Renew. Sustain. Energy Rev. 127, 109839. doi:10.1016/j.rser.2020.109839
Shen, Y., Li, Y., Zhang, Q., Shi, Q., and Li, F. (2020). State-shift priority based progressive load control of residential HVAC units for frequency regulation. Electr. Power Syst. Res. 182, 106194. doi:10.1016/j.epsr.2020.106194
Siano, P. (2014). Demand response and smart grids—a survey. Renew. Sustain. Energy Rev. 30, 461–478. doi:10.1016/j.rser.2013.10.022
Stenner, K., Frederiks, E. R., Hobman, E. V., and Cook, S. (2017). Willingness to participate in direct load control: The role of consumer distrust. Appl. Energy 189, 76–88. doi:10.1016/j.apenergy.2016.10.099
Stern, P. C., Aronson, E., Darley, J. M., Hill, D. H., Hirst, E., Kempton, W., et al. (1986). The effectiveness of incentives for residential energy conservation. Eval. Rev. 10 (2), 147–176. doi:10.1177/0193841x8601000201
Steward, D. M. (2017). in Critical elements of vehicle-to-grid (v2g) economics (Golden, CO (United States): N.R.E. Lab).
Strengers, Y. (2010). Air-conditioning Australian households: The impact of dynamic peak pricing. Energy Policy 38 (11), 7312–7322. doi:10.1016/j.enpol.2010.08.006
Strengers, Y. (2012). Peak electricity demand and social practice theories: Reframing the role of change agents in the energy sector. Energy Policy 44, 226–234. doi:10.1016/j.enpol.2012.01.046
Thaler, R. H., and Sunstein, C. R. (2008). Nudge: Improving decisions about health, wealth and happiness.
US Energy Initiatives Corp Inc Common Stock (2018). in How is electricity used in U.S. homes? (U.S.E.I. Administration).
Vandenbergh, M. P., and Gilligan, J. M. (2017). Beyond politics: The private governance response to climate change. Beyond Polit. Private Gov. Response Clim. Change, 1–467.
Vassileva, I., Wallin, F., and Dahlquist, E. (2012). Analytical comparison between electricity consumption and behavioral characteristics of Swedish households in rented apartments. Appl. Energy 90 (1), 182–188. doi:10.1016/j.apenergy.2011.05.031
Vassileva, I., Wallin, F., and Dahlquist, E. (2012). Understanding energy consumption behavior for future demand response strategy development. Energy 46 (1), 94–100. doi:10.1016/j.energy.2012.02.069
Wang, B., Deng, N., Li, H., Zhao, W., Liu, J., and Wang, Z. (2021). Effect and mechanism of monetary incentives and moral suasion on residential peak-hour electricity usage. Technol. Forecast. Soc. Change 169, 120792. doi:10.1016/j.techfore.2021.120792
Wang, N., Zhang, J., and Xia, X. (2013). Energy consumption of air conditioners at different temperature set points. Energy Build. 65, 412–418. doi:10.1016/j.enbuild.2013.06.011
Wang, S., Fan, J., Zhao, D., Yang, S., and Fu, Y. (2016). Predicting consumers' intention to adopt hybrid electric vehicles: Using an extended version of the theory of planned behavior model. Transportation 43 (1), 123–143. doi:10.1007/s11116-014-9567-9
Wang, T., Shen, B., Han Springer, C., and Hou, J. (2021). What prevents us from taking low-carbon actions? A comprehensive review of influencing factors affecting low-carbon behaviors. Energy Res. Soc. Sci. 71, 101844. doi:10.1016/j.erss.2020.101844
Wolske, K. S., Stern, P. C., and Dietz, T. (2017). Explaining interest in adopting residential solar photovoltaic systems in the United States: Toward an integration of behavioral theories. Energy Res. Soc. Sci. 25, 134–151. doi:10.1016/j.erss.2016.12.023
Xu, X., Arpan, L. M., and Chen, C.-f. (2015). The moderating role of individual differences in responses to benefit and temporal framing of messages promoting residential energy saving. J. Environ. Psychol. 44, 95–108. doi:10.1016/j.jenvp.2015.09.004
Xu, X., Chen, C. f., Zhu, X., and Hu, Q. (2018). Promoting acceptance of direct load control programs in the United States: Financial incentive versus control option. Energy 147, 1278–1287. doi:10.1016/j.energy.2018.01.028
Keywords: demand response, power systems, theory of planned behavior, intention to save energy, residential energy, thermal comfort
Citation: Chen C-f, Xu X, Cao Z, Mockus A and Shi Q (2023) Analysis of social–Psychological factors and financial incentives in demand response and residential energy behavior. Front. Energy Res. 11:932134. doi: 10.3389/fenrg.2023.932134
Received: 03 May 2022; Accepted: 30 January 2023;
Published: 23 February 2023.
Edited by:
Ningyi Dai, University of Macau, ChinaCopyright © 2023 Chen, Xu, Cao, Mockus and Shi. This is an open-access article distributed under the terms of the Creative Commons Attribution License (CC BY). The use, distribution or reproduction in other forums is permitted, provided the original author(s) and the copyright owner(s) are credited and that the original publication in this journal is cited, in accordance with accepted academic practice. No use, distribution or reproduction is permitted which does not comply with these terms.
*Correspondence: Chien-fei Chen, Y2NoZW4yNkB1dGsuZWR1