 He Lei
 Li Rufeng
 Tang Baofeng
 Zhou Kaifeng
95% of researchers rate our articles as excellent or good
Learn more about the work of our research integrity team to safeguard the quality of each article we publish.
Find out more
ORIGINAL RESEARCH article
Front. Energy Res. , 08 January 2024
Sec. Sustainable Energy Systems
Volume 11 - 2023 | https://doi.org/10.3389/fenrg.2023.1345840
This article is part of the Research Topic Low-Carbon Oriented Improvement Strategy for Flexibility and Resiliency of Multi-Energy Systems View all 24 articles
The assessment of the health status and prediction of the lifespan of cable equipment are critical for ensuring the stability and efficiency of the power grid. This paper develops a temperature-current-capacity-life calculation model for cables, considering the fast and slow charging demands of electric vehicles (EVs). Analyses under scenarios of rapid and slow charging demands are conducted, introducing a cable health index and establishing a health status assessment framework based on this index. The framework accounts for various factors leading to cable faults, offering a comprehensive evaluation of the health status of cables with different fault rates. Building upon this, a prediction method using the Fire Hawk Optimization (FHO) Algorithm and Convolutional Neural Network (CNN) is proposed. This method enhances performance by optimizing the hyperparameters of Bidirectional Gated Recurrent Unit (BiGRU) through FHO, effectively searching and determining the optimal hyperparameter configuration. The impact of different scenarios and varying EV penetration rates on cable temperature is analyzed through case studies, facilitating the assessment and prediction of health status.
As modern society’s reliance on electricity intensifies, cables, being an indispensable component of the power grid, play a pivotal role in ensuring the safety and reliability of the entire electrical system (Rajendran et al., 2021). The escalating demand for electric vehicle (EV) charging, especially the high current requirements of direct current fast charging, raises challenges for cable equipment, leading to increased cable temperatures (Gupta et al., 2021). This not only impacts their performance and lifespan but also poses potential safety hazards. Moreover, cable equipment is subject to various internal and external factors such as aging, climate change, and operational stress, leading to potential performance deterioration over time (Hossain et al., 2021). Therefore, the health assessment and prediction of cable equipment’s status are of paramount importance.
Cables are designed with a lifespan of approximately 40 years, predominantly affected by thermal aging and electrical aging (Li et al., 2007). Thermal aging suggests that a cable’s lifespan is mainly influenced by load rate, insulation material properties, and ambient temperature, whereas electrical aging posits that a cable’s expected lifespan is inversely proportional to insulation field strength, as proven in relevant studies. Research documented in (Nemati et al., 2019) utilizes the Weibull parametric proportional hazard model to estimate the failure rate of each cable based on its years of usage and a set of explanatory factors (Dinmohammadi et al., 2019). proposes a lifespan prediction model for submarine cables under specific seabed conditions and tidal flows, predicting the expected lifespan of cables affected by erosion and wear. Further (Montanari et al., 2019), assesses the insulation condition of electrical equipment as a function of operating time, evaluating the feasibility and scope of maintenance measures and life extension plans based on aging and life models (Wang et al., 2019). examines the impact of EV charging loads on the temperature and thermal life of distribution network cables, focusing on the harmonic characteristics of 3.3 kW and 6.6 kW AC slow charging under peak and off-peak scenarios. However, in the context of dual carbon goals, the continuous increase in EV ownership, reaching 18.21 million in China by September 2023, and the establishment of DC fast charging and even Chaoji fast charging standards, allowing charging powers up to an astonishing 900 kW, impose higher current loads on cables (Yu et al., 2022). Excessive current loads can lead to overheating and material degradation, reducing the efficiency and reliability of cables (Li and Li, 2017). Research in this specific area is not yet comprehensive, and the lifespan prediction of operational cables needs to consider stochastic characteristics, including faults due to defects, external damage, and environmental factors.
In the realm of cable equipment health monitoring and lifespan prediction, numerous domestic and international researchers have pioneered a variety of innovative methods, broadly categorized into model-based predictions and data-based predictions (Liao and Kottig, 2014). Model-based predictions focus on in-depth analysis of cable equipment’s structure and material properties, often involving complex fault mechanism mathematical models (Ahmad et al., 2022). However, due to their high complexity, the practical application of these methods is somewhat limited. On the other hand, data-based prediction methods do not require an in-depth understanding of mechanisms; instead, they assess the health and predict the lifespan of equipment by analyzing data and measurement parameters collected by sensors. These methods are further divided into statistical methods and machine learning methods (Carvalho et al., 2019). Traditional machine learning methods, such as Support Vector Machine (SVM) (Yan et al., 2020) and Random Forest (RF) (Gan et al., 2022), are favored for their flexibility and efficiency in extracting shallow features for health assessment and lifespan prediction. The latest research trend is employing deep learning technologies, particularly CNN and Recurrent Neural Networks (RNN) (Han et al., 2021), to process cable data, aiming to enhance prediction accuracy and robustness. The application of deep learning in cable equipment’s lifespan prediction and health status assessment mainly encompasses Deep Belief Networks (DBN) (Peng et al., 2019), Long Short-Term Memory networks (LSTM) (Zhang et al., 2018), Gated Recurrent Units (GRU) (Luo et al., 2020), CNN, Graph Neural Networks (GNN) (Kong et al., 2022), and Transfer Learning (TL) (Zhang et al., 2021). These cutting-edge studies are continually advancing the monitoring and lifespan prediction technologies for cable equipment.
This paper introduces an innovative approach for assessing and predicting the health status of cables in the context of large-scale electric vehicle (EV) charging loads. The key contributions of this study are summarized as follows:
(1) Development of a cable temperature-current-capacity-life calculation model. This model conducts a comprehensive analysis of both rapid and slow charging scenarios and explores through case studies the impact of different charging scenarios and EV penetration rates on cable temperature. This offers new perspectives and solutions for cable management in EV charging facilities.
(2) Introduction of the concept of a Cable Health Index and the construction of a cable health status assessment framework based on this index. Taking into account various factors that could lead to cable faults, this framework allows for a comprehensive health assessment of cables with different fault rates, significantly enhancing the safety and efficiency of cable usage.
(3) Proposal of a predictive method that combines the FHO Algorithm with a CNN. This method uses the FHO algorithm to optimize the hyperparameters of the BiGRU, enhancing predictive performance. It effectively searches and determines the optimal hyperparameter configuration, enabling precise assessment and prediction of cable health status.
The remainder of the paper is organized as follows: Section 2 constructs the cable model considering EV charging demands and analyzes rapid and slow charging requirements. Section 3 presents a deep learning-based method for predicting the health status of cable equipment. Section 4 offers simulation results and discusses the outcomes of the tests. Finally, Section 5 concludes the study.
The historical data of cables include operational years and routine inspections. As operational years increase, the condition of the cables deteriorates. The lifecycle of a cable follows a “bathtub curve,” which can be divided into three phases: the early debugging period, the random failure period, and the wear-out period, as illustrated in Figure 1.
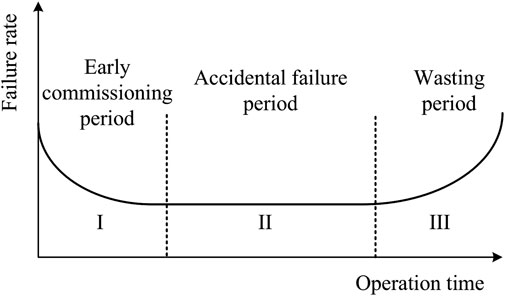
FIGURE 1. Bathtub curve of failure rates.
To quantify the impact of EV charging loads on cables, this paper constructs a cable equipment temperature-current-capacity-life calculation model, considering both rapid and slow EV charging demands.
Considering that the charging mode allows EVs to charge without exceeding the battery capacity and that the constant current process in a complete slow charging cycle is very short, the entire slow charging process is approximated as constant voltage charging. Assuming that the charging current for slow charging is 0.1C (C refers to battery capacity), the charging power Pc of a typical EV falls within the range of 2–3 kW and follows a uniform distribution, with its probability distribution function as (Eq. 1)
The time required for each EV’s slow charging is calculated as (Eq. 2)
Considering two types of slow charging modes: dispersed and centralized, this study focuses on dispersed slow charging for both pure electric and hybrid vehicles. Assuming that all slow-charging EVs finish their last daily trip and return to their parking spots at the time which marks the beginning of charging. Based on a survey of American household vehicles, the start time of charging is also approximated as a normal distribution, with the specific probability density function as (Eq. 3):
With the initial scale of EVs in the region, combining the EV driving mileage and charging start time, the remaining battery charge of each vehicle can be calculated.
In rapid charging mode, the initial phase of EV charging generally involves constant current charging, following an exponential distribution. When the battery is charged to 80% of its rated capacity, the process is as (Eq. 4):
For instance,
The extent of EV charging and battery swapping demand is primarily influenced by user behavior, battery capacity, and the technical level of charging equipment. At a certain stage of development, constrained by the level of technology, battery capacity and the power rating of charging equipment are generally fixed, hence EV charging and swapping demand mainly depends on daily driving mileage.
To obtain the daily load curve of EV charging and swapping, it is first necessary to know the daily driving mileage
Compared to the dispersed slow charging mode, the rapid charging mode sees a higher degree of charging demand, mainly affected by the power consumption during various time periods. This paper assumes that the distribution of start times for rapid charging is consistent with the swapping time distribution in the swapping mode. It is also assumed that when pure electric and hybrid EVs undergo rapid charging, the remaining battery charge follows a normal distribution of (0.4, 0.133), leading to a specific probability density function for the remaining battery capacity (Eq. 6).
The introduction of nonlinear loads by AC charging of EVs leads to the generation of harmonics. These harmonic signals affect both voltage and current, encompassing harmonic voltage and current. According to the definition by IEC 61000, these are represented as (Eq. 7) and (Eq. 8):
As per the IEC 60287 standard, the core temperature
The harmonic currents generated during the charging process of EVs can cause the total current carrying capacity of the cable to exceed its design value, potentially leading to overload and safety issues. The current carrying capacity of 10 kV three-core cable can be calculated using (Eq. 10)
The harmonic currents produced during the EV charging process cause additional heating in the cable, affecting its thermal life. The cable’s life per hour is given by (Eq. 11):
The daily life degradation of the cable is expressed as (Eq. 12):
Cable fault sample data follow a Weibull distribution with the sought parameters. Such a function can simulate various fault factors by selecting appropriate parameters and can also assess the systemic reliability when the cable fault rate dynamically changes. The mathematical model for cable fault rate is shown as (Eq. 13):
To account for the difference in cable fault rates before and after maintenance, this paper introduces an age regression factor
This allows for the determination of the fault rate after the k-th maintenance. As shown in (Eq. 15).
To avoid the issues of cable current carrying capacity overload and temperature rise caused by concentrated EV charging, this study proposes a data-driven and weighted Gaussian regression method for predicting the operational state of cable equipment. This approach utilizes CNN and LSTM networks to predict parameters of cable equipment, thereby enhancing the performance of Gaussian Process Regression (GPR), aiming to improve the accuracy of predicting parameters like cable temperature and current carrying capacity.
The proposed FHO-CNN-BIGRU method for predicting the operational state of cable equipment employs the CNN algorithm to mine data relationships and mitigate noise interference. The extracted features are then fed into a BiGRU model optimized by the FHO Algorithm for time series prediction, enhancing the stability of the forecasts. Additionally, this method incorporates a GPR filtering model to smooth the data using Gaussian process regression, thus improving data accuracy and reliability. The cable health status prediction flow chart is shown in Figure 2.
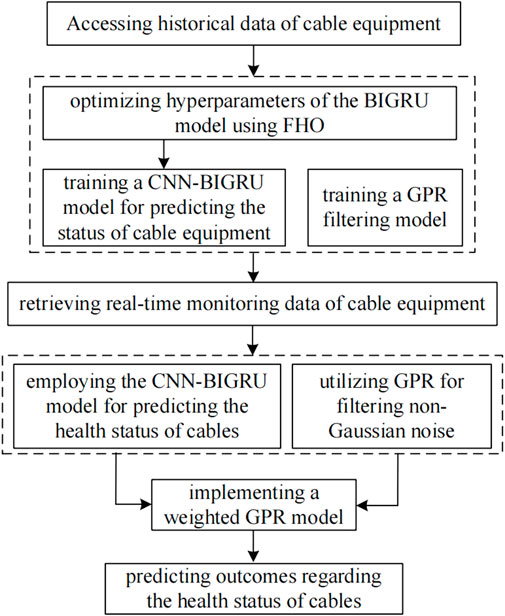
FIGURE 2. Flowchart for predicting cable health status.
The FHO algorithm is a meta-heuristic algorithm that simulates the foraging behavior of fire hawks, considering processes like setting fires, spreading, and capturing prey. Initially, several candidate solutions are determined as the location vectors of the fire hawks and prey, using a random initialization process as per the given formula to identify these vectors’ initial positions in the search space. As shown in (Eq. 16) and (Eq. 17).
The distance between a fire hawk
Then, positions are updated: fire hawk m collects burning sticks from the main fire and throws them into a specific area to force the prey to flee. The detailed process of updating positions can be referred to in the cited literature (Azizi et al., 2023).
Based on the solution process of the aforementioned FHO optimization algorithm, the steps to optimize the BiGRU model hyperparameters are as follows:
Step 1. Define the Hyperparameter Search Space. Identify the hyperparameters of the BiGRU model to be optimized and establish a range or a set of possible values for each hyperparameter.
Step 2. Initialize Solution Candidates. Generate initial solution candidates of hyperparameter combinations randomly, in accordance with the defined search space.
Step 3. Evaluate Initial Solution Candidates. Employ cross-validation or other suitable methods to train the model and assess the performance of the initial solution candidates, calculating their fitness values (such as accuracy, loss function values, etc.).
Step 4. Set the Global Optimum. Designate the best solution among the initial candidates as the global optimum.
Step 5. Iterative Optimization. Continuously update the hyperparameter combinations by generating falcons and prey. The distance between falcons and prey is computed, and territories of the falcons are determined. Falcons update their hyperparameter combinations based on their positions, and prey both within and outside the territories also update their combinations. By evaluating the fitness values of the updated hyperparameter combinations and updating the global optimum to the current best solution, the FHO algorithm progressively searches for improved hyperparameter combinations, thereby enhancing the BiGRU model’s performance through iterative optimization.
Step 6. Return the Global Optimum. Upon completion of the iterations, the global optimum is returned as the optimized set of hyperparameters for the BiGRU model.
Step 1. Data Preprocessing. Undertake preparatory processing of the monitoring data for cable equipment, involving data cleansing and normalization among other procedures, to ready the input data.
Step 2. Feature Extraction. Utilize a CNN to extract salient features from the cable equipment monitoring data, capturing key temporal sequence characteristics.
Step 3. Sequence Modeling. Employ a BiGRU to model the extracted time series features, considering both historical and prospective state information.
Step 4. Predictive Output. Utilize the terminal temporal step’s BiGRU hidden state as the vector representation of the equipment’s health status, and input this into a fully connected layer for the prediction of the health state.
Step 5. Model Optimization. Apply the FHO algorithm to refine hyperparameters such as the convolutional kernel size, GRU’s hidden unit count, learning rate, and other factors pertinent to model performance, thereby enhancing the accuracy of health status prediction.
Step 6. Model Evaluation. Assess the model’s performance using appropriate metrics (like accuracy, recall, F1 score, etc.), comparing it against the actual health states of the equipment.
Step 7. Health Status Prediction. Utilize the optimized FHO-CNN-BiGRU model to predict the health status of cable equipment based on new monitoring data, thus obtaining prognostications regarding the health state of the cable apparatus.
Combining the FHO-CNN-BiGRU prediction model, the GPR model is utilized for its superiority in handling nonlinear problems to obtain nonlinear mappings between measurements and state quantities. The integration of FHO-CNN-BiGRU and GPR algorithms allows for weighting the predicted values from FHO-CNN-BiGRU and the state estimates from GPR, leading to more accurate predictions of the cable equipment’s state.
The Gaussian Regression model maps input features to a high-dimensional space through a set of basis functions, denoted as
The GPR uses confidence judgment to estimate results, which can mitigate noise interference, thereby improving the accuracy of the estimates. Offline training is first conducted based on the nonlinear relationship between historical measurement and state data of cable equipment, followed by state prediction using the trained model based on new measurement data.
Aging and deterioration are phenomena that span the entire lifecycle of equipment. Cables, especially those operating in humid environments for extended periods, are prone to water tree aging. The operational state of the cable, maintenance strategies, construction quality, and operating environment significantly impact cable deterioration. Maintenance can enhance the performance of components and extend the equipment’s life to a certain extent, but it cannot restore the equipment to its original healthy state, as the rate of deterioration remains unchanged. Assessing the health status is an effective way to monitor the condition of cable equipment. Based on the cable status prediction results, this paper introduces the concept of a Cable Health Index and constructs a cable health status assessment framework based on this index. The cable health status assessment process, as illustrated in Figure 3, involves the following detailed steps:
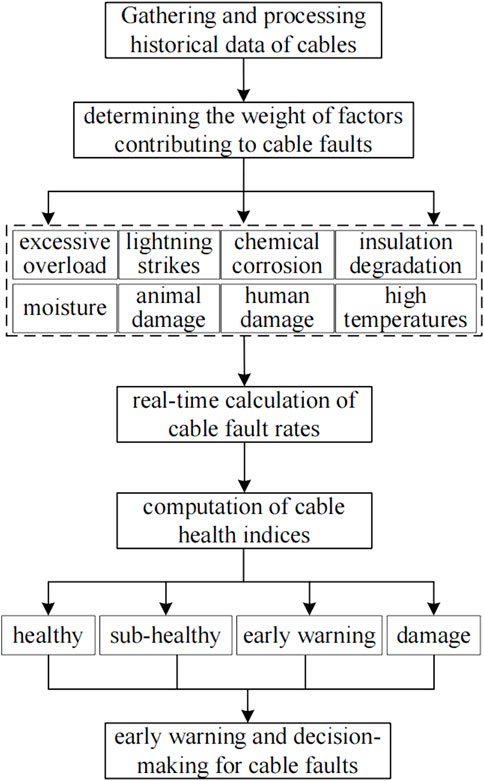
FIGURE 3. Cable fault early warning and decision-making process.
Step 1. Data Collection and Processing. Utilize distributed fiber optic sensors to collect relevant data of the cable, including its lifespan, insulation thermal resistance, and other parameters. Combine these with predicted parameters like current carrying capacity, temperature, and lifespan to construct a health status assessment dataset. Analyze and process the collected data, employing methods like Principal Component Analysis to remove redundant features and repair missing data.
Step 2. Determination of Cable Fault Factor Weights. Considering the operational conditions of the cable, use the Analytic Hierarchy Process to calculate the weights of factors that could potentially cause cable faults, obtaining the weight
Step 3. Calculation of Cable Fault Rate. Calculate the cable fault rate
Step 4. Calculation of Cable Health Index. Utilize the real-time fault rate to calculate the cable’s real-time health index
Step 5. Assessment of Cable Health Status. Based on the calculated real-time health index, assess the health status of the cable. Categorize the cable into different health statuses, including healthy, sub-healthy, early warning, and damaged, according to predefined standards and thresholds.
Step 6. Early Warning and Decision-Making. Set warning thresholds based on the real-time fault rate and health index. When the fault rate exceeds the threshold or the health index declines, the system can issue an alert, prompting maintenance personnel to take appropriate actions such as repair, replacement, or upgrade of the cable.
This paper focuses on a case study of a community with 2000 private EVs. For simplicity in the simulation, it is assumed that EVs charge at a constant power, with a battery capacity of 70 kWh. The study considers AC slow charging and DC fast charging, setting the ratio of fast to slow charging at 3:7. According to the standard charging modes defined in IEC61851-1, a 6.6 kW AC charging station for electric cars has a current of 32A, and a 35 kW DC charging station has a current of 160A. The temperature limit of XLPE cables is set at 90°C. Due to higher losses in AC cables under the same load conditions compared to DC cables, the temperature changes caused by fast charging are not considered initially. Figure 4 shows the typical daily load curve without considering EV charging, and Figure 5 presents the charging demand curves at different EV penetration rates.
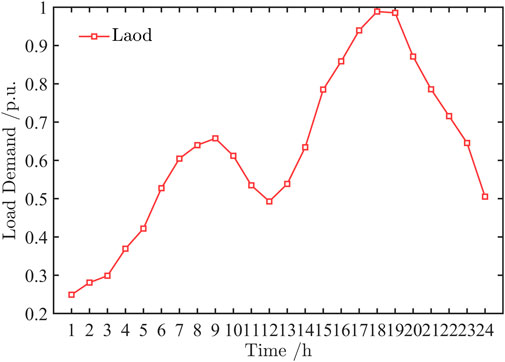
FIGURE 4. Daily residential electricity load profile.
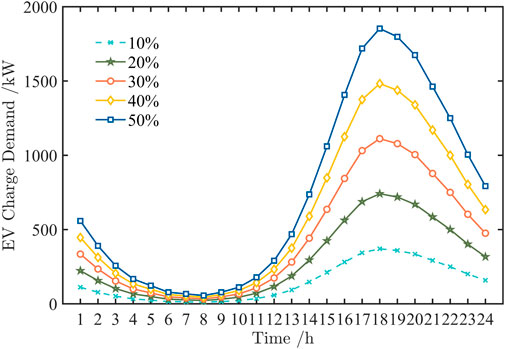
FIGURE 5. Charging demand at different EV penetration rates.
To assess the impact of different scales of EV integration on cable temperature rise, we analyzed cable temperatures under various charging demands, setting EV penetration rates at 0%, 10%, 20%, 30%, 40%, and 50%. The simulation tested the cable temperature variations in each scenario, as shown in Figure 6; Table 1.
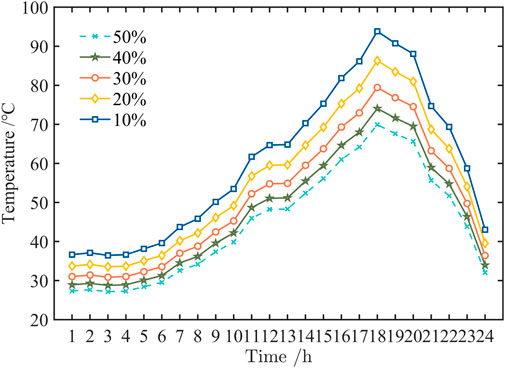
FIGURE 6. Cable temperature variations under different EV penetration rates.
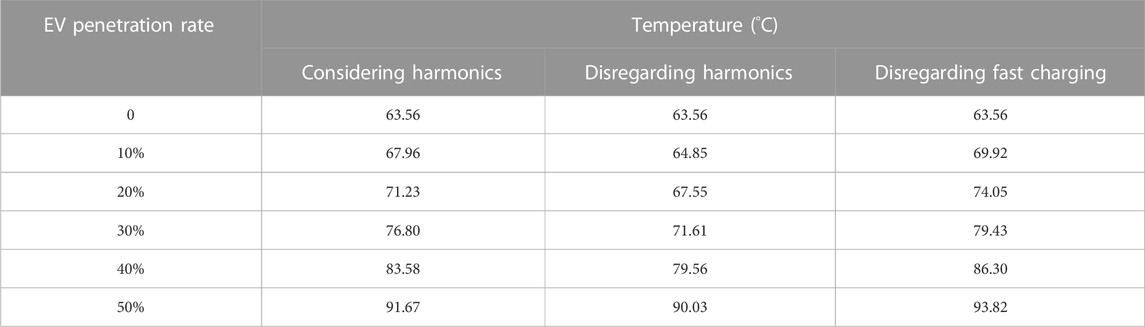
TABLE 1. Maximum cable temperatures at different EV penetration rates in various scenarios.
From Figure 6, it is evident that with the increase in the number of EVs, the rising charging demand leads to a continuous increase in cable temperature. Especially when the EV penetration rate reaches half of the total number of private cars in the community, the cable temperature exceeds the permissible limit. At peak demand times, the cable temperature reaches 91.67°C, exceeding the 90°C limit even without considering the impact of harmonics. Therefore, reducing harmonics and improving cable thermal management are crucial for the reliable operation of cables and the entire distribution system. Implementing rational orderly charging strategies or incentivizing users to charge during off-peak hours through time-of-use tariffs could mitigate the risk of cable current exceeding limits due to the cumulative demand of charging and base electrical loads.
To verify the impact of different charging strategies on cable life, the temperature variations under slow charging demands at different EV penetration rates are shown in Figure 7. Additionally, considering the peak and off-peak periods as defined in (Sun et al., 2019), Figure 8 shows the temperature variation curves for two scenarios at a 50% penetration rate under time-of-use charging.
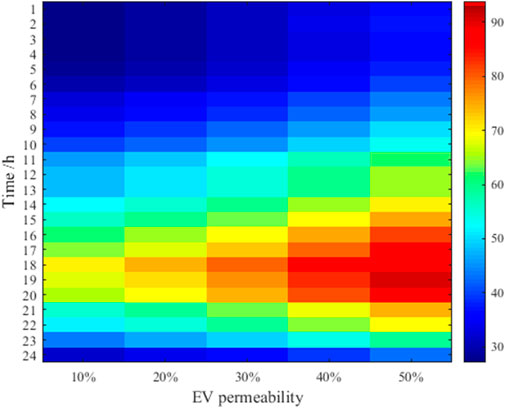
FIGURE 7. Temperature impacts in slow charging scenarios at different EV penetration rates.
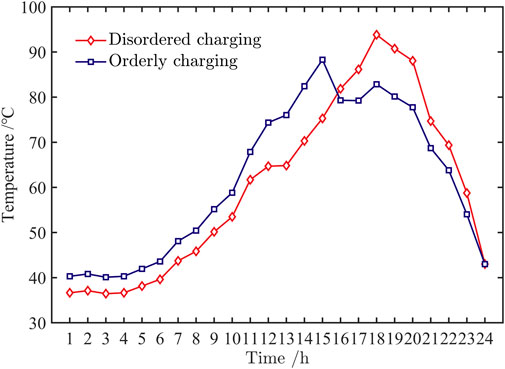
FIGURE 8. Effects of ordered and unordered charging on temperature.
From the figures, it is seen that in uncoordinated charging, all EV users start charging immediately upon returning home, with charging concentrated between 6 p.m. and 2 a.m. the next day. At 6 p.m., the cable temperature reaches 91.67°C due to the peak in total electricity demand from both charging and base loads. Under the influence of time-of-use tariffs, EV users tend to choose lower-priced periods for charging, mostly during the peak hours of solar power generation. Although the surge in charging demand increases the cable temperature, it effectively avoids the temperature rise caused by “peak upon peak” by occurring during the low-demand period of the grid. The cable temperature remains at 88.28°C, not exceeding its maximum tolerance, thereby reducing the fluctuation range of cable temperature. This strategy not only avoids impact on the cable but also enhances the utilization of solar power in the grid.
An analysis is conducted on the operational status of cables under the two charging scenarios mentioned above, and a health status assessment is performed using the health index. The criteria for classifying health levels are shown in Table 2, and the future health status of the cables is predicted using the model proposed in this paper.
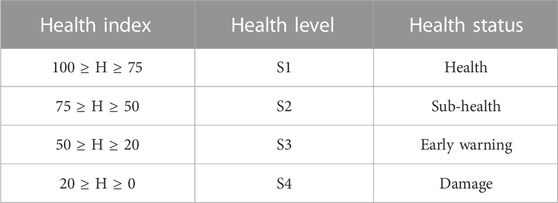
TABLE 2. Health grade classification.
As indicated in Table 2, S1 represents equipment that meets all performance standards, with good foundational conditions, intact technical performance, and stable operational conditions, capable of withstanding external environmental risks. S2 denotes equipment with intact functionality and performance, though slightly below the healthy state, still meeting standard operational requirements. S3 indicates equipment in basically good condition, capable of performing specified functions, but with some performance degradation, having a minor overall impact and needing maintenance. S4 signifies equipment with severe technical performance deficiencies, unable to meet operational standards, and posing a threat to system safety and stability, urgently requiring replacement.
Figure 9 shows an increase in the fault rate of cables over time. Considering the climate environment of the Xiong’an New Area, 100 cables are selected, and the weights of various fault factors are calculated using the Analytic Hierarchy Process, as shown in Table 3.
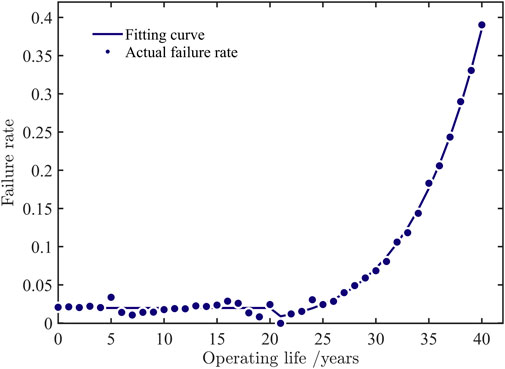
FIGURE 9. Fitted curve of cable failure rates.

TABLE 3. Weighting of fault factors.
The cable fault rate and health index are calculated based on the weights of the fault factors and used as initial parameters to predict future changes in the cable’s health status. Table 4 presents the fault rates and health information of 10 selected cables and predicts their future health status.
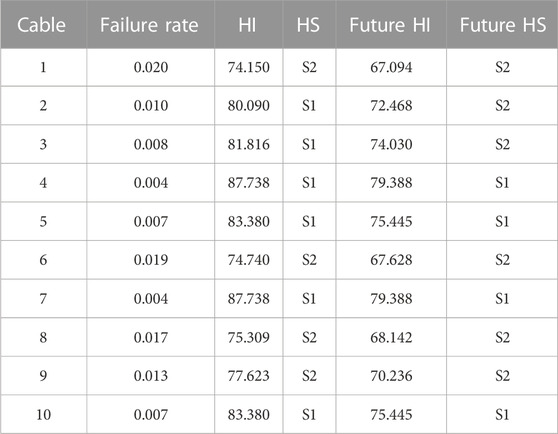
TABLE 4. Cable failure rates and health information.
To validate the superiority of the method proposed in this study, its prediction results were compared with those of the Back Propagation Neural Network (BPNN) and Support Vector Machine (SVM) models, as shown in Table 5. S1 and S2 respectively correlate to the health grades outlined in Table 2. The amalgamation of S3 and S4, denoted as S34, indicates that the cable is in a state of malfunction or pre-alert.
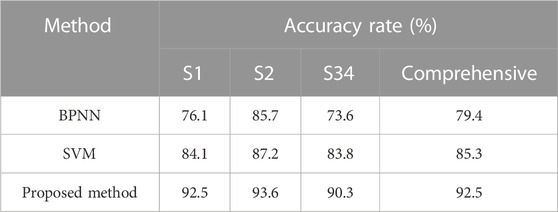
TABLE 5. Comparison of prediction methods.
The analysis of the provided data in Table 5 reveals a clear superiority of the proposed method in accuracy rates across all categories. It surpasses both BPNN and SVM, achieving 92.5% in S1, 93.6% in S2, and 90.3% in the combined S34 category, with a comprehensive accuracy of 92.5%. This consistently higher performance across all metrics establishes the “Proposed Method” as the most effective and accurate among the methods evaluated.
In this paper, we proposed a method for assessing and predicting the health status of cables under the load of large-scale EV charging. Through detailed case analysis, the following conclusions were drawn:
(1) The increase in EV charging demand poses a risk of exceeding cable temperature limits, particularly under the influence of harmonics in AC slow charging scenarios. Addressing this involves both reducing harmonic interference and enhancing cable thermal management, which are essential for ensuring the reliability of the cable system and the overall distribution network.
(2) Cables experience more severe operational challenges and increased risk, especially with prolonged use of AC slow charging by EVs. Implementing time-of-use tariffs to encourage orderly charging can mitigate issues like cable current overload from cumulative charging and base load demands. Additionally, at a 50% EV penetration rate, uncoordinated charging can lead to cable overloading, while time-of-use tariffs can help regulate charging demand distribution, thus reducing peak-to-valley differences and lowering cable temperatures during high grid load periods.
(3) The method proposed in this paper for assessing and predicting cable health status effectively evaluates the operational state of cables and issues timely warnings. It accurately predicts future changes in cable health, providing essential support for grid dispatchers to arrange maintenance and operation plans, thereby enhancing the reliability of the distribution system.
Future research will aim to enhance predictive models and thermal management, facilitating efficient integration of EVs into the electrical grid.
The original contributions presented in the study are included in the article/supplementary material, further inquiries can be directed to the corresponding author.
HL: Conceptualization, Writing–original draft. LR: Data curation, Writing–review and editing. TB: Software, Writing–review and editing. ZK: Methodology, Writing–review and editing. JB: Validation, Writing–review and editing. XL: Resources, Writing–review and editing.
The author(s) declare financial support was received for the research, authorship, and/or publication of this article. This research was funded by the Science and Technology Project of Hebei Electric Power Company of State Grid (SGHEXA00GDJS2250285).
Authors HL, LR, TB, ZK, JB, XL were employed by State Grid XiongAn New Area Electric Power Supply Company.
The authors declare that this study received funding from Hebei Electric Power Company of State Grid. The funder had the following involvement in the study: design, collection, analysis, interpretation of data, the writing of this article and the decision to submit it for publication.
All claims expressed in this article are solely those of the authors and do not necessarily represent those of their affiliated organizations, or those of the publisher, the editors and the reviewers. Any product that may be evaluated in this article, or claim that may be made by its manufacturer, is not guaranteed or endorsed by the publisher.
Ahmad, T., Madonski, R., Zhang, D., Huang, C., and Mujeeb, A. (2022). Data-driven probabilistic machine learning in sustainable smart energy/smart energy systems: key developments, challenges, and future research opportunities in the context of smart grid paradigm. Renew. Sustain. Energy Rev. 160, 112128. doi:10.1016/j.rser.2022.112128
Azizi, M., Talatahari, S., and Gandomi, A. H. (2023). Fire Hawk Optimizer: a novel metaheuristic algorithm. Artif. Intell. Rev. 56, 287–363. doi:10.1007/s10462-022-10173-w
Carvalho, T. P., Soares, F. A. A. M. N., Vita, R., Francisco, R. da P., Basto, J. P., and Alcalá, S. G. S. (2019). A systematic literature review of machine learning methods applied to predictive maintenance. Comput. Ind. Eng. 137, 106024. doi:10.1016/j.cie.2019.106024
Dinmohammadi, F., Flynn, D., Bailey, C., Pecht, M., Yin, C., Rajaguru, P., et al. (2019). Predicting damage and life expectancy of subsea power cables in offshore renewable energy applications. IEEE Access 7, 54658–54669. doi:10.1109/ACCESS.2019.2911260
Gan, L., Wu, H., and Zhong, Z. (2022). Fatigue life prediction considering mean stress effect based on random forests and kernel extreme learning machine. Int. J. Fatigue 158, 106761. doi:10.1016/j.ijfatigue.2022.106761
Gupta, R. S., Tyagi, A., and Anand, S. (2021). Optimal allocation of electric vehicles charging infrastructure, policies and future trends. J. Energy Storage 43, 103291. doi:10.1016/j.est.2021.103291
Han, T., Pang, J., and Tan, A. C. C. (2021). Remaining useful life prediction of bearing based on stacked autoencoder and recurrent neural network. J. Manuf. Syst. 61, 576–591. doi:10.1016/j.jmsy.2021.10.011
Hossain, E., Roy, S., Mohammad, N., Nawar, N., and Dipta, D. R. (2021). Metrics and enhancement strategies for grid resilience and reliability during natural disasters. Appl. Energy 290, 116709. doi:10.1016/j.apenergy.2021.116709
Kong, Z., Jin, X., Xu, Z., and Zhang, B. (2022). Spatio-temporal fusion attention: a novel approach for remaining useful life prediction based on Graph neural network. IEEE Trans. Instrum. Meas. 71, 1–12. doi:10.1109/TIM.2022.3184352
Li, S., and Li, J. (2017). Condition monitoring and diagnosis of power equipment: review and prospective. High. Volt. 2, 82–91. doi:10.1049/hve.2017.0026
Li, S., Li, J., Zhang, X., Gockenbach, E., Wasserberg, V., and Borsi, H. (2007). Estimation of the lifetime of the electrical components in distribution networks. IEEE Trans. Power Del 22, 515–522. doi:10.1109/TPWRD.2006.876661
Liao, L., and Kottig, F. (2014). Review of hybrid prognostics approaches for remaining useful life prediction of engineered systems, and an application to battery life prediction. IEEE Trans. Rel. 63, 191–207. doi:10.1109/TR.2014.2299152
Luo, Q., Chang, Y., Chen, J., Jing, H., Lv, H., and Pan, T. (2020). Multiple degradation mode analysis via gated recurrent unit mode recognizer and life predictors for complex equipment. Comput. Ind. 123, 103332. doi:10.1016/j.compind.2020.103332
Montanari, G. C., Hebner, R., Morshuis, P., and Seri, P. (2019). An approach to insulation condition monitoring and life assessment in emerging electrical environments. IEEE Trans. Power Del. 34, 1357–1364. doi:10.1109/TPWRD.2019.2897905
Nemati, M., Sant’Anna, A., Nowaczyk, S., Jürgensen, J. H., and Hilber, P. (2019). Reliability evaluation of power cables considering the restoration characteristic. Int. J. Electr. Power Energy Syst. 105, 622–631. doi:10.1016/j.ijepes.2018.08.047
Peng, K., Jiao, R., Dong, J., and Pi, Y. (2019). A deep belief network based health indicator construction and remaining useful life prediction using improved particle filter. Neurocomputing 361, 19–28. doi:10.1016/j.neucom.2019.07.075
Rajendran, G., Vaithilingam, C. A., Misron, N., Naidu, K., and Ahmed, M. R. (2021). A comprehensive review on system architecture and international standards for electric vehicle charging stations. J. Energy Storage 42, 103099. doi:10.1016/j.est.2021.103099
Sun, Y., Yue, H., Zhang, J., and Booth, C. (2019). Minimization of residential energy cost considering energy storage system and EV with driving usage probabilities. IEEE Trans. Sustain. Energy 10, 1752–1763. doi:10.1109/TSTE.2018.2870561
Wang, H., Zhou, W., Qian, K., and Meng, S. (2019). Modelling of ampacity and temperature of MV cables in presence of harmonic currents due to EVs charging in electrical distribution networks. Int. J. Electr. Power Energy Syst. 112, 127–136. doi:10.1016/j.ijepes.2019.04.027
Yan, M., Wang, X., Wang, B., Chang, M., and Muhammad, I. (2020). Bearing remaining useful life prediction using support vector machine and hybrid degradation tracking model. ISA Trans. 98, 471–482. doi:10.1016/j.isatra.2019.08.058
Yu, H., Niu, S., Shang, Y., Shao, Z., Jia, Y., and Jian, L. (2022). Electric vehicles integration and vehicle-to-grid operation in active distribution grids: a comprehensive review on power architectures, grid connection standards and typical applications. Renew. Sustain. Energy Rev. 168, 112812. doi:10.1016/j.rser.2022.112812
Zhang, J., Wang, P., Yan, R., and Gao, R. X. (2018). Long short-term memory for machine remaining life prediction. J. Manuf. Syst. 48, 78–86. doi:10.1016/j.jmsy.2018.05.011
Zhang, W., Li, X., Ma, H., Luo, Z., and Li, X. (2021). Transfer learning using deep representation regularization in remaining useful life prediction across operating conditions. Reliab. Eng. Syst. Saf. 211, 107556. doi:10.1016/j.ress.2021.107556
Keywords: health status assessment, cable, electric vehicle, deep learning, health index
Citation: Lei H, Rufeng L, Baofeng T, Kaifeng Z, Binyu J and Lin X (2024) Evaluating and forecasting methods for assessing the health status of cables under the load of large-scale electric vehicle charging. Front. Energy Res. 11:1345840. doi: 10.3389/fenrg.2023.1345840
Received: 28 November 2023; Accepted: 18 December 2023;
Published: 08 January 2024.
Edited by:
Rufeng Zhang, Northeast Electric Power University, ChinaReviewed by:
Hongkun Wang, Shihezi University, ChinaCopyright © 2024 Lei, Rufeng, Baofeng, Kaifeng, Binyu and Lin. This is an open-access article distributed under the terms of the Creative Commons Attribution License (CC BY). The use, distribution or reproduction in other forums is permitted, provided the original author(s) and the copyright owner(s) are credited and that the original publication in this journal is cited, in accordance with accepted academic practice. No use, distribution or reproduction is permitted which does not comply with these terms.
*Correspondence: He Lei, eGFobGVpQDE2My5jb20=
Disclaimer: All claims expressed in this article are solely those of the authors and do not necessarily represent those of their affiliated organizations, or those of the publisher, the editors and the reviewers. Any product that may be evaluated in this article or claim that may be made by its manufacturer is not guaranteed or endorsed by the publisher.
Research integrity at Frontiers
Learn more about the work of our research integrity team to safeguard the quality of each article we publish.