 Yongcheng Liu1
 Zongnan Jiang
 Xiang Wang
95% of researchers rate our articles as excellent or good
Learn more about the work of our research integrity team to safeguard the quality of each article we publish.
Find out more
ORIGINAL RESEARCH article
Front. Energy Res. , 04 January 2024
Sec. Smart Grids
Volume 11 - 2023 | https://doi.org/10.3389/fenrg.2023.1343967
This article is part of the Research Topic Model and Simulation, Dynamic and Transient Analysis, Stability Control of Microgrids with New Forms and Features View all 9 articles
The continuous advancement of the dual carbon goal will lead to fundamental changes in China’s energy structure, with renewable energy emerging as the dominant force in the power supply system. As the proportion of installed capacity for renewable energy continues to increase, the absorption capacity and reasonable utilization rate of renewable energy will become a concern for all sectors of society. At present, the degree of utilization of renewable energy has emerged as a significant factor limiting the development of renewable energy sources. Due to variations in the power structure, load characteristics, and flexible adjustment resources across different regions, blindly pursuing full absorption or higher utilization of renewable energy as a goal can result in increased reserve costs for the system and limited economic benefits, and hinder the development of renewable energy. Therefore, the present study develops a generation–grid–load–storage collaborative planning model aimed at achieving economic optimization by setting different renewable energy utilization rates and obtains the installed capacity of renewable energy and storage under different conditions in the planned year of Gansu Province. The economic analysis indicates that the optimal utilization rate of renewable energy in Gansu Province is projected to decrease from 100% during the period of 2024–2028 to approximately 90% from 2040 to 2060. It serves as a valuable tool for informing the planning and economic development of renewable energy and storage initiatives in Gansu Province, facilitating the achievement of its dual-carbon objectives.
The high-quality development of renewable energy is inseparable from a high level of consumption, and the utilization rate is an essential indicator for measuring the effectiveness of renewable energy governance (Han et al., 2021; Shu, 2021). Statistical data show that China’s renewable energy utilization rate has consistently exceeded 95% for several years (LIU et al., 2023-12; Li et al., 2021), indicating that a considerable level of consumption and utilization has been achieved concurrently with large-scale development. The utilization rate of renewable energy in China is projected to reach 97.3% by 2022, with a respective utilization rate of 96.8% for wind power and 98.3% for photovoltaic power generation. In the future, the impact of large-scale development of new energy on the absorption capacity of the power system will gradually approach a “critical point.” Sustaining a high level of utilization comes with significant challenges, unless other effective measures are implemented. Without such measures, the renewable energy utilization rate during the “14th Five-Year Plan” may exhibit a decreasing trend. The primary reason for the curtailment of wind and solar power in a certain region is that the excessive pace of renewable energy infrastructure development significantly outpaces the capacity of the region for absorption (Li et al., 2021; Chen, 2022). In light of the fact that the installed capacity of renewable energy in Gansu Province is projected to surpass demand by the end of 2022 and considering that renewable energy in Gansu Province continues to rapidly increase during both the “14th Five-Year Plan” and “15th Five-Year Plan,” taking into account economic factors such as reserve costs, maximizing the utilization rate of renewable energy is not always optimal. The control target for utilization will influence the scalable extent of renewable energy development, the flexible resource demand of the system, and the cost of power supply. However, setting an excessively high utilization absorption target and unilaterally pursuing complete absorption could significantly increase the system backup costs, resulting in minimal economic benefits and limited development of new energy (Zhang et al., 2022). The optimization objective of the ratio of renewable energy generation to the load significantly affects the installed capacity of renewable energy planning. Given the constraint of achieving a higher utilization rate of renewable energy, it implies that, for the same proportion of renewable energy consumption, a larger capacity of energy storage is necessitated to accommodate the wind and solar power curtailment that cannot contribute to the power balance. The reduction in the utilization rate of renewable energy implies an opportunity to increase the installed capacity, enhance power supply within the system, and diminish energy storage requirements.
In view of the issue of enhancing the integration of renewable energy into the power grid, a majority of researchers advocate for the employment of flexible resource optimization planning to facilitate the absorption of renewable energy. Zhang et al. (2018) used a sophisticated hour-level sequential production simulation model to quantitatively assess the economic viability of flexibility measures, such as thermal power flexibility transformation and demand-side response, in enhancing wind power consumption levels. Wei et al. (2023-07) presented a mathematical model for the generation planning of a renewable power system, which incorporates cooperative optimization operations involving generation–grid–load–storage. This model aims to achieve the lowest cost while considering policy requirements such as dual-carbon targets and wind and solar curtailment rates. Numerical examples are provided to validate the feasibility of this model. Yang et al. (2022-08) proposed a probability model for the distribution of power system capacity, and based on this, a system flexibility evaluation method is developed that takes into account the rational curtailment of renewable energy. Cheng et al. (2022-08) advanced a collaborative planning approach for flexible resources and power grid integration in the context of emerging energy convergence and delivery scenarios. This method incorporates wind power measurement indices to quantify the impact of renewable energy delivery uncertainty on the planning strategy. Aiming at the absorption responsibility weight of renewable energy, Gao et al. (2020) proposed a calculation method of a reasonable power curtailment rate of renewable energy, which considered both the development cost of renewable energy and the system absorption cost. Wang et al. (2017) for the first time explored the issue of “reasonable energy curtailment” of renewable energy in the medium and long-term expansion planning and calculated the reasonable energy curtailment rate of renewable energy planning under the safe economic development of the power system and the system planning cost under the curtailment rate. The existing research primarily focuses on enhancing the utilization rate of renewable energy through various technical means and optimizing the allocation strategy of flexible resources at different levels of renewable energy penetration. However, it fails to consider quantitative analysis for determining the optimal utilization rate of renewable energy in different regions by comparing the benefits and costs associated with its consumption. Building on this foundation, it is essential to further identify the appropriate scale and key influencing factors specific to each region’s renewable energy development, thereby ensuring a cost-effective transition toward sustainable energy.
Currently, there is no global consensus on the definition of a “reasonable utilization rate” in the international context, and no country has publicly proposed an optimal or economically viable level for the utilization of new energy sources. However, in general, the reasonable curtailment of electricity becomes economically and strategically necessary in the context of high penetration of renewable energy. The “reasonable utilization rate” of renewable energy can be defined as the level of utilization that minimizes the cost of electricity supply in a whole society (Peng, 2022). Based on the concept of system optimization, certain regions may need to decrease the target level of renewable energy utilization, while others may need to increase their target level. Therefore, in consideration of the economic system and future developments in renewable energy, it is imperative to investigate the optimal utilization rate of new energy sources. This paper studies the planned installed capacity of renewable energy in the region under different utilization rates of new energy by establishing a collaborative planning model of the province-level power grid load and storage based on a time-series production and operation simulation model, aiming at the optimization of system investment cost and operation cost. Additionally, through economic analysis, the optimal utilization rate of renewable energy is selected annually in the future.
In order to obtain the optimal utilization rate of renewable energy in the future years of the system, it is necessary to establish the cooperative planning model of system source–grid–load–storage and calculate the configured capacity and total cost of system source–grid–load–storage under different utilization rates of renewable energy in different years in the future based on the objective of economic optimization. Therefore, a time-series simulation collaborative planning model of power system source–grid–load–storage based on the objective function of the lowest system construction and operation costs is established.
The model is based on the simplified unit combination model, forming a production and operation simulation constraint set, quantifying various constraints of multiclass flexible resource output under different utilization rates of renewable energy. The model aims to minimize system construction and operational costs. It takes into account production operation constraints, such as the time-series characteristics of the source–grid–load–storage, as well as the maximum planning capacity of the source–load–storage. Furthermore, it considers investment decision variable constraints, including the proportion of renewable energy generation and the adequacy of system power supply. Ultimately, the model optimizes the optimal installed capacity of renewable energy storage under different renewable energy utilization rates in the target year of the system.
The objective of model optimization is to minimize the total cost associated with system construction and operation, encompassing investment costs in power supply, power grid, energy storage, and system operation cost. The Eq. (1) shows the objective function.
where
The construction investment costs of the system power supply, power grid, and energy storage are shown as follow Eq. (2).
where
The total operation cost of the system encompasses thermal power, hydropower, wind power, photovoltaic power generation costs, thermal power flexible start–stop costs, and transmission line and energy storage operating costs, as well as system load cutting costs. The operation cost as shown at Eq. (3).
where
The investment decision primarily considers the maximum planned capacity of the source–grid–storage, the adequacy of the system power supply, and the proportion of renewable energy generation that reflects the evolution, development, and transformation of the power system. The investment decision are shown as Eq. (4).
where
The proportion of renewable energy generation can reflect the degree of green evolution of the energy power system, and its constraints are shown as follow Eq. (5).
where
The consumption of renewable energy mainly needs to consider the amount of wind and solar curtailment that is less than a certain proportion of renewable energy power generation, and its constraints are as follow Eq. (6).
where
The relationship between wind and photovoltaic curtailment power, and the predicted and actual values of wind and solar power are as follow Eqs. (7), (8).
where
The constraints of the productive operation simulation model mainly ensure the normal operation of the model by considering the constraints of the operation characteristics of conventional thermal power, hydropower, wind power, and photovoltaic output; the transmission limit constraints of the interconnected power grid; the load-side response capacity and electricity constraints; the charge and discharge constraints of the energy storage system; the total reserve constraints of the regional system; and the power supply and demand balance constraints of the system.
The balance constraints of the power supply and demand in the system are as follow Eq. (9).
where
Traditional system reserve capacity demand refers to the capacity of conventional stable power generation capacity to meet the local power load demand and exceed a certain capacity (the largest single capacity unit in the province) or a certain proportion of the load (3%–5% of the load). However, when considering the system reserve demand in the case of flexible supply and demand balance, in addition to the reserve capacity of stable power supply, the flexible load, grid mutual assistance capacity, energy storage, and discharge capacity involved in the demand-side response can be included in the system reserve capacity, and the load reserve reference value does not consider the flexible load capacity and the net load capacity of the renewable energy output. By considering the flexibility of the system reserve, the capacity of conventional power supply can be further reduced, the absorption capacity of renewable energy can be improved, and the actual operational reserve demand of the new type of power system planning scheme can be met. The system reserve constraint is as follow Eq. (10).
where
The operational characteristics of a thermal power unit can be defined by its upper and lower operating limits, minimum start-up mode, rate of increase in output, and start–stop restrictions. The thermal power unit operation constraints are shown as Eq. (11).
where
The operation of hydropower units is primarily influenced by monthly inflow and outflow rates, which, in turn, determine the monthly power generation capacity and limits. The hydropower operation constraints are shown as Eq. (12).
where
The renewable energy output of wind power and photovoltaic is greatly affected by meteorological resources, and the wind and solar power output constraints are as follow Eq. (13).
where
The power flow of the transmission section is greatly affected by the transmission conditions of the line, and the power flow constraint of the transmission section is as follow Eq. (14).
The load-side response is affected by the load response and regulation capacity limits in the provincial transmission network, which are mainly constrained as follow Eq. (15).
where
The charge and discharge constraints of the energy storage system are as follow Eq. (16).
where
The renewable energy consumption capacity indicator is the renewable energy utilization rate and is calculated as follow Eq. (17).
where
CPLEX commercial software is used to optimize the above mixed-integer linear programming model.
The optimal utilization rate calculation method for renewable energy, based on the established mixed-integer linear programming process model, involves solving and calculating the planning scheme by setting four different constraint working condition parameters (85%, 90%, 95%, and 100%). This results in obtaining a flexible planning scheme for source–grid–storage and the total system cost from 2023 to 2060. The specific process is as follows.
(1) The first step is to conduct forecasting research in order to determine the load level and characteristics of the target year, as well as the characteristics and structure of the source–grid–storage. Additionally, it is necessary to consider the investment construction and operating costs of each component under specific boundary conditions.
(2) The second aspect involves setting different rates for the utilization of renewable energy sources with the aim of achieving economic optimization. Additionally, an annual sequential production and operation simulation is conducted to ensure system supply adequacy and power consumption balance, and optimize and solve the configuration capacity requirements of the new installed capacity of wind power, photovoltaic, energy storage, and grid interconnection under different renewable energy utilization rates.
(3) The analysis of the installed capacity and total system cost for renewable energy and energy storage in the upcoming year is conducted under varying rates of renewable energy utilization. Following an economic comparison of each scheme, the optimal utilization rate is determined through a curve fitting methodology, and the final optimal utilization rate of renewable energy is obtained.
The Gansu power grid is taken as a case study in this paper to conduct a numerical analysis. The entire Gansu Province is divided into three regions, namely, the Hexi section, Wu Bai section and Guandong–Hebbai section, based on an analysis of resource endowment development in different regions and a thorough examination of heavy load conditions in key operational sections within Gansu Province. Based on the source–grid–storage planning model and considering the impact of different renewable energy utilization rates on the system, the research on the installed capacity of new energy and energy storage and the total cost of the system under different renewable energy utilization rates in Gansu Province in the coming year was carried out, and the optimal utilization rate of renewable energy in different years was obtained through an economic comparison.
Considering that Gansu Province serves as a significant hub for large-scale renewable energy production, it is imperative to incorporate the inter-provincial interconnection and mutual-benefit DC export demand into the simulation calculation of the regional load in order to accurately assess and manage the consumption of renewable energy resources within the province. The future annual load forecast of Gansu Province is derived from the current load situation, and the maximum annual load demand for the three regions in the future year is determined through extrapolation methods. The annual load characteristics of the three regions are represented using the method of current load demand per unit value for 8,760 h. The forecast of the maximum load for the whole year of the specific target planning year is shown in Table 1.
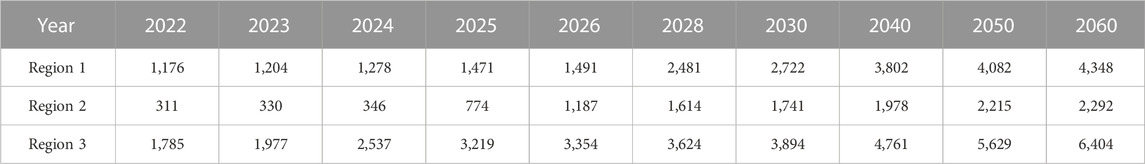
TABLE 1. Annual maximum load forecast for the planning year (unit: 104 kW).
In order to accurately reflect the extent of low carbon transformation in the upcoming year, the proportion of renewable energy generation planned for each region in Gansu Province is determined based on their respective subregional load ratios and considering their unique scenic resource endowments. This information is given in Table 2, which presents the current situation of renewable energy utilization. The generation power characteristics of wind power and photovoltaic power in each region are expressed by unit value formed by historical measured values in the subregion, which is input as the uncertainty source parameter.
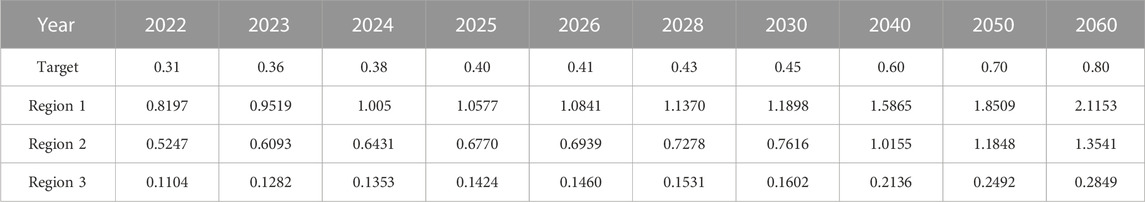
TABLE 2. Development target table of the proportion of renewable energy generation in different regions of Gansu Province.
The optimization of future annual installed capacity planning necessitates an assessment of the current source–grid–storage situation in the three regions of Gansu Province. The specific installed capacities of power supply, power grid, and energy storage in these regions are given in Table 3.
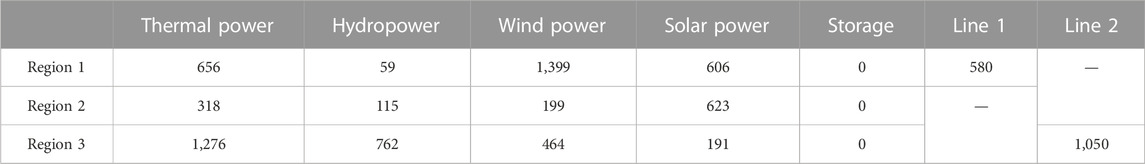
TABLE 3. Current condition of source–grid–storage installations in each region of Gansu Province (unit: 104 kW).
The resource adjustment characteristics of the source–grid–load–storage flexibility primarily consider the following aspects: accounting for the impact of seasonal hydropower conversion, providing constraints on monthly hydropower generation capacity, and specifying limitations on the upper limit of the installed hydropower generation capacity each month, as given in Table 4. The flexible peak load capacity of thermal power units, considering the limitations in winter heating such as the peak load capacity and thermoelectric decoupling, is given in Table 5. The cost of different types of power supply, grid infrastructure, energy storage systems, and demand-side resources for the construction of the renewable power system in Gansu Province is determined based on a combination of actual project parameters in Gansu Province, as given in Table 6.
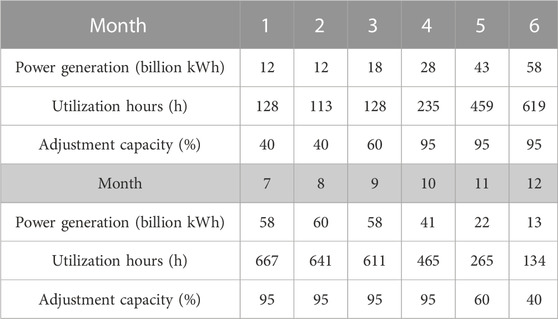
TABLE 4. Monthly hydropower utilization hours and regulation capacity constraints.
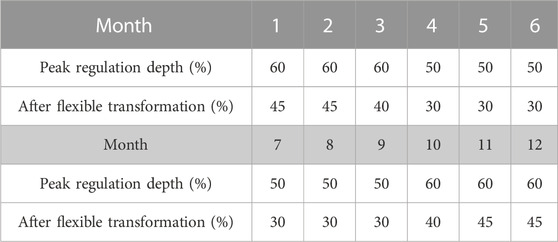
TABLE 5. Thermal power peak regulation ability before and after flexible transformation.
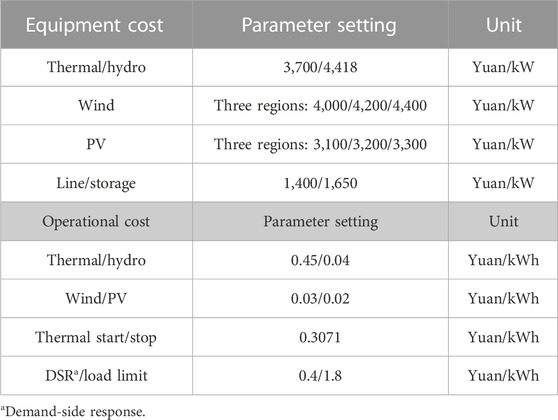
TABLE 6. Flexible resource cost parameter setting table.
In order to verify the validity of the model, the new energy-planned installed capacity and energy storage demand capacity of Gansu Province from 2024 to 2060 were optimized by setting the target values of new energy utilization rates of 95%, 90%, 85%, and 80%. The specific planning results are shown in Figures 1, 2.
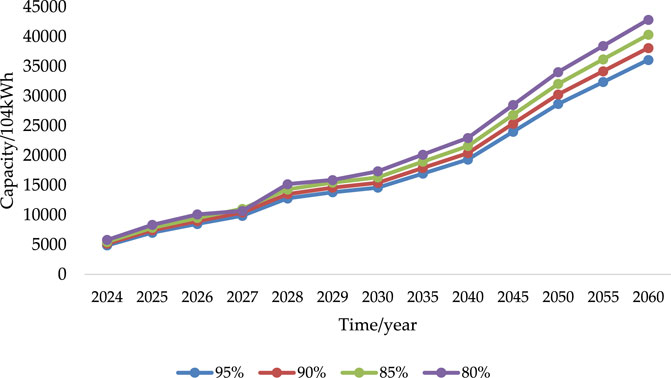
FIGURE 1. Planned installed capacity of renewable energy under different utilization rates in 2024–2060.
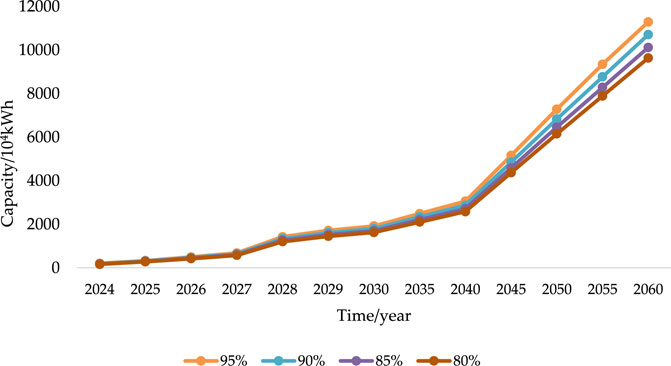
FIGURE 2. Storage planning capacity requirement under different renewable energy utilization rates in 2024–2060.
According to the calculation, from 2024 to 2030, as the utilization rate of renewable energy decreases from 95% to 80%, the planned capacity of renewable energy increases from 146 million kilowatts to 173 million kilowatts, and the demand for the planned capacity of energy storage decreases significantly from 19.05 million kilowatts to 16.24 million kilowatts. In the period from 2030 to 2060, with the renewable energy utilization rate reduced from 95% to 80%, the planned capacity of renewable energy increased from 361 million kilowatts to 428 million kilowatts, and the demand for energy storage planned capacity decreased significantly, from the original 113 million kilowatts to 96.37 million kilowatts. It can be observed that the reduction in the utilization rate of renewable energy necessitates the construction of additional installed machines to meet the system load demand, thereby potentially reducing the energy storage capacity. However, achieving optimal utilization rates for renewable energy requires a comprehensive assessment and comparison of their economic viability.
In order to analyze the economy of the system planning scheme under different renewable energy utilization rates, the renewable energy utilization rates of the planning model were set as 85%, 90%, 95%, and 100%. The flexibility planning scheme of the source–grid–load–storage from 2024 to 2060 under the same utilization constraints is calculated, and the total cost of the system is summarized and calculated under different utilization constraints of renewable energy.
After obtaining the calculation results, the system economy is compared, and the curve fitting method is employed to fit the optimal utilization rate. Both the economic cost and optimal utilization rate after calculation are obtained, as shown in Figure 3.
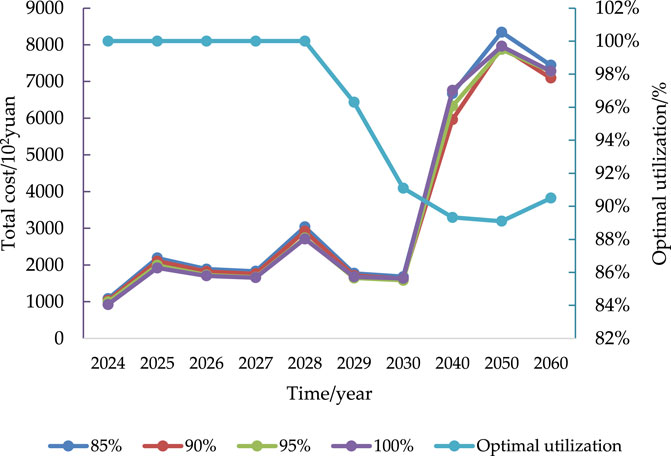
FIGURE 3. Total system cost under different renewable energy utilization rates and optimal utilization rates from 2024 to 2060.
The aforementioned analysis showed that the optimal utilization rate of renewable energy in the system will reach 100% from 2024 to 2028. However, due to factors such as the increasing energy storage capacity and cost implications, this rate will decrease slightly to 96.3% in 2029 and further decrease to 91.10% by 2030. For the period between 2040 and 2060, there will be a notable increase in both the energy storage capacity and renewable energy sources. Consequently, these developments will become pivotal factors influencing system costs, resulting in a relatively stable optimal utilization rate of approximately 90%.
In this paper, a collaborative planning model of the source–grid–load–storage of the provincial power grid in the upcoming year based on the time-series production and operation simulation model is established. Aiming at the optimal economy of the system, the planned installed capacity of renewable energy in the region is investigated under varying rates of renewable energy utilization, taking into account investment decision and operational constraints, and the optimal utilization rate of renewable energy is determined annually in the future through economic analysis.
The results indicate that as the renewable energy utilization rate in Gansu Province decreases from 95% to 80%, there is an upward trend in the installed capacity of renewable energy, while a downward trend is observed in the demand for energy storage configuration, demonstrating opposite trends. After economic comparison and analysis, the optimal utilization rate of renewable energy in Gansu Province should be maintained at 100% until 2028, gradually reduced to 91.10% by 2030, and subsequently maintained at approximately 90% from 2040 to 2060, with the expansion of renewable energy and energy storage capacity.
The original contributions presented in the study are included in the article/Supplementary Material; further inquiries can be directed to the corresponding author.
YL: conceptualization, formal analysis, resources, supervision, validation, and writing–review and editing. ZJ: methodology, software, writing–original draft, and writing–review and editing. YS: data curation, software, visualization, and writing–review and editing. XY: validation and writing–review and editing. XW: methodology, writing–original draft, and writing–review and editing. DZ: investigation and writing–review and editing.
The author(s) declare financial support was received for the research, authorship, and/or publication of this article. This work was supported by the Major Science and Technology Special Project of Gansu Province (No. 22ZD6GA032) and the Management Consulting Project of Economic and Technological Research Institute of Gansu Electric Power Company, State Grid (Research on Construction Plan of New Type Power System Demonstration Zone at typical regional level in Gansu Province, No. SGGSJY00XXWT2310040).
Authors YL, YS, and XY were employed by State Grid Gansu Electric Power Company.
The remaining authors declare that the research was conducted in the absence of any commercial or financial relationships that could be construed as a potential conflict of interest.
The handling editor DZ declared a past collaboration with the authors ZJ, XW, and DZ at the time of the review.
The authors declare that this study received funding from Major Science and Technology Special Project of Gansu Province (No. 22ZD6GA032) and the Management Consulting Project of Economic and Technological Research Institute of Gansu Electric Power Company, State Grid (Research on Construction Plan of New Type Power System Demonstration Zone at typical regional level in Gansu Province, No. SGGSJY00XXWT2310040). The funder had the following involvement in the study: conceptualization, formal analysis, resources, supervision, validation, writing-review, editing, data curation, software, visualization.
All claims expressed in this article are solely those of the authors and do not necessarily represent those of their affiliated organizations, or those of the publisher, the editors, and the reviewers. Any product that may be evaluated in this article, or claim that may be made by its manufacturer, is not guaranteed or endorsed by the publisher.
Chen, F. (2022). New Energy consumption capacity to keep up. Econ. Dly. June 8. No. 008. doi:10.28425/n.cnki.njjrb.2022.003401
Cheng, Y., Zhu, J., Peng, D., Liu, H., and Hu, S. (2022). Promotion of new energy given including risk measurement to lose - storage optimization planning [J/OL]. J. Sol. energy. doi:10.19912/j.0254-0096.tynxb.2022.0865
Gao, L., Su, X., and Liu, S. (2020). Research on Reasonable power abandonment rate of new energy under the absorption responsibility weight of renewable energy. Electr. Power China 12, 136–142. doi:10.11930/j.issn.1004-9649.202004031
Han, X., Li, T., Zhang, D., and Zhou, X. (2021). New problems and key technologies of new power system planning under dual carbon target [J]. High. Volt. Tech., Vol.47, 9, 3036–3046. doi:10.13336/j.1003-6520.hve.20210809
Li, H., Liu, D., and Yao, D. (2021). Research and judgment on the development of China's power system towards the goal of carbon peak carbon neutrality [J]. Proc. CSEE. (18):6245–6259. doi:10.13334/j.0258-8013.pcsee.210050
Liu, H., Zhang, L., Li, J., Li, X., Liang, Y., and Wang, K. (2023). Research and application of absorbing capacity and absorbing space method of large-scale new energy grid connection [J/OL]. J. taiyuan Univ. Technol., 1–8. Available at: http://kns.cnki.net/kcms/detail/14.1220.N.20230705.1809.008.html.
Peng, Y. (2022). Situation analysis and policy Suggestions on rational utilization of new energy under dual-carbon target. J. North China Electr. Power Univ. Soc. Sci. Ed., (6) :42–50. doi:10.14092/j.cnki.cn11-3956/c.2022.06.005
Shu, Y. (2021). Developing new power system to help achieve the goal of "double carbon" [J]. China Power Enterp. Manag. (7):8–9.
Wang, Y., Li, N., Yuan, B., Zhang, F., and Feng, J. (2017). Discussion on "reasonable energy abandonment" in power system planning with large proportion of new energy [LJ]. China Electr. Power 50 (11), 8–14. doi:10.11930/j.issn.1004-9649.201703091
Wei, X., Liu, D., Gao, F., Liu, L., Wu, Y., and Ye, S. (2023). Generation planning of a new power system considering the cooperative optimization operation of source and network load and storage under dual-carbon target [J/OL]. Power Grid Technol. 1-13. doi:10.13335/j.1000-3673.pst.2022.1966
Yang, C., Sun, W., and Han, D. (2022). Take an examination of new energy power system flexibility given ability evaluation methods [J/OL]. Grid Technol. ThePST. 2022.0539. doi:10.13335/.1000-3673
Zhang, F., Yuan, B., Zhang, J., and Zhang, T. (2018). Research on economic evaluation method of power system flexibility measures to enhance wind power consumption [J]. Glob. Energy Internet (05), 558–564. doi:10.19705/j.cnki.issn2096-5125.2018.05.004
Keywords: generation–grid–load–storage collaborative planning, utilization rate of renewable energy, renewable energy consumption, calculation method, optimal utilization
Citation: Liu Y, Jiang Z, Sun Y, Yang X, Wang X and Zhang D (2024) Research on the calculation method of the reasonable utilization rate of renewable energy considering generation–grid–load–storage coordinated planning. Front. Energy Res. 11:1343967. doi: 10.3389/fenrg.2023.1343967
Received: 24 November 2023; Accepted: 08 December 2023;
Published: 04 January 2024.
Edited by:
Donghui Zhang, Tsinghua University, ChinaCopyright © 2024 Liu, Jiang, Sun, Yang, Wang and Zhang. This is an open-access article distributed under the terms of the Creative Commons Attribution License (CC BY). The use, distribution or reproduction in other forums is permitted, provided the original author(s) and the copyright owner(s) are credited and that the original publication in this journal is cited, in accordance with accepted academic practice. No use, distribution or reproduction is permitted which does not comply with these terms.
*Correspondence: Zongnan Jiang, amlhbmd6b25nbmFuQHRzaW5naHVhLWVpcmkub3Jn
Disclaimer: All claims expressed in this article are solely those of the authors and do not necessarily represent those of their affiliated organizations, or those of the publisher, the editors and the reviewers. Any product that may be evaluated in this article or claim that may be made by its manufacturer is not guaranteed or endorsed by the publisher.
Research integrity at Frontiers
Learn more about the work of our research integrity team to safeguard the quality of each article we publish.