 Zehan Lu
 Ninghui Yang
 Yan Cui2
 Zechun Hu
- 1Tangshan Power Grid Corporation, Tangshan, Hebei, China
- 2Department of Electrical Engineering, Tsinghua University, Beijing, China
The power grid and transportation network are coupled by the charging behavior of electric vehicles. Based on the coupled power-transportation network model, this paper first analyzes the effect of the distribution system operator’s (DSO) electricity selling price on guiding the charging behavior of electric vehicles in the transportation network and then builds the DSO’s optimal pricing formulation. Considering the competition between multiple charging network operators (CNOs), this paper establishes a game model between CNOs and solves it iteratively through the best response dynamic method. An approximation method using the elasticity matrix is proposed to speed up the solution by reducing the multi-layer optimization to a single layer one in each iteration, with its effectiveness validated through numerical tests. Furthermore, the paper discusses the issue of the prisoner’s dilemma that arises among CNOs and explores the potential impact of their cooperative strategies on the overall system.
1 Introduction
Electric vehicles (EVs) connect the transportation and power systems through charging infrastructure, which will have a non-negligible impact on both the power system operation and the traffic flow distribution. The pricing of electric vehicle charging stations (EVCSs) is a key factor that shapes the charging behaviors of EV users, thereby influencing the overall operation of the coupled power-transportation system (CPTS). By implementing appropriate pricing strategies, it is possible to guide the spatiotemporal characteristics of EV charging loads and mitigate traffic congestion.
In the electrified transportation era, EVCSs are typically owned and operated by multiple charging network operators (CNOs). The pricing decisions made by CNOs are influenced by the distribution system operator (DSO), which determines the price of electricity sold to CNOs. Therefore, it is important to investigate DSO and CNOs’ pricing strategies and competition within CPTS.
Research on CPTS typically involves establishing sub-models for both the power system and the transportation system and then considering the impact of EVs on the coupling of these two systems. The optimal power flow (OPF) model is commonly used to describe the operating conditions of power systems. As for the traffic assignment problem (TAP) in transportation systems, various models can be employed, such as the user equilibrium (UE) model (Wei et al., 2016; Yuan et al., 2023), the social optimal model (Alizadeh et al., 2017; Shao et al., 2023), and simulation-based models (Amini and Karabasoglu, 2018; Li et al., 2018). The social optimal model assumes the existence of a dispatch center that directly specifies or sets additional transportation fees to guide the route selection of travelers, ultimately resulting in the lowest total travel cost for all travelers. On the other hand, the UE model assumes that travelers act self-interested and rationally, always selecting the route with the lowest cost. Consequently, the driving routes finally chosen by the same type of vehicle with the same starting point and end point are expected to have the same cost. Reference (Qiao et al., 2022) expands the UE model to a stochastic UE model, accounting for the challenge of travelers obtaining complete information and their cognitive bias. For EV users, their driving costs include charging fees, with EVs typically being charging price takers. By providing real-time charging navigation strategies, it is possible to reduce users’ travel and charging costs (Liu et al., 2022; Shi et al., 2020).
It becomes important to account for long-term traffic demand when the TAP is extended to multi-period cases. Common modeling methods for this purpose include multi-period static UE (Liu et al., 2022), semi-dynamic UE (Lv et al., 2019), and dynamic UE (Liu et al., 2020). Furthermore, an extended dynamic UE is proposed in reference (Xie et al., 2022), allowing users to choose routes, charging stations, and departure times.
In the context of CPTS, numerous studies have delved into the pursuit of social welfare maximization (Wei et al., 2016; Wei et al., 2017; Liu et al., 2022; Lv et al., 2019; Lu et al., 2018; He et al., 2016) or CPTS’s revenue maximization (Shao et al., 2023; Qiao et al., 2022). There are some other works considering alternative objectives, such as reducing carbon emissions (Yuan et al., 2023) and fostering the utilization of renewable energy sources (Zhou et al., 2019; Lv et al., 2020). Given that EV charging prices are often set by CNOs independent of the power and transportation systems, many studies have approached the charging pricing issue from the standpoint of CNOs. In reference (Yang et al., 2021), a pricing scheme was proposed from the view of the Cyber-Physical-Human system to motivate EV users to follow the expected charging and travel patterns. Reference (Cui et al., 2021) proposed an optimal charging pricing strategy based on fixed point theory to maximize the benefits of a single CNO operating multiple EVCS in an urban transportation network (UTN).
There are often multiple CNOs providing charging services within the same city, leading to inevitable competition among them. References (Ren et al., 2019; Bakhshayesh and Kebriaei, 2023) consider the scenario of multiple CNOs and establish a pricing competition model based on game theory. Reference (Ren et al., 2019) studies the vehicle-to-grid interaction and explores pricing competition among different CNOs, neglecting the influence of the transportation system on EV behavior. Reference (Cui et al., 2023) discusses the multi-period charging service pricing problem of multi-CNO competition in the CPTS and solves it with an iterative method. Finally, reference (Bakhshayesh and Kebriaei, 2023) takes into account the coupling constraints between EVs, transportation, and distribution networks. It models the problem as a generalized aggregative game and resolves the variational generalized Wardrop equilibrium point of the game through a decentralized learning method.
The remainder of this paper is organized as follows. Section 2 formulates a second-order-cone pricing optimization model for DSO, a pricing model for CNOs, and a multi-period UE model for UTN. It also models the competitive relationships among different CNOs with a game-theoretic model. Section 3 proposes a linear approximation method named “elasticity matrix approximation” to simplify the solution of the multi-layer optimization problem. Case studies are carried out in Section 4. Section 5 provides conclusions.
2 Problem formulation
2.1 Motivation
In UTN, gasoline vehicles (GVs) and EVs currently coexist. There are typically multiple power distribution networks (PDNs) within a city to supply power for charging EVs in different areas of UTN. Public EVCSs in UTN may be connected to different PDNs, and these stations may be owned by one or multiple CNOs. The charging demand from a large number of EVs can significantly impact the safe and economic operation of PDN. Price signals can be utilized to guide the spatial and temporal distributions of charging loads, thereby reducing the impact on the operation of the power grid.
The time is discretized, and the discretized time interval set is denoted as
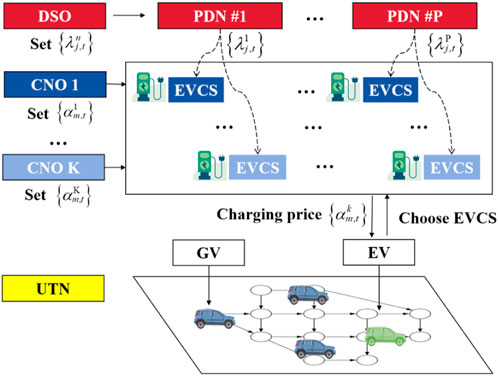
FIGURE 1. Structure of the multi-period DSO&CNOs pricing problem.
In this paper, we build a multi-period UTN model and optimization models for CNO and DSO, denoted as MUL-UE, MUL-CNO, and MUL-DSO, respectively. These models have a nested relationship, influencing each other and jointly describing the state of CPTS.
2.2 Multi-period transportation network modeling
The multi-period mixed-vehicle-type UE model (Cui et al., 2023) is used to characterize UTN, which is abbreviated as MUL-UE. The model can get the distribution of traffic flow in the UTN, which accommodates both GVs and EVs, considering the transfer of traffic demand between different time periods and the influence of EVCSs’ prices.
The specific form and comprehensive explanation of the MUL-UE model are detailed in Appendix A. This section only provides a concise expression.
The MUL-UE problem can be formulated as a nonlinear complementary problem, which is called MUL-UE-NCP in this paper. It consists of four sets of constraints:
The constraint set Cons-Flow describes the relationship between the traffic flow variables. The constraint set Cons-Time estimates the travel time for different types of branch sets, and the constraint set Cons-Cost calculates the total travel cost for vehicles, including driving time cost, time transfer cost, and charging cost for EVs. The constraint set Cons-CP establishes the relationship between the total travel cost of vehicles in different paths for each O-D pair.
The MUL-UE-NCP model is in the form of a constraint set, which can be embedded in an optimization model. It can also be equivalently transformed into a convex optimization form (Liu et al., 2020):
where
2.3 CNO optimal pricing modeling
CNOs own charging facilities, purchase electricity from DSOs, and provide charging services for EVs. Each operator strives to maximize its own profits. It is assumed that a CNO can dynamically adjust its charging service price within a certain range. For the kth CNO, denote the number of EVCSs it owns as
MUL-CNO:
The CNO’s goal is to maximize its total revenue from all charging stations, as shown in (3).
Constraint (10) represents the UTN model, with which the branch flow
2.4 DSO optimal pricing modeling
DSO has the ability to influence the spatial and temporal distribution of charging loads through differentiated pricing for charging stations. In reference (Cui et al., 2023), the electricity sales price to EVCS is designated as the locational marginal price (LMP) of the distribution network. However, the current application of the LMP method is primarily for bulk transmission networks, and it is difficult to be implemented in distribution networks. On the other hand, although the fixed time-of-use pricing method is widely adopted, it lacks the flexibility to guide EVs’ charging decisions. This paper studies the DSO’s flexible pricing strategy for charging stations. The pricing model is formulated as follows.
MUL-DSO:
It is assumed that the objective of DSO is to maximize the total revenue across all PDNs, as denoted in (11). The subscripts n, j, and t represent the PDN index, node index and time period index, respectively.
Constraints (12) to (15) represent the branch power flow models in the form of second-order-cone (SOC) (Farivar and Low, 2013). Constraint (16) is the generator’s ramping limit. Constraints (17) to (20) give the lower and upper bound for variables. Constraint (21) is the upper limit for the average of DSO prices.
The charging load
The specific solution method will be introduced in the next section.
3 Solution method
This section will introduce the game form among multiple CNOs, and provide a method to solve the optimal pricing problem. Regarding the interaction between CNOs, there are two possible scenarios: non-cooperative and cooperative, which will be introduced as follows.
3.1 Modeling of non-cooperative charging pricing game
CNOs can influence the charging load by adjusting charging prices to make EV users 1) reselect their routes; 2) reconsider whether to travel, reflected in the variation of EV traffic demand between different origin-destination (O-D) pairs, as shown in (7).
We denote the non-cooperative charging pricing game among CNOs as
Player Set
Strategy Set
Utility Function Set
In a non-cooperative game, each player’s goal is to maximize their benefit, and the final fixed point reached is the Nash equilibrium (NE). Considering the complexity of the problem, this paper solves the approximate solution of Nash equilibrium, i.e.,
Definition. The
For the proposed pricing game
3.2 Modeling of the cooperative charging pricing game
Competition among CNOs may lead to worse returns for all CNOs. A set of analysis results will be presented in Section 0, showing that the game among CNOs exhibits the characteristic of a prisoners’ dilemma (Lacey, 2008), i.e., there exists a non-Nash equilibrium pricing scheme
Although
Therefore, CNOs may reach tacit cooperation with each other in actual operations. For the convenience of analysis, consider the situation where all CNOs collaborate to form a unified alliance and call the game
3.3 Solution method for the optimal pricing problems of DSO and CNOs
This paper uses the best response dynamic (BRD) method (Fudenberg and Tirole, 1991) to solve
Figure 2 shows the solution framework for obtaining DSO’s pricing strategy and
1) DSO: Solves the MUL-DSO problem to determine the prices of electricity that it sells to the charging stations. MUL-DSO is a multi-layer optimization problem in which the MUL-CNO problem is embedded. Therefore, DSO needs to simulate the decision-making behavior of CNOs when solving the MUL-DSO. These prices are then broadcast to the CNOs.
2) CNOs: Each CNO solves the MUL-CNO problem to maximize its revenue based on the electricity prices set by the DSO, without considering changes in other CNOs’ pricing schemes. CNOs solve the problem one by one. CNOs need to submit their pricing results to the transportation department.
3) Transportation Department: The transportation department simulates the decision-making of EVs and calculates the EV charging flow by solving the TAP, specifically the MUL-UE model. Then the charging loads at all the charging stations are estimated and provided as feedback to the DSO and CNOs.
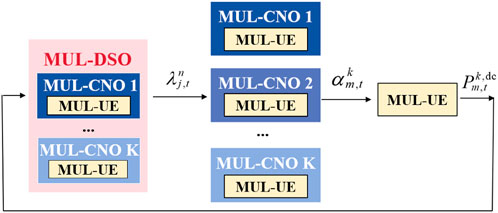
FIGURE 2. Iterative method for DSO&CNOs pricing.
The above process completes one iteration. Repeat this process until the differences in the corresponding pricing results between two consecutive iterations are less than a preset tolerance value.
In order to ensure the feasibility of the calculation process, the solution time and privacy protection are further considered. It should be noted that both MUL-DSO and MUL-CNO are multilevel optimization, with a complicated nonlinear lower-level problem, i.e., MUL-UE. Reference (Cui et al., 2021) converts the single-period CNO optimization problem into an MIQP solution, and reference (Cui et al., 2023) uses the GA algorithm to solve the MUL-CNO problem. However, these solution methods are time-consuming, and they also mean that the calculations by the DSO and CNOs require information of the transportation network, making it difficult to protect private data. To solve these problems, this paper proposes a linear approximation method, which is called approximation by elasticity matrix (AEM).
First, the MUL-CNO problem can be equivalently simplified to the following form:
where the parameters
where
1) Assume that the relationship between
2) Assume that the charging price at time interval t has a small impact on the charging load at other time intervals so that we can ignore it without obvious accuracy loss. Then we have:
where the matrix
CNO can use the tangent at the pricing point in the previous iteration to approximate function (28). The tangent line can be obtained numerically as follows:
where
For DSO, a similar idea can be adopted. MUL-DSO can be simplified and approximated as follows:
where Revenue(DSO) is the objective in (11), and
It requires lots of calculation to get the tangent line for DSO, so we use the least squares method to estimate
where
The estimation method described in (35) cannot work without prior data. Therefore, before the formal iteration begins, a preparation process should be set up in which the DSO performs several trial pricing calculations (simple random pricing is enough to achieve the expected effect) and gets corresponding charging load to accumulate initial data.
The complete process using AEM method is outlined in Algorithm 1.
Algorithm 1.Solution to the Pricing Problem of DSO and CNOs in CPTS Based on AEM Method.
Input: Basic parameters of UTN and PDN, traffic demand forecast
Output: Optimal pricing of DSO
1 Initialization: Set t = 0 and the convergence flag
2 for iteration = 1:
3 DSO pricing: If
4 for CNO
5 CNO updates elasticity matrix: CNO estimates
6 CNO pricing: CNO k update
7 end for
8 TAP solution: After summarizing all CNO prices, the transportation department solves MUL-UE and feeds back the charging load to DSO.
9 DSO updates elasticity matrix: DSO estimates
10 if
11 set
12 break
13 end if
14 end for
15 if
16 return
17 else
18 Report that the calculation has not converged and return prices in the last iteration.
19 end if
The challenging multilayer optimization problems are simplified as single-layer optimization problems by linearization, eliminating the requirement by DSO and CNOs for additional information about UTN as well as reducing the computational burden. It is important to note that the accuracy of the proposed AEM method relies heavily on the linearity of the inner function. However, alternative approximation methods can be explored if the inner function becomes more nonlinear, such as second-order approximation or neural network fitting, which can also reduce computational requirements and ensure privacy protection.
4 Case studies
4.1 Simulation setup
The proposed method is tested on a CPTS comprising a 13-node road network and two 18-node distribution networks.
The 13-node Nguyen-Dupuis road network system (Fudenberg and Tirole, 1991) (as depicted in Figure 3) is modified. Nodes 9, 12, 7, and 10 are each equipped with an EVCS. The original traffic demand generation rates are presented in Table 1, with a base value of 100 vehicles per hour. Considering six time intervals, the traffic demand is
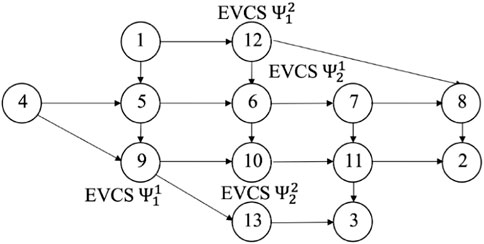
FIGURE 3. Transportation network 13 node test system.
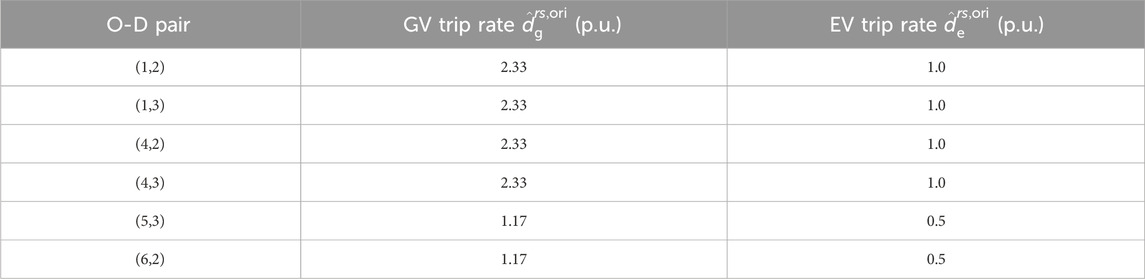
TABLE 1. Travel demand in the transportation network.
There are two distribution networks operated by a single DSO. The parameters of the distribution network originate from the 18-node distribution test system of MATPOWER (Zimmerman et al., 2011), as illustrated in Figure 4. Each PDN is equipped with distributed generators. The electricity prices for EVCS, set by the DSO, are restricted within [80, 180] $/MWh, with a maximum average value equal to 120$/MWh.
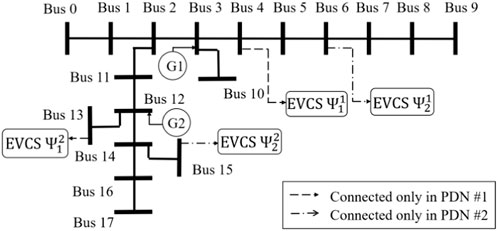
FIGURE 4. Radial 18-node distribution system.
There are two CNOs in the case. The EVCSs located at nodes 7 and 9 of the UTN are managed by CNO 1, while CNO 2 manages the EVCS at the other two nodes. The EVCSs operated by the CNOs are across different PDNs. The two EVCSs of the CNO 1 are in PDN 1 (node 4) and PDN 2 (node 6), respectively. The same is true for CNO 2. The charging price range of the CNOs is set to [150, 250] $/MWh.
In terms of MUL-DSO, the penalty coefficient
The maximum number of iterations
The simulations are carried out on MATLAB 2023 (Mathews et al., 2004), the optimization model was established through YALMIP, and solved through MOSEK, GUROBI and FMINCON solvers. The computer’s CPU is i7-13700 and the memory is 32 GB.
4.2 Method validity test
First, the effectiveness of the AEM method proposed is tested. This section will focus on analyzing the results using AEM at a specific CNO to illustrate the performance of this method.
Set the following simplified scenario: DSO uses LMPs as its electricity sales prices, on which the CNOs’ pricing has almost negligible impact. CNO 2 remains its prices unchanged, and CNO 1 solves the MUL-CNO problem to optimize pricing and maximize its revenue. Different methods can be employed to solve the MUL-CNO problem, and their performance can be evaluated by comparing the objective function value obtained from the same initial point.
The solution results and related performances of the AEM method and genetic algorithm (GA) are shown in Table 2.
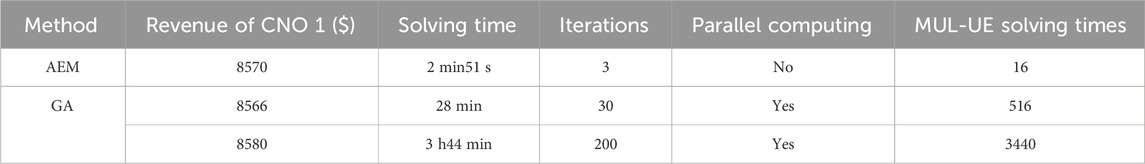
TABLE 2. Comparison of AEM and GA methods in single CNO optimization.
The first two rows in Table 2 represent the results when the stop criterion 0.005 is met. It can be seen that the AEM method requires only 10% of the time compared to the GA method, while better revenue is achieved. Due to its reliance on a large number of random attempts in each iteration, the GA method requires a significantly larger number of MUL-UE solutions than the AEM method. Moreover, parallel computing acceleration is necessary for GA to handle the extensive computational load; otherwise, the time needed will increase substantially.
The GA algorithm is set to iterate 200 generations to obtain the results presented in the third row of Table 2. At this point, the GA method has conducted thousands of searches, and the solution can be considered approximately optimal. The revenue obtained in this case is $8580, and the AEM method achieves a result that is only 0.1% lower than this value, indicating a very close approximation to the optimal solution.
Next, it’s necessary to demonstrate the accuracy of the proposed method for the NE solution under multi-CNO games. DSO still uses LMPs as its electricity sales prices. CNO 1 and CNO 2 solve the MUL-CNO problem iteratively to optimize pricing. Table 3 shows that the AEM method has a deviation of less than 0.5% from the GA method while requiring only 15% of the time.
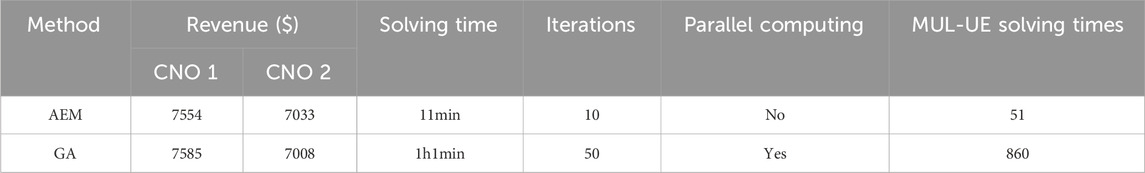
TABLE 3. Comparison of AEM and GA methods in multi-CNOs NE calculation.
4.3 Simulation results under non-cooperative game between CNOs
Algorithm 1 is used to solve the DSO and CNOs pricing problems under a non-cooperative game between CNOs. The convergence of Algorithm 1 is observed first. Figure 5 illustrates the variations in key variables,
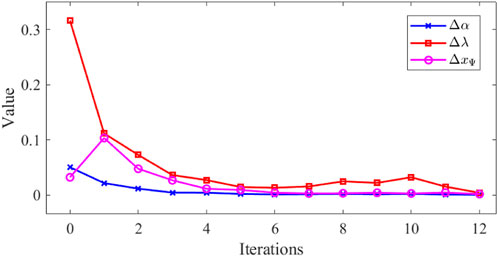
FIGURE 5. Convergence of key variables in Algorithm 1.
Figure 6 shows the changes of average pricing of DSO and CNOs. It demonstrates that in this case, the DSO tends to increase the average electricity price, gradually reaching $120/MWh, which is the upper limit. As the electricity prices increase, the CNOs change their prices accordingly, making the final average price end up at $238/MWh, but it’s still below the upper limit of $250/MWh. This indicates that the highest price is not necessarily the optimal solution for CNOs: although each CNO may have room for price increases, such increases will result in a reduction in EV charging load. At this point, the impact of load reduction outweighs the revenue increase, leading to a decrease in revenue instead.
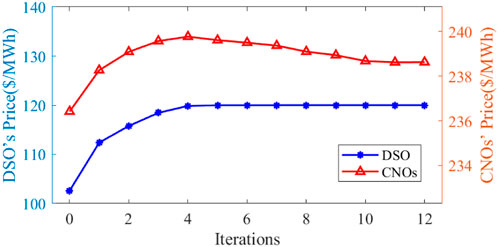
FIGURE 6. Changes of average pricing of DSO and CNOs.
The revenue changes of the DSO and CNOs are shown in Figure 7. The revenue of DSO increases significantly with price optimization, experiencing a growth of 23.9%. However, the revenue of the CNOs is negatively impacted, with a decrease of 16.5% and 13.5% for the two CNOs. It is worth noting that the revenue of the CNOs does not follow a strictly monotonic trend during the iteration process, but instead exhibits slight fluctuations. This can be attributed to several factors. First, the DSO has not yet reached an equilibrium state during the iteration, and its pricing changes affect the power purchase cost for the CNOs, which may vary across different CNOs. Second, the CNOs are competing with each other, and different CNOs may have relative advantages at different stages of the iteration process.
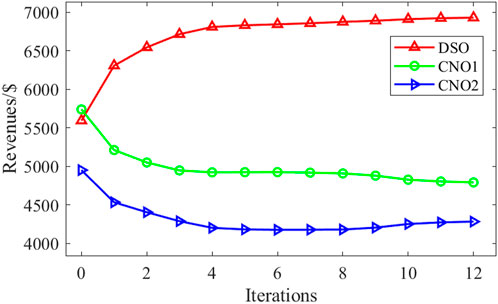
FIGURE 7. Revenue changes of DSO and CNOs.
It’s interesting to note that the phenomenon of the prisoners’ dilemma emerges in CNOs’ non-cooperative game. Table 4 shows the revenue matrix when two CNOs adopt different pricing strategies while the DSO’s electricity price remains unchanged, staying at the point where Algorithm 1 converges. The (A, C) pricing scheme represents the pricing of an
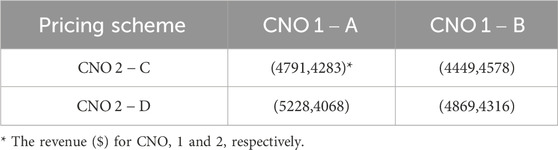
TABLE 4. The revenue matrix for CNOs.
4.4 Simulation results under cooperative game between CNOs
Table 5 shows the comparison of the benefits of each participant when the CNO cooperates or competes. The results show that under the cooperative game, both CNOs 1 and 2 experience an increase in total revenue by establishing cooperation. Additionally, the revenue of the DSO also increases simultaneously without being squeezed out by the CNOs.
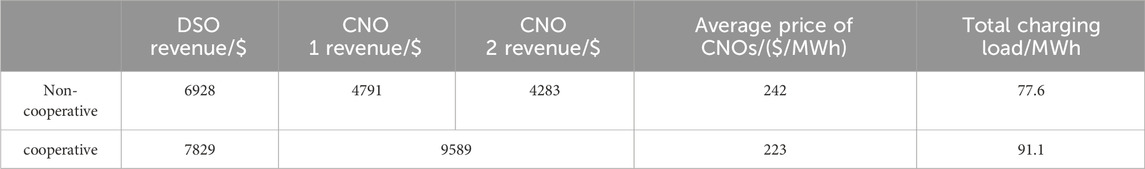
TABLE 5. Comparison between cooperative and non-cooperation game.
It can be explained that the cooperation between the CNOs eliminates the need for intense competition, leading to a reduction in the charging price to EV owners. As a result, the number of EVs traveling in UTN increases, as indicated by (7), and so does the total charging load. When the total charging load rises, both the DSO and CNOs have the potential to gain more revenues.
The above results indicate that the formation of a monopoly alliance among CNOs can possibly have a positive impact on each side: the revenues of DSO and CNOs increase, and EV owners can benefit from lower charging prices. In this case, the cooperation among CNOs may be encouraged. However, such cooperation may not always be beneficial to all participants, and its overall impact on the entire system needs to be analyzed deeply in practice.
5 Conclusion
This paper studies the impact of EVs’ charging demands on operations of both the power system and transportation network. A coupled power-transportation network model is established and a flexible pricing method for DSO is proposed to guide charging load to suitable charging stations. The paper also develops a game model for different CNOs and iteratively obtains the approximate Nash equilibrium solution of the game using the best response dynamic method. To make the complex multi-layer optimization problem trackable, a linear approximation method using elasticity matrix is proposed.
Simulation results show that for the MUL-CNO problem, the elasticity matrix approximation method only takes 10% of the time used by the genetic algorithm, while delivering high-quality solution results. The simulation results illustrate the prisoner’s dilemma phenomenon in non-cooperative games between CNOs, and analyze the tendency of CNOs to reach cooperation.
Future work will explore other goals of the DSO such as peak shaving and ramp power reduction. In addition, the paper doesn’t consider factors such as the EV owners’ choice preferences and incomplete information, which will be studied in future research.
Data availability statement
The raw data supporting the conclusion of this article will be made available by the authors, without undue reservation.
Author contributions
ZL: Conceptualization, Methodology, Writing–original draft. NY: Methodology, Software, Writing–original draft. YC: Methodology, Software, Writing–original draft. PD: Formal Analysis, Investigation, Writing–original draft. XT: Formal Analysis, Writing–original draft. ZH: Conceptualization, Supervision, Writing–review and editing.
Funding
The author(s) declare financial support was received for the research, authorship, and/or publication of this article. This work is supported by Tangshan Power Grid Corporation (Project No. SGJBTS00DKJS2250610).
Conflict of interest
Authors ZL, PD, and XT were employed by the Tangshan Power Grid Corporation.
The remaining authors declare that the research was conducted in the absence of any commercial or financial relationships that could be construed as a potential conflict of interest.
Publisher’s note
All claims expressed in this article are solely those of the authors and do not necessarily represent those of their affiliated organizations, or those of the publisher, the editors and the reviewers. Any product that may be evaluated in this article, or claim that may be made by its manufacturer, is not guaranteed or endorsed by the publisher.
References
Alizadeh, M., Wai, H.-T., Chowdhury, M., Goldsmith, A., Scaglione, A., and Javidi, T. (2017). Optimal pricing to manage electric vehicles in coupled power and transportation networks. IEEE Trans. Control Netw. Syst. 4 (4), 863–875. doi:10.1109/tcns.2016.2590259
Amini, M. H., and Karabasoglu, O. (2018). Optimal operation of interdependent power systems and electrified transportation networks. Energies 11 (1), 196. doi:10.3390/en11010196
Baghali, S., Guo, Z., Wei, W., and Shahidehpour, M. (2023). Electric vehicles for distribution system load pickup under stressed conditions: a network equilibrium approach. IEEE Trans. Power Syst. 38 (3), 2304–2317. doi:10.1109/TPWRS.2022.3185605
Bakhshayesh, B. G., and Kebriaei, H. (2023). Generalized Wardrop equilibrium for charging station selection and route choice of electric vehicles in joint power distribution and transportation networks. China: IEEE Transactions on Control of Network Systems, 1. doi:10.1109/TCNS.2023.3239535
Cui, Y., Hu, Z., and Duan, X. (2021). Optimal pricing of public electric vehicle charging stations considering operations of coupled transportation and power systems. China: IEEE Transactions on Smart Grid.
Cui, Y., Hu, Z., and Duan, X. (2023). A Multi-Period charging service pricing game for public charging network operators considering the dynamics of coupled traffic-power systems. IEEE Trans. Intell. Transp. Syst. 24 (–13), 9355–9367. doi:10.1109/TITS.2023.3271852
emon, S. H., Rougemont, M. d., and Santha, M. (2008). “Approximate nash equilibria for multi-player games,” in International symposium on algorithmic game theory (Germany: Springer), 267–278.
Farivar, M., and Low, S. H. (2013). Branch flow model: relaxations and convexification—Part I. IEEE Trans. Power Syst. 28 (3), 2554–2564. doi:10.1109/tpwrs.2013.2255317
He, F., Yin, Y., Wang, J., and Yang, Y. (2016). Sustainability SI: optimal prices of electricity at public charging stations for plug-in electric vehicles. Netw. Spatial Econ. 16 (1), 131–154. doi:10.1007/s11067-013-9212-8
Li, Y., Liu, X., Wen, F., Zhang, X., Wang, L., and Xue, Y. (2018). “Dynamic charging scheduling for electric vehicles considering real-time traffic flow,” in Proc. IEEE power energy soc. Gen. Meeting (PESGM) (USA: IEEE), 1–5.
Liu, J., Lin, G., Huang, S., Zhou, Y., Rehtanz, C., and Li, Y. (2022). Collaborative EV routing and charging scheduling with power distribution and traffic networks interaction. IEEE Trans. Power Syst. 37, 3923–3936. doi:10.1109/tpwrs.2022.3142256
Liu, Y., Wang, Y., Li, Y., Gooi, H. B., and Xin, H. (2020). Multi-agent based optimal scheduling and trading for multi-microgrids integrated with urban transportation networks. IEEE Trans. Power Syst. 36 (3), 2197–2210. doi:10.1109/tpwrs.2020.3040310
Lu, Y., Song, S., Wang, Y., Chen, F., and Ding, Z. (2018). “Traffic-aware energy management for ev charging aggregator considering spatial and temporal load distribution,” in 2nd IEEE Conference on Energy Internet and Energy System Integration (EI2), China, 20-22 Oct. 2018 (IEEE), 1–6.
Lv, S., Wei, Z., Sun, G., Chen, S., and Zang, H. (2019). Optimal power and semi-dynamic traffic flow in urban electrified transportation networks. IEEE Trans. Smart Grid 11 (3), 1854–1865. doi:10.1109/tsg.2019.2943912
Lv, S., Wei, Z., Sun, G., Chen, S., and Zang, H. (2020). Power and traffic nexus: from perspective of power transmission network and electrified highway network. IEEE Trans. Transp. Electrification 7 (2), 566–577. doi:10.1109/tte.2020.3030806
Mathews, J. H., Fink, K. D., et al. (2004). Numerical methods using matlab. Saddle River, NJ: Pearson prentice hall Upper.
Moradipari, A., and Alizadeh, M. (2018). Electric vehicle charging station network equilibrium models and pricing schemes. [Online]. Available: arXiv:1811.08582.
Nguyen, S., and Dupuis, C. (1984). An efficient method for computing traffic equilibria in networks with asymmetric transportation costs. Transp. Sci. 18 (2), 185–202. doi:10.1287/trsc.18.2.185
Qiao, W., Han, Y., Zhao, Q., Si, F., and Wang, J. (2022). A distributed coordination method for coupled traffic-power network equilibrium incorporating behavioral theory. IEEE Trans. Veh. Technol. 71 (12), 12588–12601. doi:10.1109/TVT.2022.3206095
Ren, H., Zhang, A., and Li, W. (2019). “Study on optimal V2G pricing strategy under multi-aggregator competition based on game theory,” in IEEE Sustainable Power and Energy Conference (iSPEC), Australia, 4 - 7 December 2022 (IEEE), 1027–1032.
Shao, C., Li, K., Li, X., Hu, Z., Shahidehpour, M., and Wang, X. (2023). A decentralized Bi-level decomposition method for optimal operation of electric vehicles in coupled urban transportation and power distribution systems. China: IEEE Transactions on Transportation Electrification, 1. doi:10.1109/TTE.2023.3284783
Shi, X., Xu, Y., Guo, Q., Sun, H., and Gu, W. (2020). A distributed EV navigation strategy considering the interaction between power system and traffic network. IEEE Trans. Smart Grid 11 (4), 3545–3557. doi:10.1109/tsg.2020.2965568
Wei, W., Mei, S., Wu, L., Shahidehpour, M., and Fang, Y. (2016). Optimal traffic-power flow in urban electrified transportation networks. IEEE Trans. Smart Grid 8 (1), 84–95. doi:10.1109/tsg.2016.2612239
Wei, W., Wu, L., Wang, J., and Mei, S. (2017). Network equilibrium of coupled transportation and power distribution systems. IEEE Trans. Smart Grid 9 (6), 6764–6779. doi:10.1109/tsg.2017.2723016
Xie, S., Xu, Y., and Zheng, X. (2022). On dynamic network equilibrium of a coupled power and transportation network. IEEE Trans. Smart Grid 13 (2), 1398–1411. doi:10.1109/TSG.2021.3130384
Yang, T., Guo, Q., Xu, L., and Sun, H. (2021). Dynamic pricing for integrated energy-traffic systems from a cyber-physical-human perspective. Renew. Sustain. Energy Rev. 136, 110419. doi:10.1016/j.rser.2020.110419
Yuan, Q., Ye, Y., Tang, Y., Liu, X., and Tian, Q. (2023). Low carbon electric vehicle charging coordination in coupled transportation and power networks. IEEE Trans. Industry Appl. 59 (2), 2162–2172. doi:10.1109/TIA.2022.3230014
Zhou, S., Qiu, Y., Zou, F., He, D., Yu, P., Du, J., et al. (2019). Dynamic ev charging pricing methodology for facilitating renewable energy with consideration of highway traffic flow. IEEE Access 8, 13161–13178. doi:10.1109/access.2019.2958403
Zimmerman, R. D., anchez, C. E.M.-S., and Thomas, R. J. (2011). Matpower: steady-state operations, planning, and analysis tools for power systems research and education. IEEE Trans. Power Syst. 26 (1), 12–19. doi:10.1109/tpwrs.2010.2051168
Appendix A
This paper uses the multi-period mixed-vehicle-type UE, abbreviated as MUL-UE (Cui et al., 2023):
where the constraint set on the traffic flow of each branch in the transportation network, i.e., Cons-Flow, is as follows:
The meanings of variables are shown below:
(r, s) is the Origin-Destination (O-D);
The constraint set Cons-Flow describes the relationship between the branch traffic flow
In this paper, branch flow
The functions of other constraint sets are as follows: The constraint set Cons-Time estimates the corresponding branch travel time under the given branch flow rate for the regular branch set
Keywords: electric vehicles, charging network operator, distribution system operator, traffic assignment problem, charging service pricing, game theory
Citation: Lu Z, Yang N, Cui Y, Du P, Tian X and Hu Z (2024) Optimal pricing strategies for distribution system operator in coupled power-transportation system. Front. Energy Res. 11:1343311. doi: 10.3389/fenrg.2023.1343311
Received: 23 November 2023; Accepted: 29 December 2023;
Published: 12 January 2024.
Edited by:
ZhaoYang Dong, Nanyang Technological University, SingaporeReviewed by:
Guoqiang Zu, State Grid Tianjin Electric Power Research Institute, ChinaShuohan Liu, Qilu University of Technology, China
Copyright © 2024 Lu, Yang, Cui, Du, Tian and Hu. This is an open-access article distributed under the terms of the Creative Commons Attribution License (CC BY). The use, distribution or reproduction in other forums is permitted, provided the original author(s) and the copyright owner(s) are credited and that the original publication in this journal is cited, in accordance with accepted academic practice. No use, distribution or reproduction is permitted which does not comply with these terms.
*Correspondence: Ninghui Yang, eW5oMjNAbWFpbHMudHNpbmdodWEuZWR1LmNu