 Alina Ho
 Diamantoula Giannopoulos2
 Hélène Pilorgé
 Peter Psarras
- 1Department of Chemical and Biomolecular Engineering, Kleinman Center for Energy Policy, The University of Pennsylvania, Philadelphia, PA, United States
- 2Department of Electrical Engineering, The University of Pennsylvania, Philadelphia, PA, United States
The deployment of carbon management strategies like carbon capture and storage (CCS) and carbon dioxide removal (CDR) at scale will require significant investments in transport infrastructure to deliver CO2 to reliable storage. While pipeline transport has dominated the conversation due to economic reasons, there is increasing evidence that other modes may become viable alternatives when considering scale, regional opportunities, and social acceptance. This paper assesses the viability of rail for CO2 transport in the United States using market analysis, techno-economic assessment and geographic information systems mapping. We believe rail presents many advantages, notably in existing infrastructure with established right-of-ways, but also as an instrument to address unwanted effects of our energy transition, particularly in coal communities. We find that the strategic replacement of coal as a freight commodity could translate into 100 Mt/yr of CO2 movement by rail by 2050, and support up to 60,000 jobs in that industry. Further, we find that while rail pricing is notoriously volatile, there is strong support for rail being the least cost option over pipeline for volumes under 2 Mt CO2 per year, which aligns well with smaller, more risk-averse, and distributed carbon management projects that are scheduled to deploy over the next decade. Rail can also be an alternative in regions where CO2 pipeline projects have had limited success, like in the Midwest, where CO2 is captured from ethanol plants that are already serviced by rail networks. Likewise, rail can service roughly 25% of point-source CCS opportunities that are not proximal to projected trunk pipeline networks, of which 94% are located 1-mile from railroad. Finally, rail may be an integral part of CDR development in regions that are not coterminous with geologic storage, particularly in the Western and Northern US.
1 Introduction
To achieve net-zero emissions, society must scale carbon dioxide removal (CDR) technologies to capture and store over 1 billion tonnes of CO2 per year by 2050 (FECM, 2022). This number only grows when broader carbon management technologies, like carbon capture and utilization, are included. In the International Energy Agency’s path toward net-zero global CO2 emissions from the energy sector by 2070, CCS is responsible for nearly 15% of all emission reductions (IEA, 2020). Limiting global temperature rise to 1.5°C (IPCC, 2022) requires carbon management technology to not only permanently remove CO2 from the atmosphere, but to offset hardest-to-decarbonize applications in the electricity and industrial sectors, helping bridge the gap to negative emissions.
To keep CO2 sequestered from the atmosphere, these capture opportunities need to be linked with durable storage. Today, over 50 million tonnes worth of CO2 storage capacity projects are being developed in the U.S. through government initiatives (FECM, 2021), with the ability to store CO2 as a supercritical fluid through injection into deep underground geologic formations like saline reservoirs and deep basalts. Unfortunately, these storage reservoirs are often geographically constrained and not co-located with capture opportunities.
The development of a nationwide carbon transport infrastructure is critical in achieving decarbonization targets. Currently, pipeline is the predominant transport option, moving 68 million tons of CO2 annually in the US via 50 carbon dioxide pipelines spanning approximately 5,000 miles (Global CCS Institute, 2023). To meet the significant increase in demand for transport capacity in line with decarbonization targets, existing infrastructure is projected to expand over 100 times in capacity. Recent studies have evaluated scenarios for over 13,000 miles of new CO2 transport pipelines to service the utilization and permanent geologic storage of 1 billion metric tons of CO2 per year by 2050 (Larson et al., 2021). While pipeline remains the preferred and primary transport method for CCS due to its ability to transport large volumes of CO2 at low costs (Lu et al., 2020), there remain strong concerns over safety and siting that underlie strong pipeline opposition (Gough et al., 2014; Tcvetkov et al., 2019; Broecks et al., 2021), most recently manifesting in the cancellation of two proposed projects in the US (AP News, 2023; Des Moines Register, 2023; Northern Public Radio, 2023) This suggests that other transportation modes could becomes more involved, particularly in the near-term.
Trucking has been proposed as a lower-scale alternative to pipeline transport of CO2 (Psarras et al., 2017); however, limitations arise when considering cost-effectiveness over distance and other factors around added emissions, volume, and available capacity from trucking fleets. The trucking industry faces unique challenges due to the substantial and growing truck driver shortage, especially among those holding licenses to transport hazardous materials (Road Scholar Transport, 2023). With a large amount of diesel emissions associated with trucking and limited capacity due to US gross vehicle weight (GVW) restrictions factored into costs (e.g., one trucking haul can transport between 20 and 22 metric tons of CO2, a factor of 4 times less than can be accommodated in bulk tankers), trucking becomes a less attractive option moving forward, especially as capacity demand grows exponentially. Trucking may face similar challenges in the social acceptance arena with respect to tailpipe emissions and increased traffic congestion along transport corridors, particularly within underserved communities.
Rail-based transport of CO2 could address many of the issues faced with pipeline and trucking. Several studies have suggested that within certain distances and at lower volumes, rail-based (tanked) transport could be cheaper than pipeline (Metz et al., 2005; Roussanaly et al., 2014; Geske et al., 2015; Roussanaly et al., 2017a). Beyond potentially cost-effective scenarios, utilizing the existing rail infrastructure yields benefits that, while not easily quantified in financial analysis, should be considered in the overall decision-making process. For example, repurposing current infrastructure reduces environmental harms and also supports the industry. Given that the rail industry has historically serviced coal, using rail for CO2 transport is an opportunity to maintain labor and employment. Due to the nature of use, rail tankers undergo frequent inspection and maintenance, and transport smaller quantities of CO2, meaning that in populated regions, an accident is not only unlikely but also confined. While pipeline projects seeking permits in large industrial regions or populated areas face a gauntlet of permitting, rigorous regulation, and negative public perception, rail infrastructure already exists, often already directly servicing target capture sites like power plants or production facilities with old rail tracks for coal or product transport.
This paper examines the conditions under which rail transport might be considered a viable alternative for downstream carbon management. First, historical safety and movement trends are presented. Next, a case for using rail transport as a means to offset unwanted socio-economic impacts through the coal transition is proposed. Finally, several mapping exercises are analyzed to evaluate how rail might be strategically incorporated into U.S. carbon management in the near and mid-term.
2 Materials and methods
2.1 Cost modeling
The Uniform Rail Costing System (URCS) was designed by the Department of Transportation Surface Transportation Board as a cost-estimate tool for U.S. Class I Carriers. Railroad carriers in the United States are classified by annual revenue criteria set by the Department of Transportation’s (DOT) Surface Transportation Board (STB). The threshold set for Class I carriers is $504 million in annual revenue and $42 million for Class II carriers, with all remaining carriers designated as Class III. While Class I carriers operate the main tracks in the larger freight network, Class II and III carriers operate short lines, smaller railroads that run shorter distances, often providing the first-mile/last-mile connection for shippers - the beginning or final stretch of the trip necessary to reach the main rail network or desired location. Short lines connect to the larger rail network and provide feeder and distribution services.
URCS estimates unit costs and total variable costs through the compilation of Class 1 railroad data. This is run annually to cost the STB’s Waybill Sample, which provides public details about rail origin, destination, commodity, and distance hauled. This paper utilizes the 2021 MS Excel workbook version, which is publicly available and can be downloaded and opened (Uniform Rail Costing System URCS, 2023). The STB currently uses this tool to make jurisdictional determinations and assessments in maximum railroad rate reasonableness matters, as well as what rate is considered reasonable and relief allocations for shippers. This model serves as a standardized costing model for basic cost information for the railroad industry and shipping community.
Basic cost modeling is done with the RailroadCostProgram worksheet (Uniform Rail Costing System URCS, 2023), which is used to input the mandatory parameters used by the URCS Phase III Program. The context for each parameter field and justification for default parameter selections is provided in Table 1. A description of each line item is provided in Supplementary Figure S1; Supplementary Table S1. In assessing rail cost viability over a chosen transport corridor, it is assumed that the capacity to move CO2 is always available along the projected route and that there are no limitations in scheduling, i.e., that the transport route is fully available to accommodate uninterrupted transport of CO2 as a commodity. This assumption is likely unrealistic and is discussed in more detail later.
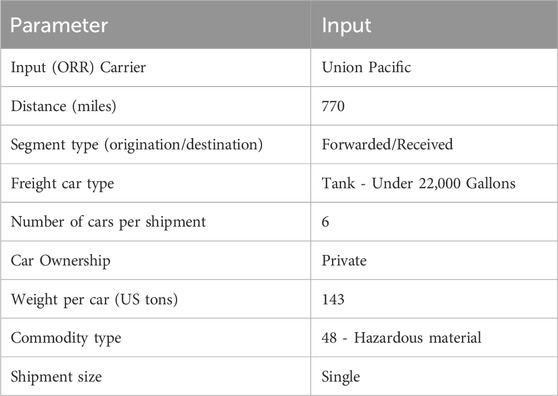
TABLE 1. Default inputs for URCS Phase III mandatory parameters.
2.2 Pipeline cost modeling
Pipeline transport costs were calculated using the FECM/NETL CO2 Transport Cost Model (Morgan et al., 2022). The model has several user-definable parameters, including region (which accounts for elevation and topographic variations), annual throughput and distance. All parameters were left at default values with the exception of capacity, project starting year (2024), and distance.
2.3 Social life cycle assessment (LCA) modeling
The first step in assessing potential job creation involves a monetary conversion of the life cycle inventory. Next, technical coefficients were calculated from input-output tables derived from the U.S. Bureau of Labor Statistics, which enables the calculation of working hours required to achieve a fixed amount of rail transport. This study uses a value of 0.0033 direct and indirect hours per dollar of economic output. Finally, this can be paired with the economic modeling results and converted into jobs by assuming an average of 2012.4 FTE hours worked per year for a member of the rail industry.
2.4 Geographic information systems (GIS) modeling
The maps and spatial analyses presented in this study were made with ArcGIS Pro 3.0.1. The spatial analysis was performed using the pairwise buffer, pairwise clip, and pairwise erase tools. The public Waybill sample was used to understand the historic movements of coal and CO2 from 2013 to 2021 (Surface Transportation Board, 2023). This data was used on the maps to identify regions of interest and changes, in particular, the current origin and destination Bureau of Economic Analysis (BEA) regions for CO2, and the trends in coal transport.
Data on coal plant closures was drawn from Enerdata and Reuters (plant name, owner, location, type of fuel, nameplate capacity, electricity production) and announced retirement plans for coal-fired power plants (Enerdata, 2023; Reuters. U.S, 2023). This data was verified against other sources, provided in Supplementary Table S2. The amount of coal used at each coal-fired power plant was estimated by using an efficiency of 40% (Schmitt et al., 2022), a generalized estimate of the amount of coal per GWh output (Supplementary Table S3), and the electricity generation data from 2018 (or from 2017 if no data was available for 2018). This data was used to map coal-fired power plants along with coal mines and the rail network (Coal Mines, 2023; North American Rail Lines, 2023). Among coal power plants that have announced retirement plans, not all power plants are expected to free up rail capacity, and the following were filtered out of our dataset: power plants located near coal mines (less than 5 miles) and power plants transitioning to biomass.
Geospatial analysis was performed to identify potential CO2 sources in both existing point source capture from industry and theoretical carbon dioxide removal from the air via direct air capture. This point source analysis was based on data on the carbon capture potential at industrial sites, targeting process emissions from larger industrial units (Pilorgé et al., 2020). The potential locations for direct air capture (DAC) deployment depend on the availability of renewable and low-carbon energy sources as outlined by WRI (Lebling et al., 2023). This analysis uses a dataset outlining locations for solar and wind development on converted lands to limit the environmental impacts of their deployment (Baruch-Mordo et al., 2019), and estimated undiscovered hydrothermal resources (Williams et al., 2008; Geothermal, 2023).
This study defines “complete” CCS and CDR pathways as those with a viable pathway to durable storage. Here we present two storage options: in-situ storage in sedimentary formations, and in-situ storage in deep basalts (Pett-Ridge et al., 2023). A recent report on national CDR pathways (Pett-Ridge et al., 2023) suggests two assessment levels for storage: (1) an established storage window in sedimentary formations, from which we use a cutoff of $40 per tonne of CO2 injected to determine the viable storage window for 2030, and (2) prospective in-situ geologic storage, including a prospective storage window in sedimentary formations and thick basalt formations. These formations have limited information to date to assess their viability and cost of injection, and were used as storage options in the analysis for 2050.
CO2 rail infrastructure was modeled using the North American rail network (North American Rail Lines, 2023) and trunk pipelines proposed in the Princeton Net-Zero America report for 2030 and 2050 (Larson et al., 2021). We assume that projects within 50 miles of the trunk pipelines could connect via smaller-volume, spur pipelines.
3 Results and discussion
3.1 CO2 movement, regulation, and safety
For decades, the rail industry has safely transported liquified CO2, designated as a Class 2.2 hazardous material (non-toxic, non-flammable) (Deparment of Transportation, 2011). However, the hazardous material classification only applies to CO2 with a purity level greater than 90% - pipelines carrying CO2 with less than 90% purity are not subject to the same regulations and safety standards (Righetti, 2017). All rail transport is overseen by the Department of Transportation (DOT) Federal Railroad Administration (FRA), therefore encompassing the regulation of CO2 transport.
CO2 must be transported in DOT 105 tankers, which are jacketed, insulated, and pressure-regulated with a full sill underframe (US Department of Transportation, 2023), and are also used to transport liquefied petroleum gas and liquefied hydrocarbons. These tankers are specifically customized for transporting liquefied CO2, designated as DOT 105-J500W, which are fitted with a center sill to handle the temperature changes the tank body experiences. The Department of Transportation refers to Trinity Rail as a DOT 105 tank car manufacturer–due to the maximum 286,000 lbs gross rail load, Trinity Rail produces a DOT 105 CO2 tanker with 21,964 gallons of capacity at a cost of $200-$225 k per tank car. While liquid CO2 is transported via iso-containers in Europe, and a small quantity of CO2 products are transported via TOFC (Trailer on Flatcar)/COFC (Containers on Flatcars), US regulation requires that all liquid CO2 be transported via DOT 105 specified tankers. For CO2, the rail industry imposes an identification number (UN2187) and STCC code (28,133), and the proper shipping name is designated as “Carbon Dioxide, Refrigerated Liquid”.
Controlled CO₂ venting is often used to avoid over pressurization and container ruptures across all transport methods. As CO2 naturally vaporizes, the tanker must vent off on average 9%–16% of its volume—this pressure release is normal, but loss can be further minimized through valve improvements and higher pressures. While bleed-off does not affect shipment speeds (shipments generally take 3–21 days to ship from origin to termination), shippers must consider this factor when calculating product costs.
Data obtained from the United States Pipeline and Hazardous Material Safety Administration (PHMSA) (Pipeline and Hazardous Materials Safety Administration, 2023) encompasses incidents related to the release of carbon dioxide (CO₂) during transport. These incidents include deliberate releases due to overpressurization as well as accidental, uncontrolled releases resulting from faulty components, human errors, and external damage. The analysis spans from 2003 to 2022 and examines various modes of CO₂ transport, namely, highway trucking, pipelines, and rail systems. During this period, the highest number of incidents in CO₂ transport occurred in highway trucking, averaging 11.95 total incidents per year, with 11.6 of these incidents resulting in unscheduled releases (defined as any release not required under normal operations). In contrast, pipelines recorded an average of 5 incidents annually, with 4.9 of them being unscheduled releases. Rail transport systems experienced an average of 3.25 incidents per year, with 2.9 of these incidents leading to unscheduled releases. It is noteworthy that rail transport had the lowest incident rate among the three transportation methods, and these incidents decreased in frequency over the past two decades. However, when considering the volume of CO₂ released, pipelines ranked as the highest, releasing 2,553.33 tCO₂ per year, followed by rail transport with 40.32 tCO₂ per year, and highway trucking with 13.67 tCO₂ per year. High-release incidents were found to be primarily accidental rather than deliberate for rail transport, overpressurization and defective components, especially the failure of pressure relief valves and frangible discs, were the primary causes of incidents.
Movement of CO2 via rail has held relatively steady over the period of 2013–2021, with an average of around 900,000 tonnes moved annually. Movement by region was also relatively stable but has not shown appreciable growth, with the East and Southeast regions representing the largest volume markets to support beverage carbonation (Figure 1).
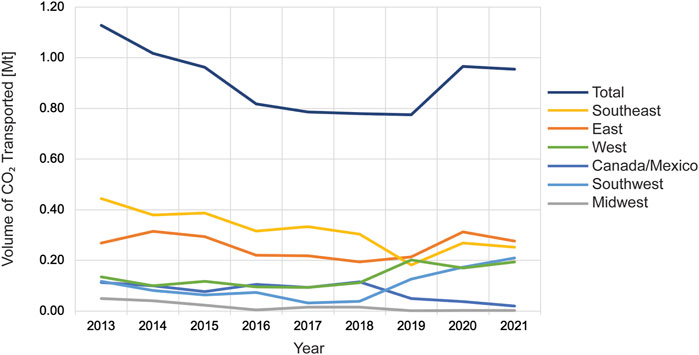
FIGURE 1. Annual movement of CO2 by rail by region (Carload Waybill Sample, 2023).
The Association of American Railroads (The Association of American Railroads AAR, 2023) reported 11,287 shipments of CO2 in North America in 2020, with 9,560 such shipments occurring in the United States, making CO2 the 31st (out of 125 commodities) most-transported hazardous material in the U.S. All CO2 was transported as a refrigerated liquid via rail in 1,275 DOT 105 CO2-specific tankers across the U.S, with the total fleet size being approximately 1,300 cars, indicating limited fleet availability. From the Commodity Flow Survey (CFS) (Bureau of Transportation Statistics, 2023), most recently aggregated in 2017, trucking remains the dominant mode for liquid CO2 transport in the US (outside of pipeline, which transports CO2 in the supercritical phase). Nearly 10 million tonnes of liquid CO2 is transported in the US via trucking and rail, serving a small but established market for CO2 offtake (Table 2).
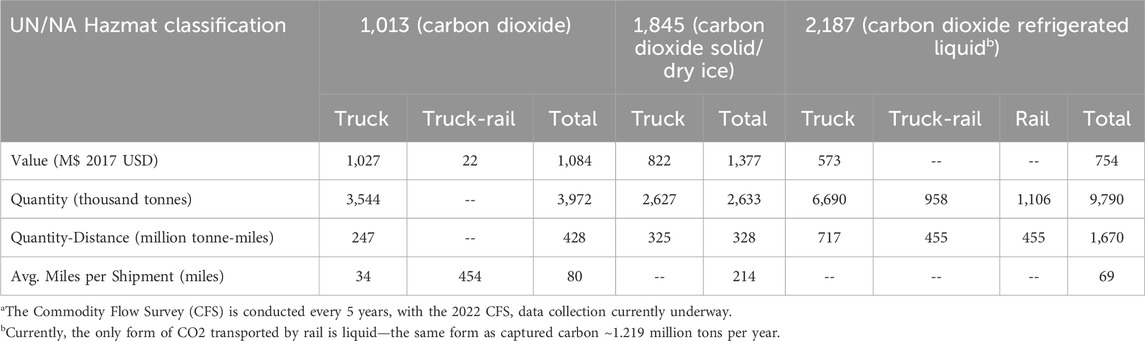
TABLE 2. Modal comparison of CO2 transport in the US. Source: Bureau of Transportation Statistics 2017, The Commodity Flow Survey (CFS)a (Bureau of Transportation Statistics, 2023).
Through analysis of the Public Use Carload Waybill Sample, one of the most comprehensive data sets of railroad movements and trends, and the Quarterly Freight Commodity Statistics Report (Economic Data, 2023; RSI Logistics, 2023) published by the U.S Department of Agriculture Surface Transportation Board, CO2 rail movement can be geographically traced to origin and destination. For a more accurate analysis, commodity shipments with incomplete information where the termination or origin data is unknown are removed from the dataset. Figure 2 shows the key origin and terminating BEAs for CO2 transport.
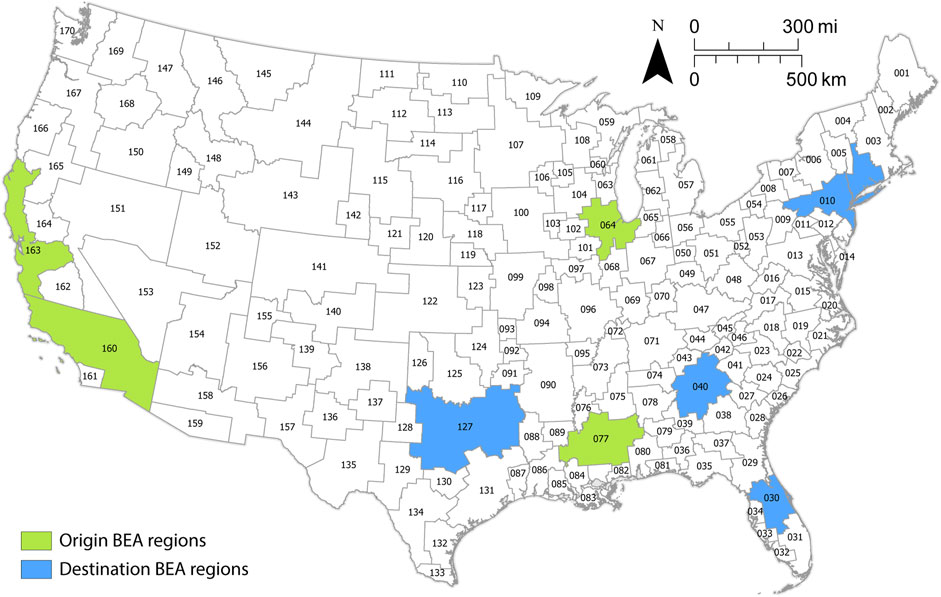
FIGURE 2. Map of Business Economic Area (BEA) codes, with key origin and terminating BEA regions for liquid CO2 transport (Economic Data, 2023).
A majority of outward CO2 rail movement originated in the Jackson Dome area in Mississippi, where Jackson Dome, a significant natural underground reservoir of CO2 is located (BEA region 77), followed by ethanol plants in Iowa/Indiana (BEA region 64) and California/Arizona (BEA region 160, 163). A majority of current CO2 movement (rail and pipeline) is attributed to use in enhanced oil recovery (EOR), rather than carbon management activities. However, extraction from natural resources is projected to change as oil and gas companies plan to shift to industrially sourced CO2 for EOR, using carbon capture technologies. Ethanol plants produce almost 100% pure CO2 streams, making capture a viable and economic option. A majority of terminating rail movement is concentrated in Dallas/Fort Worth, Texas (BEA 127) for EOR use, followed by Orlando, Florida (BEA 30), Atlanta, GA (BEA 40) and the New York region, likely for use in food and beverage applications. A historical look at these trends is provided in Supplementary Figures S2, S3.
An increase in rail transport of liquid CO2 in the US hinges on several factors: 1) a growing market for CO2 supply and offtake, enabled by more conducive political economy to large-scale CCS and CDR projects as well as carbon-to-value conversion technologies, which could represent large, additional offtake partners, 2) the position of the rail freight industry on whether CO2 represents a compelling business case, and 3) the availability of rail freight capacity to support any additional demand for CO2 movement. The next section focuses on this final point, where recent US policy toward coal power generation could present an opportunity.
3.2 Liberation of freight capacity through the coal transition
For rail to be considered a viable alternative for CO2 transport, there must be sufficient capacity to move significant volumes of CO2 on existing rail lines. This capacity could become liberated over time through the transition away from coal-fired power generation. The recent passage of the 2022 Inflation Reduction Act is expected to accelerate the closure of coal-fired power plants in the US over the next 10–15 years. While this legislation is aimed at the mitigation of highly carbon-intensive power sources, it is recognized that there may be unintended and unwanted consequences of this transition, including loss of employment at the power plant and along the entire supply chain. Around 70% of coal is delivered by rail, where freight transport averages over 400 million tonnes per year. The risk of economic collapse in these “energy communities” has led to additional incentives, including a 10% tax bonus for energy projects or technologies located within these communities. Hence, there is strong political alignment for any strategy that can bring economic stimulus and jobs to these areas.
The decline of coal in the US and the subsequent effect on coal transport is evident when looking at recent historical trends: coal transport in the US peaked at 1,023 million tonnes in 2007 and decreased to 495 million tonnes in 2021 (US Energy Information Administration, 2023c). In 2008, coal accounted for 45% of total US freight moved by rail (Freme, 2008). This decline is consistent with the declining number of coal-fired power plants in service, from 332 in 2011 to 169 in 2021, or an average of 9,450 MW of coal capacity being retired each year over the same time period (US Energy Information Administration, 2023a; US Energy Information Administration, 2023b). Historic movements of commodities show that the transport of coal has been declining over the last decade from about 700 Mt to 400 Mt of coal transported on rail (Supplementary Figures S4–S6).
Figure 3 shows coal current capacity and planned retirements of facilities. According to these projections, about half of the 2023 coal-fired capacity will be retired by 2048 with the sharpest decline happening in the coming decade. Planned retirements focus on older units that have higher maintenance costs and are less competitive. Also, some coal-fired power plants will have to comply with regulations limiting wastewater discharge coming into effect in 2028 and choose to retire instead of investing towards that new infrastructure.
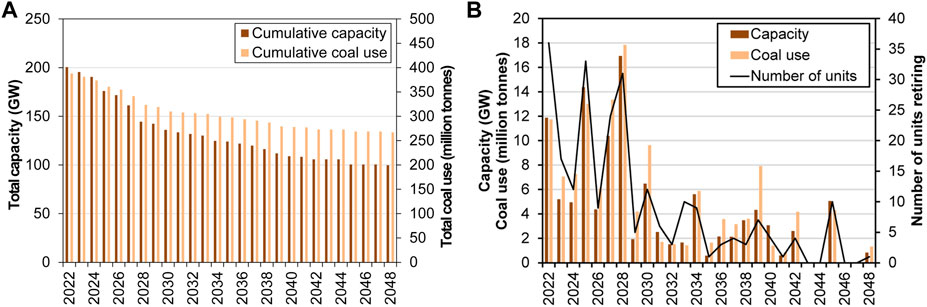
FIGURE 3. (A) Projected total capacity of coal-fired power plants along with total coal use, according to announced retirement plans. (B) Projected retiring capacity of coal-fired units each year, along with coal use and corresponding number of units [data from Enerdata (Enerdata, 2023) and Reuters (Reuters. U.S, 2023)].
When accounting for the fact that some coal power plants are located at or close (<5 miles) to coal mines and do not require use of the rail network, we estimate that 349.1 million tonnes of coal per year need to be transported to coal power plants, corresponding to ca. 9,600 rail cars per day. Power plants that have announced retirement plans that would progressively free up capacity to transport other commodities like CO2 along those transport routes. By 2050, we estimate 1,220,000 carloads could be repurposed, which translates to roughly 100 million tonnes of CO2 per year if fully utilized. Importantly, this study estimates that such an effort could create or salvage roughly 60,000 indirect and direct jobs, with almost half attributable to the supply chain.
The National distribution of coal-fired power plants is shown in Figure 4. There is a notable concentration of plants in the Midwest and Northeastern regions, coterminous with dense Class I rail networks. Viable geologic storage is also indicated as co-location with storage, where possible, can obviate or minimize CO2 transport altogether. These facilities are represented with hollow symbols as they are less likely to have active coal transport via rail today and thus would not play into the aforementioned liberation of freight capacity via plant retirement. All remaining plants are marked with filled symbols, with retirements in 2030, 2040 and 2050 differentiated to assist in identifying near-term opportunities.
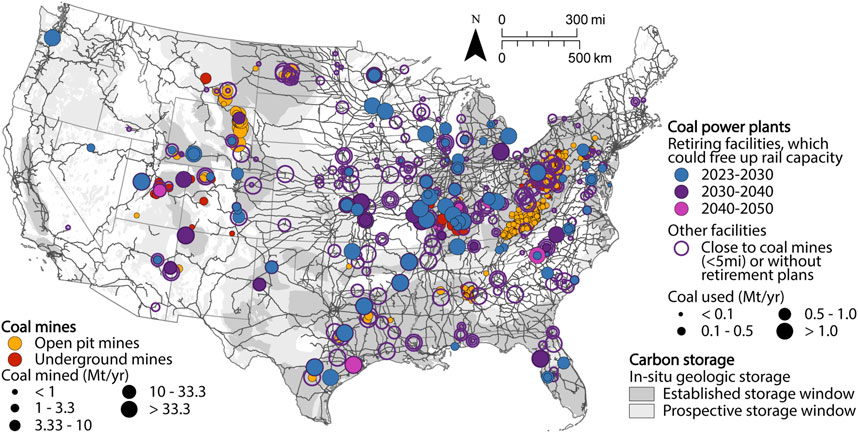
FIGURE 4. Spatial distribution of coal power plants, transport, coal mines, and in-situ geologic storage of CO2 in the contiguous United States. The coal-fired power plants that are likely to free up rail capacity in the future are outlined on this map. These facilities have announced plans to retire and are located more than 5 miles from coal mines (Coal Mines, 2023; Enerdata, 2023; North American Rail Lines, 2023; Pett-Ridge et al., 2023; Reuters. U.S, 2023).
A significant number of power plants have retiring plans in Illinois (Figure 5, left panel), where coal use is expected to decline from 80.9 Mt/yr to 48.9 Mt/yr by 2050 (17.7 Mt/yr by 2030, 9.3 Mt/yr in 2030–2040, and 5.1 Mt/yr in 2040–2050).
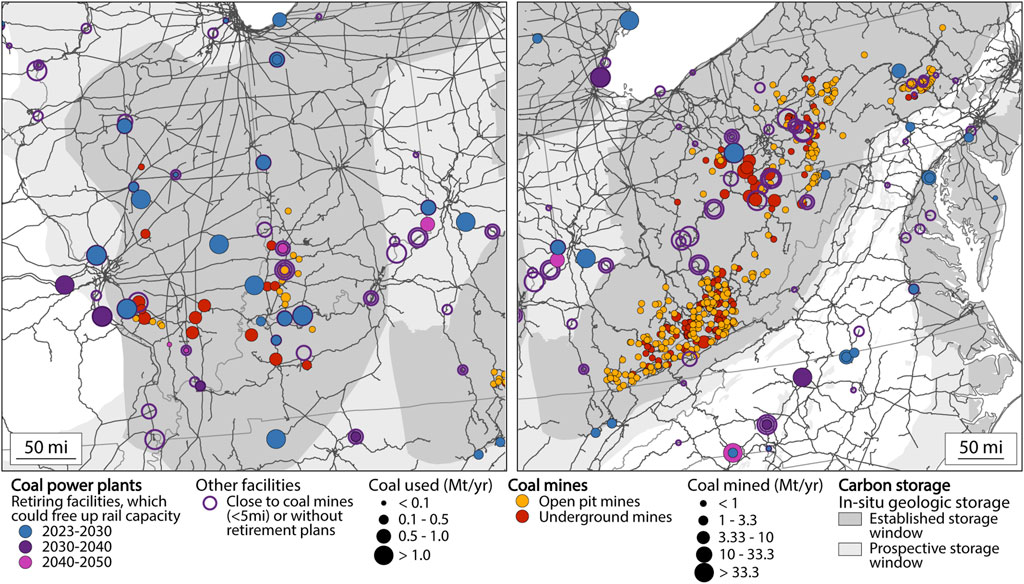
FIGURE 5. Spatial distribution of coal power plants, transport, and coal mines, and in-situ geologic storage of CO2 in Illinois (left) and in the Appalachian region (right). The coal-fired power plants that are likely to free up rail capacity in the future are outlined on these maps. These facilities have announced plans to retire and are located more than 5 miles from coal mines (Coal Mines, 2023; Enerdata, 2023; North American Rail Lines, 2023; Pett-Ridge et al., 2023; Reuters. U.S, 2023).
The Northern Appalachian region (predominantly Western Pennsylvania and West Virginia, right panel in Figure 5) appears promising for rail transport. Coal transport is expected to continue to decline with the planned retirement of coal power plants as utilities comply with environmental regulations. In the northern Appalachian region, coal power plants need about 72.2 million tonnes of coal to be transported by rail, with a projected decrease of 14.5 million tonnes of coal by 2050 due to retirements (10.0 Mt by 2030, 3.2 Mt in 2030–2040, and 1.3 Mt in 2040–2050).
The region’s major railroads, Norfolk Southern and CSX, developed rail corridors to service the historically significant energy-producing region with over 20,000 MW of coal-fired capacity. However, the decline in 45% of all Appalachian coal production between 2005 and 2015 (Jackson et al., 2023) has resulted in significant operational changes, such as massive layoffs, service changes/cuts, and retirement of portions of railroad tracks, leading to higher transportation costs and decreased opportunities for economic development. In 2014, CSX laid off 480 workers alone due to declining coal traffic closing maintenance shops. The lack of cost-competitiveness of Appalachian thermal coal, compared to Wyoming or Illinois Basin coal, has resulted in Southeastern power plants shifting from traditional Appalachian coal sources despite greater differences by rail. While the decline of the coal industry has opened up capacity, existing rail corridors were developed to access the region’s coal and timber, limiting potential substitutes. The CCS industry is a unique candidate in revitalizing rail volume, essential to connecting offset coal-fired power, natural gas processing, refineries, chemical plants, and natural gas power sources to the regions storage options (Cumming et al., 2019). High-paying jobs once offered by mining have disappeared with limited alternatives for re-employment, but have transferable skill sets towards the CCS industry with skilled manufacturing applications (ADL Ventures, 2023).
3.3 The economics of rail transport
The potential and costs for both pipeline and rail transport have been directly evaluated by Roussanaly et al. (2017b), as well as more recently by Stolaroff et al. (2021). These studies conclude that there may be an argument for cost parity between rail and pipeline at intermediate distances and volumes of less than 1 MtCO2/yr. Real costing data for CO2 transport via pipeline is not publicly available but has been modeled extensively at costs that approach $0.02 to $0.01 per tonne-mile for very large scales (Middleton et al., 2020; Psarras et al., 2020; Smith et al., 2021). These costs are sensitive to geography, throughput capacity, and configuration (e.g., onshore vs. offshore). For rail, an examination of the public waybill sample reveals that US rail CO2 transport averaged 684.3 miles per shipment (Table 3) and 5-6 cars per shipment and at an average revenue of $85/tonne. While the public waybill sample reports revenue, this can be misleading as all contractual rate and confidential information is masked by an unreported factor, meaning actual rates could be higher or lower. Hence, the data in the Waybill Sample does not provide general benchmarking of actual rates (RSI Logistics, 2023).
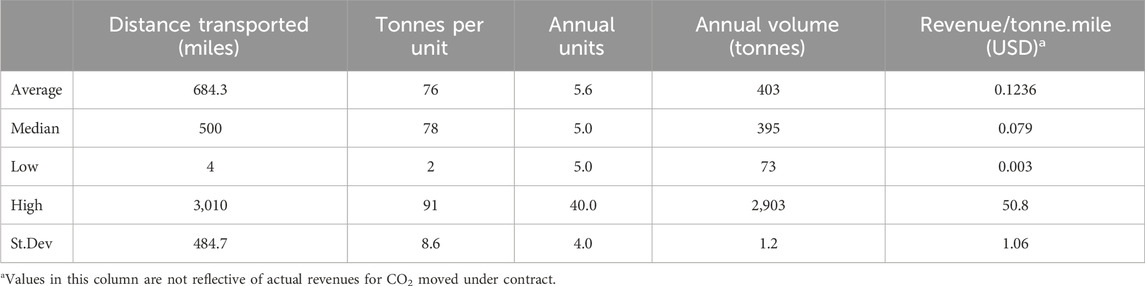
TABLE 3. Select statistics derived from the 2021 STB Waybill Sample (Carload Waybill Sample, 2023) for transport of liquefied CO2 by rail (n = 2,379).
The cost of moving any commodity via rail is composed of many cost elements: fuel, equipment, labor, yard and switching, track and right of way (ROW), loss and damages and other services (RSI Logistics, 2023). Fuel costs describe the costs to the railroad for the fuel consumption required to move the commodity from origin to destination. Because the price of fuel can fluctuate significantly, rail roads often include a fuel surcharge on top of fuel costs as an additional source of revenue or to hedge against rising fuel costs that were not built into the negotiated rate. Equipment costs reflect the cost of the rail car and these costs are zero to the railroad if the car is privately owned or leased by the shipper (2,372 of 2,379 shipments in the aforementioned public Waybill Sample indicated private ownership of the rail equipment). Locomotive costs are considered separately and are the responsibility of the rail carrier. Labor costs cover crew, dispatch and clerical services but exclude yard and industry switching costs. This latter category reflects labor associated with switching (e.g., pick-up or delivery) to and from the serving yard, but does not reflect short-line or regional railroad costs designed to extend the Class I rail network to additional regions. Track and ROW costs include maintenance for tracks, ROW, buildings and facilities and can contribute to roughly 20%–30% of the total cost depending on segment distance.
It is important to note that reporting of generalized rail costs can be misleading for several reasons. For one, while some of these cost elements are agnostic to distance when considered on a tonne-mile basis, others decrease with distance (e.g., labor and yard and industry switching costs), which leads to a non-linear cost response and higher intensity rates over short transport segments. Second, as indicated in the previous paragraph, first and last-mile costs are not included in Class I rail carrier cost modeling as these are serviced by regional carriers (who often have minimum rates for service along short lines) or trucking, which generally has higher economics on a per tonne-mile basis.
An additional factor complicating rail pricing is the revenue-to-cost (RVC) ratio imposed by the rail carrier. Because there are very few rail carriers servicing the US, and most regions are serviced by at most one carrier, the rail carrier may impose a significant markup over the aforementioned rail costs. A higher markup may occur when the shipper has few alternative options, or when displacing an existing commodity on a rail line. Hence, CO2 shippers can improve their leverage in rate negotiations by showing that other modes of transportation are available (e.g., trucking, pipeline, and barge), or through the use of transloading.
A sample of cost and pricing projections is provided in Table 4. While there are several factors to consider, this analysis considered sensitivity to carrier, distance traveled, and shipment type (e.g., a single car, or a unit train representing 50 or more of the same type of commodity). Railroad costs are conveyed along with competitive and non-competitive pricing which reflect a more moderate RVC ratio of 1.5x for transport with negotiating leverage, and a higher 3.0x RVC for transport with minimal alternative options (sometimes referred to as captive transport). It is important to note that these RVCs are illustrative only and do not necessarily reflect the markup that railroads would impose on their costs. Generally, the data shows that unit costs of transport decrease with distance, that it is cheaper to transport in bulk (more than 45 or 50 cars per train) than in single-car shipments, and that railroad cost can vary by carrier, though this may embody other factors such as geography.
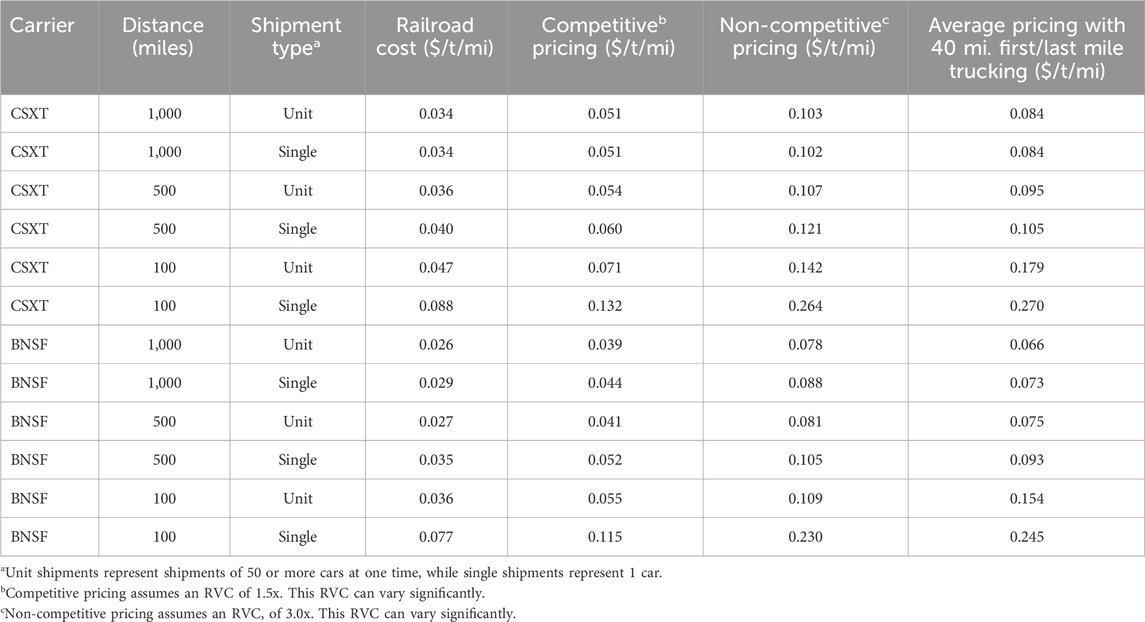
TABLE 4. Cost and pricing estimates of CO2 shipment by rail.
For reference, large trunk pipelines carrying several megatonnes of CO2 capacity are projected to reach costs of $0.02/t/mi (Morgan et al., 2022), which would be the least cost option against any configuration in Table 4. This underlies why pipeline has continued to dominate the narrative on CO2 transport. However, a fully loaded unit train operating at maximum efficiency and minimum load and unloading times has roughly the same capacity as a 2 Mt CO2 pipeline. The economics of a 2 Mt pipeline are closer to $0.07/t/mi, which falls within the feasibility range for longer haul rail configurations in Table 4. This means that rail could be a competitive cost option for volumes under 2 Mt, which aligns well with the scale of near-term opportunities. Locations proximal to loading stations would be ideal for minimizing first/last mile costs incurred via short-line transport or trucking, the latter of which has been reported elsewhere at $0.18/t/mi (Pilorgé et al., 2020). The last column reveals the combination of an average rail rate with 40 miles of trucking costs included to account for transport to and from the terminals.
Several factors beyond techno-economics suggest that rail could be a viable alternative or complementary mode, including the aforementioned estimate of job creation or preservation. Pipeline projects have high capital expenditures and low operation and maintenance costs compared to rail-based transport, which repurposes existing rail infrastructure, resulting in lower capital expenditures but medium operation and maintenance costs. Therefore, risk-averse projects with a shorter economic valuation period may find the large upfront investment that pipelines require less attractive (Roussanaly et al., 2017b). Rail might also represent a lower barrier to entry as ROW is already established. Additional points to be considered in the evaluation of rail viability include:
1. Product Demand: What is the current and projected demand for CO2, with special consideration to time and region?
2. Product Consideration: What are the specific processes, facilities, and regulations tied to CO2 rail transport?
3. Rail Infrastructure: What is the existing rail infrastructure available for use?
4. Strategic Development: How can the rail network be utilized strategically (hub-based model, different scales of use, etc.) to contribute to the efficient development of nationwide carbon transport infrastructure?
5. Positive Externalities: What are the unique benefits of rail transport?
3.4 Strategic pathways for rail-based CO2 transport
The goal of transport (by rail or any other mode) is to move CO2 from the point of capture to a reliable storage location, such as sedimentary basins. Figure 6 overlays Class I carrier railroad routes with storage locations in the United States and reveals areas with significant overlap between the regional rail network and storage, including the Gulf Coast, Northeast, Midwest and Central Plains regions. Figure 6 also shows CCS projects in development or operation (U.S. Carbon, 2023), with areas of significant overlap in the Indiana/Illinois region, as well as Wyoming and Texas. It is not a coincidence that these selected and developing CCS projects are coterminous with storage basins, as this reduces or eliminates costly transportation. While this might not create immediate opportunities for rail transport, these areas should be monitored for the development of subsurface storage activity, e.g., toward the development of regional storage hubs, as rail could help move CO2 into these regions.
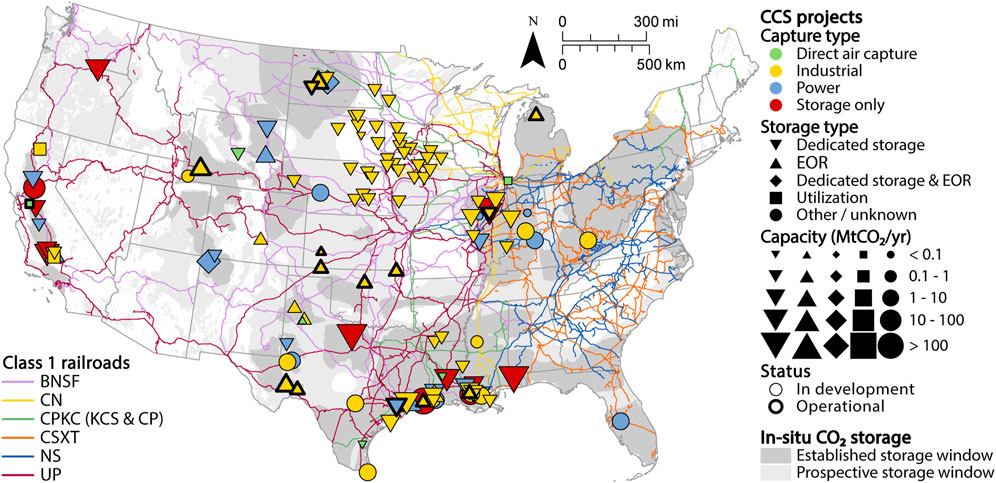
FIGURE 6. Map of Class I carrier railroads, viable sedimentary basins for CO2 storage, and planned or operational CCS projects in the U.S. (North American Rail Lines, 2023; Pett-Ridge et al., 2023; U.S. Carbon, 2023).
Additional CCS projects could be developed in areas where the combination of recent policy, such as the IRA amended 45Q tax credits, and low cost CCS, such as that associated with ethanol production, yield favorable economics. One region of interest is the Midwest ethanol Corridor (Figure 7). The region’s proximity to prime geologic storage, such as Illinois’ Mount Simon Sandstone and Williston Basin, underlying parts of the Dakotas, which are both active sequestration sites, make it a prime candidate for CCS development. Corn ethanol facilities in the Midwest are connected by small railroads that deliver feed directly to the facilities; carbon capture onsite can integrate with a rail-transport system instead of relying solely on pipeline. Smaller CO2 emitters like corn-ethanol plants would only require 4-6 tank cars per day to transport CO2.
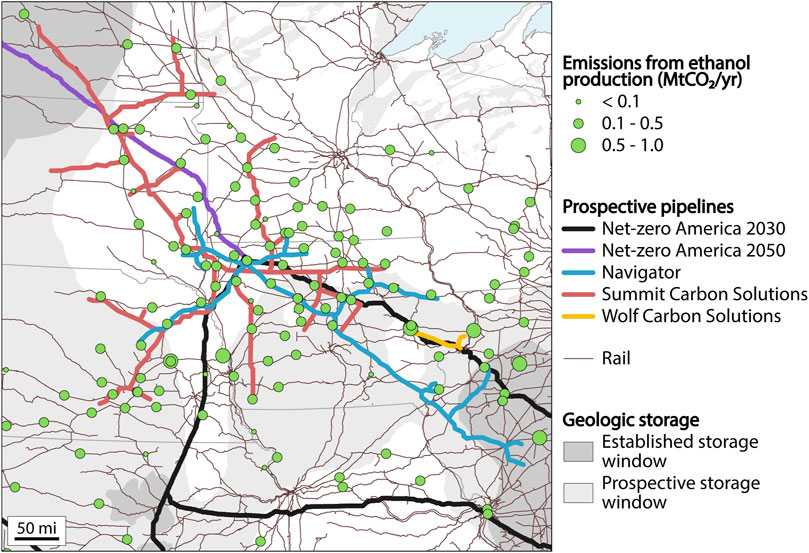
FIGURE 7. Spatial distribution of proposed pipelines, rail, ethanol plants, and in-situ geologic storage of CO2 in the midwestern United States (Pilorgé et al., 2020; Larson et al., 2021; North American Rail Lines, 2023; Pett-Ridge et al., 2023). Note that Wolf Carbon Solutions’ pipeline route extends to Decatur, Illinois, but the finalized path is not yet public as of the time of this writing. Pipelines are routed to collect CO2 from ethanol plants, while rail is already servicing the majority of them.
The opportunity for rail is further supported when considering pushback against the development of new pipeline infrastructure. This is exemplified as recently as late 2023 when the South Dakota Public Utilities Commission unanimously denied a carbon dioxide pipeline permit application by Summit Carbon Solution. The proposed $5.5 billion pipeline was intended to be built as part of a larger network spanning 5 states and over 5,000 miles, but due to failure to gain traction among landowners, the project was shut down in late 2023, citing safety concerns and harm to state residents (AP News, 2023). In another example, in late 2023 Navigator CO2 Ventures announced it had killed its proposed $3.5 billion cornbelt pipeline, 1300-mile carbon pipeline after South Dakota regulators had denied its request for permitting (Des Moines Register, 2023). Wolf Carbon Solutions has proposed a third pipeline in the region (which, as of this writing, is still undergoing ruling) but has faced major opposition, with Illinois Commerce Commission staff recommending its permit be denied (Northern Public Radio, 2023). The ruling is another data point in the larger trend of pipeline opposition, directly hindering efforts and funding meant to scale the CCS network to reach policy targets.
Despite the noted recent resistance to pipelines for CO2 transport, they are still heavily included in pathway modeling studies (Larson et al., 2021; Great Plains Institute, 2022; Pett-Ridge et al., 2023). These analyses have used point source CCS as a guide to rationalize pipeline routing; however, the emergence of carbon dioxide removal technologies with greater siting flexibility, like DAC and BiCRS, could expose gaps - and thus opportunities for rail - in bulk CO2 transport modeling. These emerging opportunities will need to consider proximal siting to renewable energy and waste biomass, respectively, which may constrain the opportunity to colocate with projected or planned pipelines. Figure 8 shows two categories of CO2 sourcing: (1) point source capture (CCS) to achieve reduced emissions in the industrial sector, using the carbon capture potential calculated in Pilorgé et al., 2020 (Pilorgé et al., 2020), and (2) DAC, using the deployment of renewable energy (solar, wind, and geothermal) as a proxy for the deployment of DAC paired with renewable energy, with solar and wind being deployed on converted land, and a high geothermal potential (Baruch-Mordo et al., 2019; Geothermal, 2023; Lebling et al., 2023). Figure 8 also includes two types of in-situ storage by injection of CO2 in the subsurface: (1) in sedimentary formations and (2) in deep basaltic formations (Pett-Ridge et al., 2023). The top panel shows a projected landscape in 2030, where CO2 storage in sedimentary formations at a price $40/tCO2 or lower is considered, while the lower panel shows the expanded landscape in 2050 and assumes future development in CO2 storage options to the full prospective storage window and deep basaltic formations. These map layers are juxtaposed against the Class I rail network (North American Rail Lines, 2023) and projected trunk pipelines (Larson et al., 2021). We make the assumption that trunk lines can serve CCS and DAC opportunities within 50 miles, beyond which other modes would be considered competitive options. This assumption could be considered conservative but takes into account the prohibitive economics and social license for extended, smaller volume “spur” pipelines that would be required to interface with a trunk pipeline network.
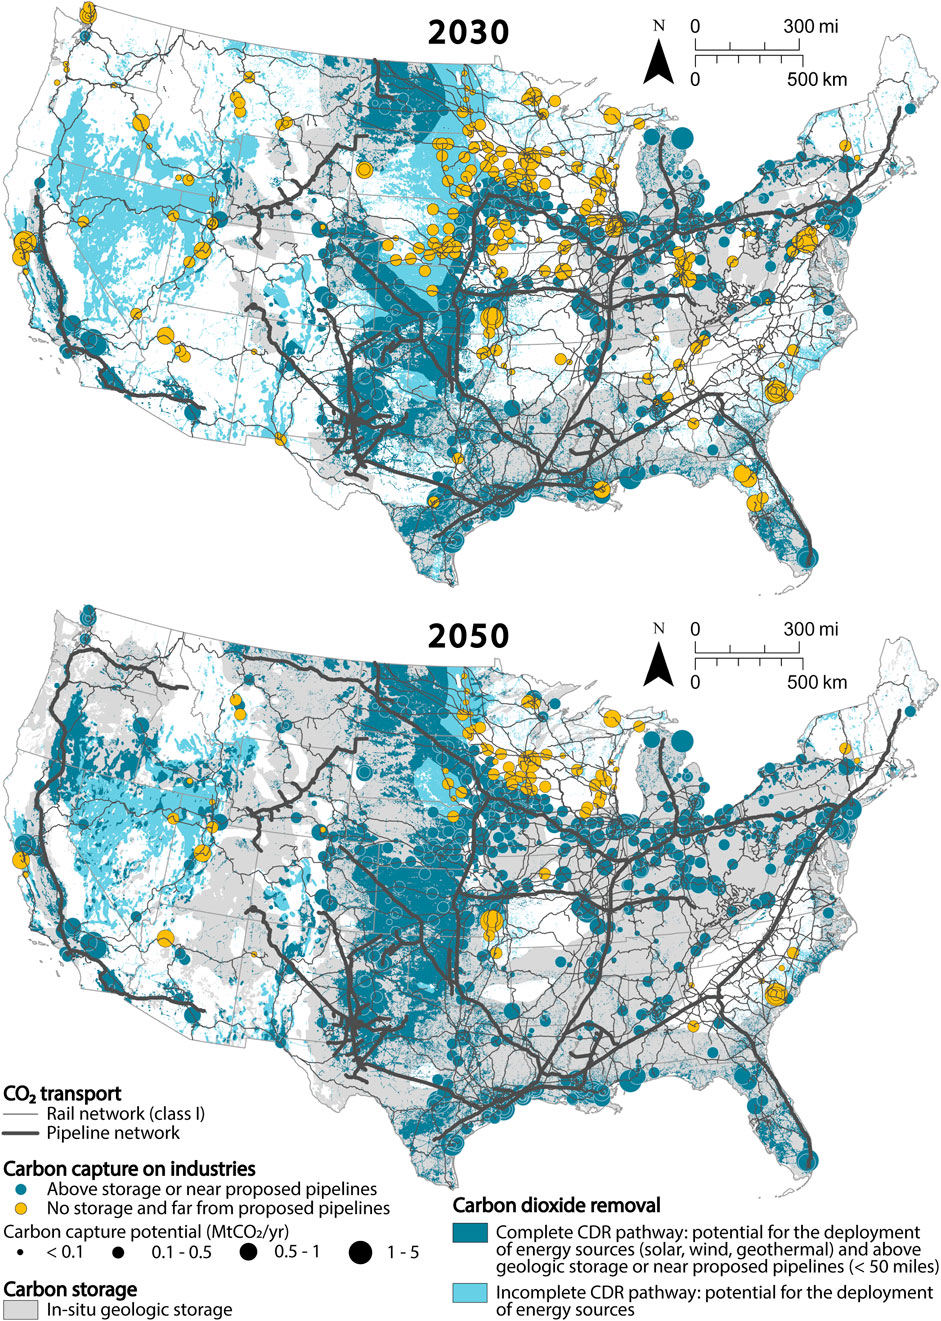
FIGURE 8. Opportunities for rail to serve carbon management (point source capture and storage, and direct air capture and storage) not co-located with storage and not serviced by pipelines in 2030 (top) and 2050 (bottom). The pipelines are proposed pipelines provided in the Princeton Net-zero America study for 2030 and 2050. Anything located 50 miles from pipelines is considered to be close enough to be serviced by spur lines connecting to the trunk lines. Storage is limited to cost lower than $40/tCO2 for 2030, and is extended to the full storage window in sedimentary formations and to basaltic formations in the Pacific Northwest for 2050 (Baruch-Mordo et al., 2019; Pilorgé et al., 2020; Larson et al., 2021; Geothermal, 2023; Lebling et al., 2023; North American Rail Lines, 2023).
Proposed trunk pipelines are mostly located in coastal states and in the Midwest while the rail network is already deployed in the entire contiguous United States. Pilorgé et al. (2020) have outlined the largest industrial emission sources and calculated the cost of capturing their process emissions, with the goal of prioritizing point source capture at these facilities. The total amount of capturable emissions was estimated at 200 MtCO2/yr. About 50.5% of these emissions are located above storage (<$40/tCO2 injected) and would not need to transport CO2 provided that an injection well is located nearby. Other facilities are located either not above storage, or above prospective storage, defined as locations with injection costs above $40/tCO2 in the established storage window, prospective storage windows in sedimentary formations, and deep basaltic formations. Because these regions are not yet fully vetted or represent cost-prohibitive economics, facilities in these locations are likely to need CO2 transport to viable injection sites. 58.2% of capturable emissions will be located less than 50 miles from trunk pipelines in 2030 (62.5% in 2050). This leaves 25.3% of the capturable emissions in 2030 (8.7% in 2050) without an on-site storage or CO2 pipeline transport option, 94.1% of them (95.0% in 2050) being located less than one mile from railroads, making rail a prime alternative to pipelines.
The Gulf Coast is already serviced by pipelines, with more proposed for 2030, and almost all industrial facilities could have access to on-site storage or pipeline transport. However, many areas of Texas would still be far from CO2 pipelines and rail could be an alternative to develop CDR pathways where storage cannot be done on site. In the Midwest, pipelines are also proposed, but the region being very large and servicing all ethanol plants would require deploying many smaller pipelines. Most ethanol plants are already connected to rail, which can be used to carry CO2 to storage sites in the Mount Simons sandstones, where CO2 is already injected in the subsurface at Decatur, Illinois. The region also has a high wind potential that could be leveraged to power DAC, with the dense rail network carrying CO2 to storage locations.
A trunk pipeline running through the Central Valley is proposed in California. Major CO2 sources in the Bay area are far from this trunk line, and building feeder pipelines through this densely populated area might be difficult. However, these industries are located near major seaports, well serviced by rail, that can connect them to the Central Valley and Kern county, where multiple Class VI wells permits have been filed (US EPA, 2023).
Apart from coastal states, the western United States does not have proposed pipelines, the rail network is also quite sparse, but tends to run close to major sources of CO2. For instance, the Salt Lake City area hosts several industrial sources of CO2, and the western United States has large geothermal resources that could be used as a low-carbon source of energy for DAC. Rail could carry the CO2 in Wyoming where there is ample subsurface storage capacity and strong support for storage development.
4 Conclusion
This study outlines the role that rail can play in the deployment of carbon management in the United States. The advantages of rail have been outlined: it relies mainly on existing infrastructure with established right of ways, is already being used to move millions of tonnes of CO2 in the US with a safe track record, and can be used as an instrument to offset economic fallout in coal communities. This study shows that strategic deployment of CO2 as a freight commodity to replace the declining movement of coal holds the potential to support up to 100 Mt/yr of CO2 movement and salvage up to 60,000 jobs, the majority of which exist in supply chain.
The nascent carbon management industry, encouraged by higher tax credits provided through the Inflation Reduction Act, does not yet handle large amounts of CO2 compatible with a country wide pipeline infrastructure in most regions of the United States. Rail could ease that transition by providing an alternative cost-competitive transport option compared to pipelines for volumes under 2 MtCO2/yr. Further, regional analysis shows that rail could serve “stranded” CCS assets, where over 94% of these facilities are located within 1-mile of railroad. In cases where pipeline has failed, such as in the movement of CO2 derived from ethanol fermentation in the Midwest, rail exists as the next viable option, with most of these facilities being already connected with the rail network. Finally, rail can play a large role in the support of nascent CDR scale-up, particularly in regions that are not projected to be serviced by massive CO2 trunk pipelines, yet hold great promise for CDR development, such as the Western and Northern US, which have strong renewable energy potential and waste biomass availability, respectively.
Data availability statement
The original contributions presented in the study are included in the article/Supplementary Material, further inquiries can be directed to the corresponding author.
Author contributions
AH: Conceptualization, Data curation, Formal Analysis, Investigation, Methodology, Writing–original draft, Writing–review and editing. DG: Data curation, Formal Analysis, Writing–original draft. HP: Conceptualization, Data curation, Formal Analysis, Investigation, Methodology, Supervision, Visualization, Writing–original draft, Writing–review and editing. PP: Conceptualization, Data curation, Formal Analysis, Funding acquisition, Investigation, Methodology, Resources, Supervision, Validation, Visualization, Writing–original draft, Writing–review and editing.
Funding
The authors declare that this study received funding from ClimateWorks Foundation and from the Kleinman Center for Energy Policy. The funders were not involved in the study design, collection, analysis, interpretation of data, the writing of this article, or the decision to submit it for publication.
Acknowledgments
We thank Ian Lee for his contributions to the risk analysis and Ben Kolosz for his guidance on the social LCA. We also acknowledge Linda Glauber, Andy Friel, Adam Anderson and Bob Tuchek of RSI Logistics for their countless insights into rail commodity pricing.
Conflict of interest
The authors declare that the research was conducted in the absence of any commercial or financial relationships that could be construed as a potential conflict of interest.
Publisher’s note
All claims expressed in this article are solely those of the authors and do not necessarily represent those of their affiliated organizations, or those of the publisher, the editors and the reviewers. Any product that may be evaluated in this article, or claim that may be made by its manufacturer, is not guaranteed or endorsed by the publisher.
Supplementary material
The Supplementary Material for this article can be found online at: https://www.frontiersin.org/articles/10.3389/fenrg.2023.1343085/full#supplementary-material
References
ADL Ventures (2023). Why appalachia could become the silicon valley of industrialized construction. Boston, Massachusetts: ADL Ventures. Available at: https://www.adlventures.com/blogs/why-appalachia-could-become-the-silicon-valley-of-industrialized-construction (Accessed November 15, 2023).
AP News (2023). South Dakota panel denies application for CO2 pipeline; Summit to refile for permit. New York United States: AP News. Available at: https://apnews.com/article/south-dakota-north-dakota-co2-pipeline-summit-827c7418edba5a4ecbd7501be02d84f9 (Accessed September 22, 2023).
Baruch-Mordo, S., Kiesecker, J. M., Kennedy, C. M., Oakleaf, J. R., and Opperman, J. J. (2019). From Paris to practice: sustainable implementation of renewable energy goals. Environ. Res. Lett. 14 (2), 024013. doi:10.1088/1748-9326/aaf6e0
Broecks, K., Jack, C., ter Mors, E., Boomsma, C., and Shackley, S. (2021). How do people perceive carbon capture and storage for industrial processes? Examining factors underlying public opinion in The Netherlands and the United Kingdom. Energy Res. Soc. Sci. 81, 102236. doi:10.1016/j.erss.2021.102236
Bureau of Transportation Statistics (2023). Commodity flow Survey (CFS) | Bureau of transportation statistics. Available at: https://www.bts.gov/cfs (Accessed November 14, 2023).
Carload Waybill Sample (2023). Surface transportation board. Available at: https://www.stb.gov/reports-data/waybill/ (Accessed November 14, 2023).
Coal Mines (2023). Coal mines. Available at: https://atlas.eia.gov/datasets/eia::coal-mines-1/explore?location=38.959589,-90.664417,4.90 (Accessed November 13, 2023).
Cumming, L., Hawkins, J., Sminchak, J., Valluri, M., and Gupta, N. (2019). Researching candidate sites for a carbon storage complex in the central appalachian basin, USA. Int. J. Greenh. Gas. Control 88, 168–181. doi:10.1016/j.ijggc.2019.05.030
Deparment of Transportation (2011). Top consequence hazardous materials by commodities and failure modes. Available at: https://www.phmsa.dot.gov/sites/phmsa.dot.gov/files/docs/Top%20Consequence%20Hazardous%20Materials%20Commodities%20Report.pdf.
Des Moines Register (2023). Navigator kills carbon pipeline for Iowa, South Dakota, other states. Available at: https://www.desmoinesregister.com/story/money/business/2023/10/20/navigator-kills-its-carbon-capture-pipeline-in-iowa-other-states-ethanol-poet/71253882007/ (Accessed November 14, 2023).
Economic Data. (2023). Surface transportation board. Available at: https://www.stb.gov/reports-data/economic-data/ (Accessed 2023-November-14).
Enerdata (2023). Research on energy efficiency, CO2 emissions, energy consumption, forecast. Available at: https://www.enerdata.net/ (Accessed November 13, 2023).
FECM (2021). Infographic: carbon capture and storage. Available at: https://www.energy.gov/fecm/articles/infographic-carbon-capture-and-storage (Accessed April 07, 2023).
FECM (2022). Carbon negative shot. Washington D.C.: USDOE. Available at: https://www.energy.gov/fecm/carbon-negative-shot.
Freme, F. U. S. (2008). Coal supply and demand: 2008 review. Washington D.C.: U.S. Energy Information Administration. Available at: https://www.eia.gov/coal/review/pdf/feature08.pdf (Accessed November 01, 2023).
Geothermal (2023). Geothermal resource data, tools, and maps. Available at: https://www.nrel.gov/gis/geothermal.html (Accessed November 13, 2023).
Geske, J., Berghout, N., and van den Broek, M. (2015). Cost-effective balance between CO2 vessel and pipeline transport. Part I – impact of optimally sized vessels and fleets. Int. J. Greenh. Gas. Control 36, 175–188. doi:10.1016/j.ijggc.2015.01.026
Global CCS Institute (2023). Scaling up CO2 pipeline deployment in the U.S. - findings from listening sessions hosted by the global CCS Institute. Available at: https://www.globalccsinstitute.com/news-media/insights/scaling-up-co2-pipeline-deployment-in-the-u-s-findings-from-listening-sessions-hosted-by-the-global-ccs-institute/ (Accessed November 15, 2023).
Gough, C., O׳Keefe, L., and Mander, S. (2014). Public perceptions of CO2 transportation in pipelines. Energy Policy 70, 106–114. doi:10.1016/j.enpol.2014.03.039
Great Plains Institute (2022). An atlas of carbon and hydrogen hubs for United States decarbonization. Available at: https://carboncaptureready.betterenergy.org/analysis/ (Accessed November 15, 2023).
IEA (2020). CCUS in clean energy transitions. Energy Technol. Perspect. Available at: https://www.iea.org/reports/ccus-in-clean-energy-transitions, License: CC BY 4.0
IPCC (2022). Global warming of 1.5°C: IPCC special report on impacts of global warming of 1.5°C above pre-industrial levels in context of strengthening response to climate change, sustainable development, and efforts to eradicate poverty. 1. Cambridge: Cambridge University Press. doi:10.1017/9781009157940
Jackson, R., Bowen, E., Deskins, J., and Lego, B. (2023). An economic analysis of the appalachian coal industry ecosystem: summary report; appalchian regional commission. Available at: https://www.arc.gov/wp-content/uploads/2018/01/ (Accessed August 01, 2023).
Larson, E., Chris, G., Jenkins, J., Mayfield, E., Pascale, A., Zhang, C., et al. (2021). Net-zero America. Princeton, NJ: Princeton University. Available at: https://netzeroamerica.princeton.edu/ (Accessed November 14, 2023).
Lebling, K., Leslie-Bole, H., Bridgewater, E., Byrum, Z., Pilorge, H., and Psarras, P. (2023). Direct air capture: assessing impacts to enable responsible scaling. Washington D.C.: World Resources Institute. Available at: https://publications.wri.org/scaling-dac-in-the-us/introduction (Accessed November 13, 2023).
Lu, H., Ma, X., Huang, K., Fu, L., and Azimi, M. (2020). Carbon dioxide transport via pipelines: a systematic review. J. Clean. Prod. 266, 121994. doi:10.1016/j.jclepro.2020.121994
Metz, B., Davidson, O., de Coninck, H., Loos, M., and Meyer, L. (2005). Intergovernmental panel on climate change special report on carbon dioxide capture and storage. Cambridge: Cambridge University Press.
Middleton, R. S., Yaw, S. P., Hoover, B. A., and Ellett, K. M. (2020). SimCCS: an open-source tool for optimizing CO2 capture, transport, and storage infrastructure. Environ. Model. Softw. 124, 104560. doi:10.1016/j.envsoft.2019.104560
Morgan, D., Guinan, A., and Sheriff, A. (2022). FECM/NETL CO2 transport cost model, 2022, description and user’s manual; DOE/NETL-2022/3218. Morgantown, West Virginia: National Energy Technology Laboratory.
North American Rail Lines (2023). North American rail lines. Available at: https://hub.arcgis.com/datasets/fedmaps::north-american-rail-lines-1/explore (Accessed November 13, 2023).
Northern Public Radio (2023). Illinois Commerce commission staff recommend denial of Wolf carbon Solutions pipeline permit. Northern public Radio: WNIJ and WNIU. Available at: https://www.northernpublicradio.org/illinois/2023-10-26/illinois-commerce-commission-staff-recommend-denial-of-wolf-carbon-solutions-pipeline-permit (Accessed November 14, 2023).
Pett-Ridge, Jennifer, Aines, Roger D., Ammar, Hamed Ziad, Aui, Alvina, Baker, Sarah F., et al. (2023). Roads to removal: options for carbon dioxide removal in the United States; LLNL-TR-852901.2023.12.07. Livermore, California: Lawrence Livermore National Laboratory. Available at: https://roads2removal.org/.
Pilorgé, H., McQueen, N., Maynard, D., Psarras, P., He, J., Rufael, T., et al. (2020). Cost analysis of carbon capture and sequestration of process emissions from the U.S. Industrial sector. Environ. Sci. Technol. 54 (12), 7524–7532. doi:10.1021/acs.est.9b07930
Pipeline and Hazardous Materials Safety Administration (2023). Pipeline and hazardous materials safety administration. Available at: https://www.phmsa.dot.gov/ (Accessed November 15, 2023).
Psarras, P., He, J., Pilorgé, H., McQueen, N., Jensen-Fellows, A., Kian, K., et al. (2020). Cost analysis of carbon capture and sequestration from U.S. Natural gas-fired power plants. Environ. Sci. Technol. 54 (10), 6272–6280. doi:10.1021/acs.est.9b06147
Psarras, P. C., Comello, S., Bains, P., Charoensawadpong, P., Reichelstein, S., and Wilcox, J. (2017). Carbon capture and utilization in the industrial sector. Environ. Sci. Technol. 51 (19), 11440–11449. doi:10.1021/acs.est.7b01723
Reuters. U.S (2023). coal-fired power plants scheduled to shut. Toronto, Canada: Reuters. Available at: https://www.reuters.com/business/energy/us-coal-fired-power-plants-scheduled-shut-2021-10-28/ (Accessed November 13, 2023).
Righetti, T. K. (2017) Siting carbon dioxide pipelines rochester, NY. November 1 Available at: https://papers.ssrn.com/abstract=3347338 (Accessed November 13, 2023).
Road Scholar Transport (2023). Industry in demand of hazmat certified drivers hazmat shipping services available. Road scholar. Available at: https://roadscholar.com/business/hazmat-shipping-services/ (Accessed November 15, 2023).
Roussanaly, S., Brunsvold, A. L., and Hognes, E. S. (2014). Benchmarking of CO2 transport technologies: Part II – offshore pipeline and shipping to an offshore site. Int. J. Greenh. Gas. Control 28, 283–299. doi:10.1016/j.ijggc.2014.06.019
Roussanaly, S., Skaugen, G., Aasen, A., Jakobsen, J., and Vesely, L. (2017a). Techno-economic evaluation of CO2 transport from a lignite-fired IGCC plant in the Czech republic. Int. J. Greenh. Gas. Control 65, 235–250. doi:10.1016/j.ijggc.2017.08.022
Roussanaly, S., Skaugen, G., Aasen, A., Jakobsen, J., and Vesely, L. (2017b). Techno-economic evaluation of CO2 transport from a lignite-fired IGCC plant in the Czech republic. Int. J. Greenh. Gas. Control 65, 235–250. doi:10.1016/j.ijggc.2017.08.022
RSI Logistics (2023). RSI logistics | rail logistics software and services. Available at: https://www.rsilogistics.com/ (Accessed November 16, 2023).
Schmitt, T., Leptinsky, S., Turner, M., Zoelle, A., White, C. W., Hughes, S., et al. (2022). Cost and performance baseline for fossil energy plants volume 1: bituminous coal and natural gas to electricity. Pittsburgh, PA, Morgantown, WV, and Albany, OR (United States): National Energy Technology Laboratory NETL. DOE/NETL-2023/4320. doi:10.2172/1893822
Smith, E., Morris, J., Kheshgi, H., Teletzke, G., Herzog, H., and Paltsev, S. (2021). The cost of CO2 transport and storage in global integrated assessment modeling. Int. J. Greenh. Gas. Control 109, 103367. doi:10.1016/j.ijggc.2021.103367
Stolaroff, J. K., Pang, S. H., Li, W., Kirkendall, W. G., Goldstein, H. M., Aines, R. D., et al. (2021). Transport cost for carbon removal projects with biomass and CO2 storage. Front. Energy Res. 9, 9. doi:10.3389/fenrg.2021.639943
Surface Transportation Board (2023). Surface transportation board. Available at: https://www.stb.gov/reports-data/waybill/ (Accessed November 13, 2023).
Tcvetkov, P., Cherepovitsyn, A., and Fedoseev, S. (2019). Public perception of carbon capture and storage: a state-of-the-art overview. Heliyon 5 (12), e02845. doi:10.1016/j.heliyon.2019.e02845
The Association of American Railroads (AAR) (2023). The association of American railroads (AAR). Available at: https://www.aar.org/ (Accessed November 15, 2023).
Uniform Rail Costing System (URCS) (2023). Surface transportation board. Available at: https://www.stb.gov/reports-data/uniform-rail-costing-system/ (Accessed November 13, 2023).
U.S. Carbon (2023). Capture project map. Clean air task force. Available at: https://www.catf.us/ccsmapus/ (Accessed November 15, 2023).
US Department of Transportation (2023). Maday - 2022 CO2 freight transportation workshop. Available at: https://usea.org/sites/default/files/event-/Maday%20-%202022%20CO2%20Freight%20Transportation%20Workshop.pdf (Accessed April 14, 2023).
US Energy Information Administration (2023a). SAS output. Available at: https://www.eia.gov/electricity/annual/html/epa_04_01.html (Accessed November 14, 2023).
US Energy Information Administration (2023b). Today in energy. Available at: https://www.eia.gov/todayinenergy/detail.php?id=54559 (Accessed November 14, 2023).
US Energy Information Administration (2023c). Use of coal - U.S. Energy information administration (EIA). Available at: https://www.eia.gov/energyexplained/coal/use-of-coal.php (Accessed November 14, 2023).
Us Epa, O. (2023). Table of EPA’s draft and final Class VI well permits. Available at: https://www.epa.gov/uic/table-epas-draft-and-final-class-vi-well-permits (Accessed November 14, 2023).
Keywords: carbon management, CO2 transport, coal industry, carbon capture and storage, rail freight
Citation: Ho A, Giannopoulos D, Pilorgé H and Psarras P (2024) Opportunities for rail in the transport of carbon dioxide in the United States. Front. Energy Res. 11:1343085. doi: 10.3389/fenrg.2023.1343085
Received: 22 November 2023; Accepted: 26 December 2023;
Published: 22 January 2024.
Edited by:
Zequn Yang, Central South University, ChinaReviewed by:
Junwei Yang, City University of Hong Kong, Hong Kong SAR, ChinaFeng Xin, Changsha University of Science and Technology, China
Copyright © 2024 Ho, Giannopoulos, Pilorgé and Psarras. This is an open-access article distributed under the terms of the Creative Commons Attribution License (CC BY). The use, distribution or reproduction in other forums is permitted, provided the original author(s) and the copyright owner(s) are credited and that the original publication in this journal is cited, in accordance with accepted academic practice. No use, distribution or reproduction is permitted which does not comply with these terms.
*Correspondence: Peter Psarras, cHNhcnJhc0BzZWFzLnVwZW5uLmVkdQ==