 Wentao Liu1
 Guanglei Huang
- 1Shenzhen Power Supply Company, China Southern Power Grid, Shenzhen, China
- 2Electric Power Research Institute, China Southern Power Grid, Guangzhou, China
With the advent of the energy Internet and the swift growth of unified energy systems, the comprehensive energy demand of users has gradually become a problem that cannot be ignored for the planning of integrated energy systems. Aiming at this problem, this paper suggests a multi-agent planning approach for electricity and gas, considering users’ holistic energy consumption behavior. First, utilizing a combined subjective and objective weighting method, this study establishes a utility model for users’ energy consumption characteristics. The analysis of comprehensive energy consumption behavior is conducted through an evolutionary game. On this basis, the planning revenue model for electricity grid and gas network investors is formulated, and the game mechanism of different investors is analyzed. A dynamic game model of electricity–gas multi-agent planning considering comprehensive energy consumption behavior is proposed. Ultimately, the model is resolved using an iterative exploration approach. The validity and efficacy of the proposed method are confirmed through a simulation example.
1 Introduction
Given the growing prominence of environmental issues and the scarcity of energy resources, the unified energy system, capable of overcoming diverse energy obstacles and enhancing energy efficiency, has developed rapidly in recent years (Sheng et al., 2019; Wu et al., 2019; Zang et al., 2022). Within the unified energy framework, on one hand, users have more choices of energy use, and various energy systems are more closely linked (Dou et al., 2020a; Huang et al., 2020a; Yang et al., 2022a). At this time, neglecting users’ comprehensive energy usage behavior makes it challenging to guarantee the economic, safety, and reliable aspects of the planning scheme (Chen et al., 2021; Zhang et al., 2022). On the other hand, due to the existence of multiple investors such as power generators, transmission companies, and natural gas operators, it is difficult for the current planning method to take into account the interests of each investor in the market (Shen et al., 2021; Li et al., 2023). Therefore, there is an immediate need to conduct research on the multi-agent planning method for electricity and gas, taking into account the overall energy utilization patterns of users.
At present, several researchers have explored the cooperative planning of an integrated electricity–gas energy system involving multiple agents (Wang et al., 2023; Zhang et al., 2023). Hu et al. (2017) filled in the blank of the research on the joint planning problem of the electricity–gas integrated energy system in China. By linearizing the gas flow constraints of the non-linear natural gas pipeline, the initial intricate non-linear non-convex programming problem is converted into a more manageable mixed-integer linear programming challenge. Unsihuay et al. (2010) built an electricity–gas joint planning model, considering electricity market and natural gas market transactions on an energy engineering simulation platform. A planning model encompassing multiple stages for electricity generation, the natural gas network, and power grid is outlined in Barati et al. (2015).
Nevertheless, within an actual integrated energy system, different investors may undertake the investment and construction of the power network and the natural gas network. These investors have independent interest demands, and their decision-making behavior is driven by individual rationality, leading to equilibrium outcomes in the gaming process (Fang et al., 2022; Xu et al., 2023; Yu et al., 2023). In this case, on one hand, the planning model, grounded in comprehensive rationality, struggles to adequately capture the prevalent multi-agent gaming dynamics in real-world integrated energy systems (Li Z. et al., 2020a; Yang et al., 2022b; Yu et al., 2022). Conversely, the comprehensive perspective in planning makes it challenging to consider the preferences of each market investor, consequently diminishing market vitality (Liao et al., 2018; Zheng et al., 2018; Yang et al., 2021). In view of the above problems, in Yang et al. (2020), each energy unit, along with electric and gas network companies, is treated as a distinct interest group, considers maximizing the annual net income as the optimization goal, and establishes a comprehensive non-linear programming model for wind-generating units, gas-generating units, and power-gas integrated systems involving electric-to-gas generators, transmission lines, and natural gas pipelines. A cooperative planning approach for an electricity–gas system is suggested, utilizing non-cooperative game theory. Dai et al. (2023) established planning models for power network and natural gas network investors individually, scrutinized the game dynamics among diverse investors, and put forth a dynamic gaming model for collaborative planning in an integrated electricity–natural gas energy system.
The above research has effectively solved the multi-agent gaming dynamics widely existing within the unified energy framework (Fu et al., 2023), but with the increasing diversification of energy types available for people during energy utilization, the user’s selection of comprehensive energy use has gradually become a factor that cannot be ignored for the design of an integrated electricity–gas energy system (Zhou and Zhao, 2013; Wang et al., 2021; Zhu et al., 2023). Failure to consider the holistic energy consumption patterns of users will reduce the accuracy and effectiveness of the planning scheme (Gao et al., 2021; Li et al., 2021). Based on the data-driven idea, Li J. et al. (2020b) proposed a method for analyzing user energy consumption behavior by introducing the method of deep learning. Dou et al. (2020b) examined the node energy cost by formulating the node energy equilibrium equation and quantified the valuation of user energy consumption in the node area based on the node energy price and the user market consumption surplus so as to analyze the energy usage patterns of the user. Huang et al. (2020b) developed a utility model using a method that combines subjective and objective factors, considering the user’s energy consumption traits and comfort preferences. This approach is used to assess the energy utilization patterns of diverse users. The above studies have analyzed the amalgamated energy usage patterns of users, but they have not considered the planning of a unified energy system. At present, there is limited research on designing integrated energy systems that account for the comprehensive energy usage patterns of users.
In view of this, this paper proposes a collaborative planning approach for an integrated electricity and gas energy system using multi-agent methods combined with game theory under the background of user integrated energy consumption. First, using a combined subjective and objective weighting approach, a model is developed to capture the energy consumption traits of users, and an evolutionary game is used to assess the overall energy consumption behavior of users (Huang et al., 2016; Li et al., 2019; Murty and Kumar, 2020; Zhu et al., 2021). On this basis, a profit model for investors in the electricity and natural gas networks is formulated, the game mechanism of different investors is analyzed, and a dynamic game model of electric-gas multi-agent planning considering the holistic energy usage patterns of users is proposed. Finally, the model is solved using an iterative search approach.
The key contributions of this paper include the following:
Compared with the traditional methods, to enhance the dependability of the planning outcomes, this paper focuses on the combined electricity and gas energy system planning problem under the background of the comprehensive energy consumption of users. By constructing the model capturing users’ energy characteristic consumption characteristics, the all-encompassing energy usage patterns of users is analyzed by using the evolutionary game. On this basis, the game relationship between different investors is fully considered, which can not only ensure the economy and safety of planning and decision-making from the overall perspective of the integrated energy system combining electricity and natural gas but also ensure the security and dependability of the planning and decision-making. It also guarantees that every participant optimizes their gains throughout the gaming process, thus boosting the market dynamism of the integrated energy system and the efficiency of planning and decision-making. The simulation outcomes demonstrate the validity and efficacy of the proposed approach.
2 Analyzing the holistic energy usage patterns of users
In this paper, examining users’ holistic energy usage patterns, the user utility model is studied by selecting the energy utility evaluation index and analyzing the energy usage traits of residential, extensive industrial, and commercial user segments.
2.1 Construction of the utility index
In order to reflect users’ utility objectively and truly, based on the aforementioned literature, this paper comprehensively and systematically selects users’ utility indicators from three dimensions of economic benefits, social benefits, and security benefits. Through further analysis, the four indexes affecting the user’s behavior of choosing the energy supplier are obtained as follows: economic benefit (comprehensive energy cost A1), social benefits (energy supply occupancy A2 and user comfort A3), and safety benefits (energy supply reliability A4).
(1) Comprehensive energy expenditure
In this paper, the life cycle cost (LCC) theory is introduced to describe the index (Fang, 2008), which mainly considers the system investment, installation, and ongoing maintenance expenses. Then, the life cycle cost can be written as
where LCC represents the life cycle cost; IC denotes the initial capital outlay; OC stands for the operational and maintenance expenses; and DC is the residual value.
1) Initial investment cost (IC):
where
2) Operation and maintenance cost (OC):
where
3) Scrap disposal cost (DC)
DC covers the cost and income of the disposal of scrapped equipment, which is selected according to the residual value rate of energy equipment, and takes into account the correction of various economic factors, so the LCC formula is shown in Formula 5. Assuming that the study period is T, if the user category m selects the energy type n in the study period, the mathematical model of the user category m selecting the energy type n calculated by LCC is shown in Formula 6:
where y is the number of years in the economic life cycle and i is the discount rate.
(2) Occupancy of energy supply
In this paper, the categorization is based on the user type and load usage, with the specific formula as follows:
In the above equation,
(3) User comfort
In this research, we use an exponential function to represent the user comfort index, incorporating the influence of environmental factors. The specific formula is detailed below:
where
(4) Reliability of energy supply
In this paper, the user’s effective energy supply time ratio to the overall study period is utilized as the metric for assessing the reliability of energy supply, and the precise formula is provided as follows:
where
2.2 User utility analysis based on the combination weighting method
Building the user utility function requires the consideration of various indicators, each exerting a distinct impact on the user utility index system. This study uses the concept of combined weighting to compute the weight index (Guo et al., 2017), that is, the weight values for the user utility index, considering both subjective and objective factors, are calculated by AHP and the variation coefficient method respectively, and the combination weight value is finally obtained according to the energy preference coefficient α. Moreover, then a user utility function model is constructed.
2.2.1 Subjective weight calculation based on AHP
As a commonly used subjective weighting method, AHP is used to solve the subjective weights of the four indicators in this paper. The procedural steps are outlined as follows.
(1) The above four indicators are evaluated according to expert experience,
(2) The remaining elements in the matrix are determined by the transitivity of the index importance degree, and the judgment matrix (four-order square matrix) is obtained.
(3) After the consistency test, the subjective weight value
where
2.2.2 Calculation of objective weight based on the variation coefficient method
Considering the dynamic characteristics of A1, A2, A3, and other indicators, the coefficient of variation approach is used to solve the objective weight value. In this method, the weight value is proportional to the degree of variation, which can quantitatively measure the importance of indicators. The calculation steps are as follows.
(1) Standardizing each index
It is assumed that the four evaluation indexes before and after the user’s decision are
where
(2) Solving the coefficient of variation
where
The objective weight value
2.2.3 Determination of combination weight values
The combined weight value is calculated as follows:
where
The index values are calculated in combination with Formulas 1–14, and after the indexes are normalized, the index values are combined with the weight values of Formula 15 for weighting operation, thus deriving the utility function for the chosen energy type n by users of the type m.
In the user utility function, A1, A2, and A3 indexes are related to the user group characteristics and group status, that is, their values will be constantly updated in the dynamic evolution.
2.3 Decision-making regarding users’ energy consumption behavior using evolutionary game theory
2.3.1 Evolutionary game model
The utility obtained by different types of users of the type m choosing the energy type is analyzed by the evolutionary game method. First, power providers and gas distributors disseminate relevant energy supply details to distinct user categories individually. Second, the user calculates the utility of selecting the energy type n according to Formula 16. Then, the utility model is evaluated to determine the three key elements in the evolutionary game, and based on this, the game strategy is updated. In addition, the energy supplier adjusts the energy supply utilization rate based on the current user group’s selection status and communicates the updated rate to the three user types. Both parties reach the ultimate equilibrium state during the evolutionary game progression.
The in-area user population state can be represented by the matrix Y as
When selecting the energy type, the user will revise the utility function according to the change in current index information and complete the optimization of adjusting their strategy based on the utility function. Hence, the introduction of the correction factor
The initial and second terms on the right side of Formulas 17, 18 represent the percentage of users in category m transitioning from selecting alternative policies to policy n and from policy n to opting for alternative policies, respectively. Among them,
The dynamic transformation equation for the terminal user group is acquired by substituting the preceding equation into Formula 19 as follows:
As the energy consumption ratio for extensive industrial and commercial users is constrained by actual production and the capacity for energy load absorption is restricted, the constraint conditions for selecting the proportion of users with the corresponding load are as follows Formulas 20, 21:
3 Benefit model of each planning agent in the electricity–gas network
The power network is divided into two main bodies, namely, electricity generation firms and transmission grid companies, and the natural gas network mainly includes natural gas operators. The variance in total revenue from energy sales and the total cost of the above subjects is taken as the planning revenue function and constrained, and finally, the planning revenue model of each subject is constructed.
3.1 Generator planning revenue
Its income is mainly the electricity sales revenue
where t is the horizontal year; T is the horizontal annual total; and
3.2 Planning income of the transmission grid operator
Its revenue mainly consists of electricity sales revenue
where
3.3 Natural gas operator planning revenue
The revenue of natural gas operators is mainly gas sales revenue
where
3.4 Network constraints
3.4.1 Electrical constraints
In the Formulas 38–42, EG, LN, and KN are associated matrixes of generators, transmission lines, loads and power network nodes, respectively. z is the generator number;
3.4.2 Constraints on coupled nodes
In Formulas 43, 44, c is the coupling node;
3.4.3 Natural gas constraint
In Formulas 45–48,
4 Electricity–gas multi-agent planning considering energy consumption behavior of users
4.1 Planning ideas
In this section, the planning decisions of the generator, the transmission grid provider, and the natural gas operator (all of whom are familiar with all the strategic information about the other party) are the new construction schemes of GU, transmission line, and pipeline, respectively. The three-party game framework is shown in Figure 1. All three parties decide with the aim of optimizing their individual gains. Taking the first round game as an example, the generator first optimizes the new GU construction scheme based on the gas network information at the coupling nodes and makes a decision. The transmission network provider obtains the above information and then updates the line decision scheme. After solving the power flow, the coupling node receives the information from the grid side, transmits it to the natural gas operator, completes the optimization of the pipeline scheme, and then makes a decision. Then, the user calculates the utility of the selected energy type n according to Eq. 16. Then, the utility model is evaluated to determine the three key elements of the evolutionary game, and based on this, the game strategy is updated. The power supplier updates the power supply share according to the selection status of the current user group and releases it to the three types of users. The two sides achieve the final evolutionary equilibrium state in the process of the evolutionary game. The Nash equilibrium solution (that is, the user’s energy consumption data) is passed to the operators of natural gas, transmission lines, and pipelines, and the three are combined with the user’s energy consumption data to carry out the game among the three, as shown in Figure 2.
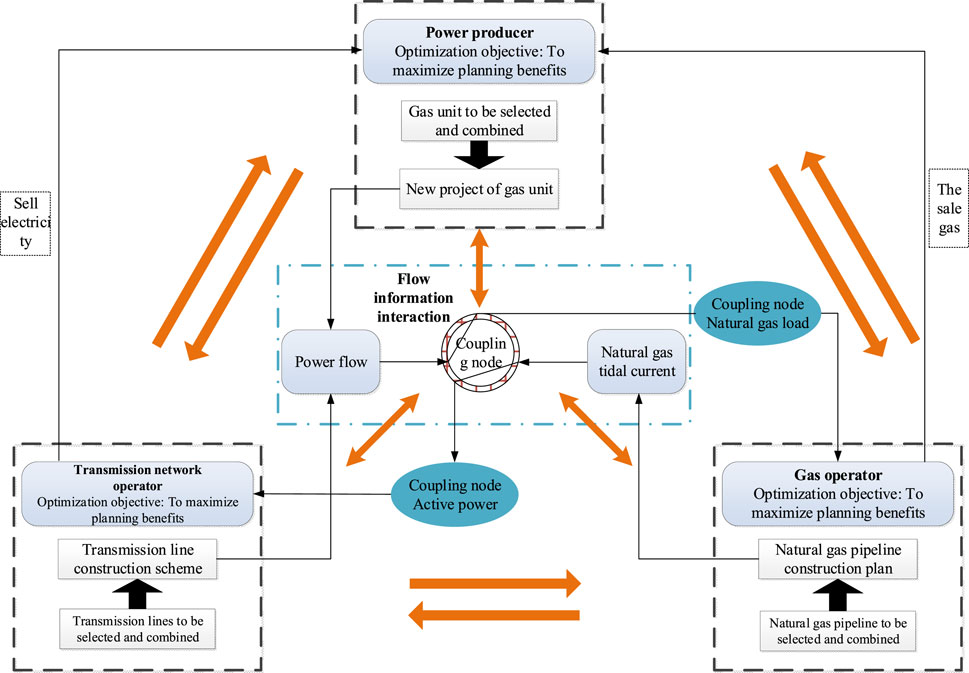
FIGURE 1. Three-game framework.
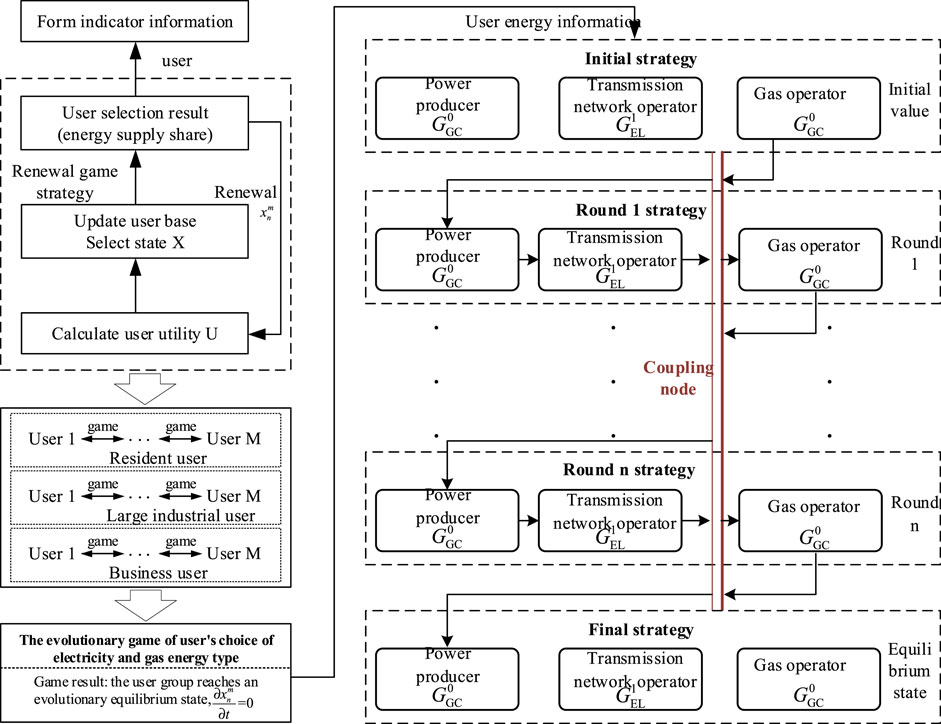
FIGURE 2. Game behavior diagram.
4.2 Solution of the model
The Nash equilibrium is solved using an iterative search method, and the specific solving steps are as follows:
(1) User energy consumption information is updated, and load data, initial network topology parameters, electricity price, gas price, GU and coal unit parameters are initiated to be selected, in addition to GU cost, transmission line and natural gas pipeline cost, and other related system parameters.
(2) A set is generated to be selected of GU, the power transmission line, and gas transmission pipeline, comprising the strategy set of the game players.
(3) A group of planning strategy schemes of three main bodies is randomly selected as an initial value.
(4) The initial value of iteration is set as
(5) Dynamic game among the three subjects of power generation companies, transmission grid operators, and natural gas operators.
(6) Whether the Nash equilibrium state is reached is checked. If not, return to the step (5); if so, the equilibrium solution of the model is output.
5 Example simulation and analysis
5.1 Explanation of examples
In this study, the dynamic decision-making process among residential, industrial, and commercial users, as well as the selection of electricity and gas energy types, is examined. On this basis, based on the integrated energy network of 15-bus natural gas network and IEEE24-bus power system, the planning and decision-making ideas of the three main bodies are analyzed. The economic life cycle in index A1 is 10 years; the discount rate is 7%; and its parameters
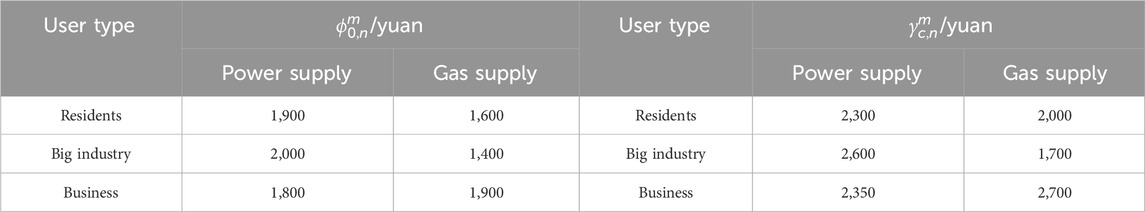
TABLE 1. Parameter values of

TABLE 2. Parameter value of
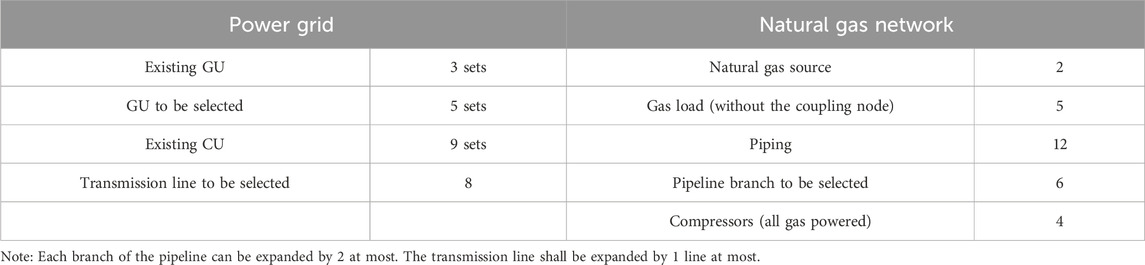
TABLE 3. Grid topology structure.
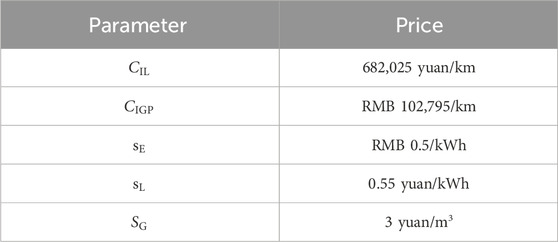
TABLE 4. Parameter value.
5.2 Case result
To mitigate the influence of substantial fluctuations in energy load on the assessment outcomes of end-user utility,
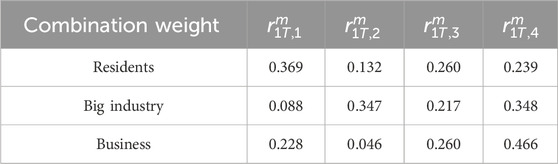
TABLE 5. Combination weight of each type of user index.
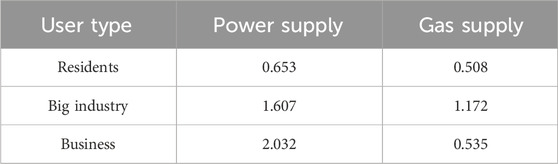
TABLE 6. Users’ utility function values.
On the basis of determining the user’s energy consumption behavior, this paper sets up two examples for IES planning and compares the calculation results. The two examples are as follows:
(1) Example 1: Electricity–gas joint planning without game. The joint planning is realized directly by optimizing the total revenue.
(2) Example 2: Electricity–gas joint programming considering the complete information dynamic game. Based on the premise of individual rationality, the three main bodies realize the Nash equilibrium with the optimal income of all parties based on the dynamic game.
(3) Example 3: Electricity–gas joint planning based on the complete information dynamic game considering users’ comprehensive energy consumption behavior.
In Example 1 and Example 2, the demand for electricity load is the same, while the new construction and operation of GU have an impact on the gas load. In Example 3, the electricity load and gas load are allocated according to the proportion of the above user utility function values. The planning results of the power grid and natural gas network in the three examples are shown in Figures 3, 4 above.
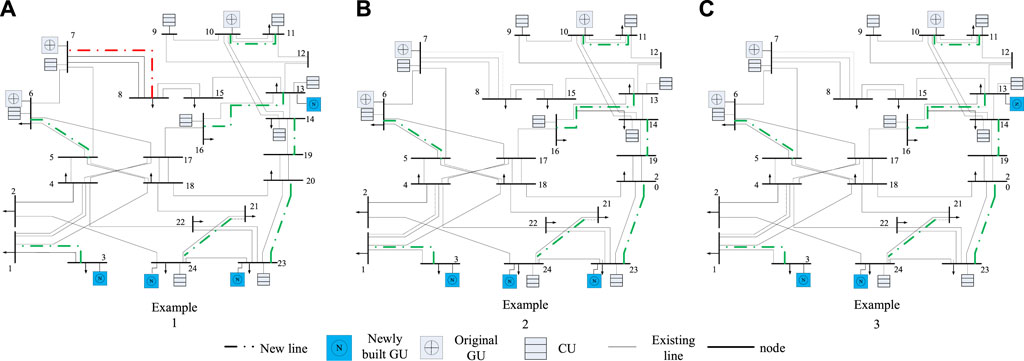
FIGURE 3. Power network simulation planning diagram (A–C).
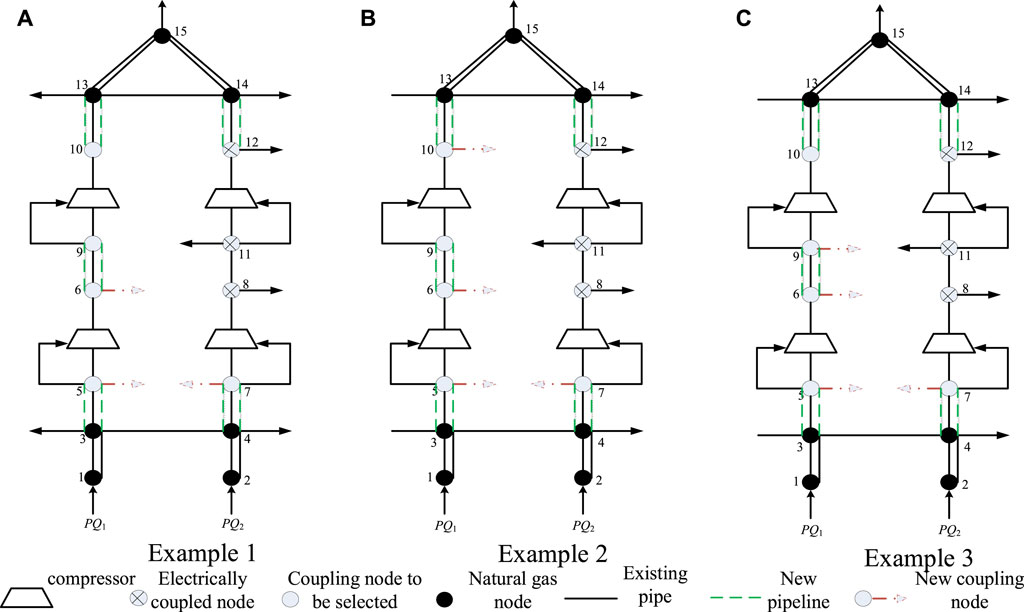
FIGURE 4. Natural gas network simulation planning diagram (A–C).
It can be seen from the above figure that there are differences in the planning schemes of the two examples. For the GU planning scheme, the units of Example 1 are set at nodes 3, 13, 23, and 24, and the units of example 2 are set at nodes 3, 23, and 24. For the transmission network planning scheme, all branches to be selected in Example 1 have new lines, while only 8–7 branches in Example 2 have no new lines.
5.3 Comparative analysis of the result
To validate the efficiency of the multi-agent planning approach considering users’ holistic energy consumption behavior, three examples are set for comparison to analyze the benefits of each agent. The results of Example 1, Example 2, and Example 3 are shown in the following table.
Observing Table 7 reveals that, in contrast to Example 1, the gas purchase cost, GU investment cost, operation cost, and pollution treatment cost in Example 2 are reduced by 2.445 × 10⁷, 1.244 × 10⁷, 2.367 × 10⁷, and 1.958 × 10⁷ yuan, respectively. The operation cost and pollution treatment cost of CU increased by 1.855 × 10⁸ and 9.48 × 10⁷ yuan, respectively. This is because, in scenario 2, utilizing the multi-agent game, the generation company optimizes the new GU set, that is, the investment of one GU is reduced, and the investment cost is reduced by 1.244 × 10⁷ yuan. In addition, in case 2, the transmission grid provider reduces one line on the GU side in the planning, resulting in the power generation load of some power generators being dispersed from the GU to CU side, which leads to the continuous increase in the CU output, the increase in its operation cost, and the increase in pollution treatment cost. At the same time, the cost of GU operation and pollution treatment is reduced because the GU supply is diverted. Compared with Example 2, the gas purchase cost, GU operation cost, and pollution treatment cost in Example 3 increased by 9.230 × 10⁷, 0.821 × 10⁷, and 0.780 × 10⁷ yuan, respectively. The operation cost and pollution treatment cost of CU increased by 0.427 × 10⁷ and 3.100 × 10⁷ yuan, respectively. The reasons are as follows: according to the analysis results of the comprehensive energy consumption behavior of users, the utility function of the electricity load is greater than that of the gas load, and users will prefer to use electricity load when making energy consumption decisions. Therefore, the income of power generators will increase, and the corresponding cost will increase.
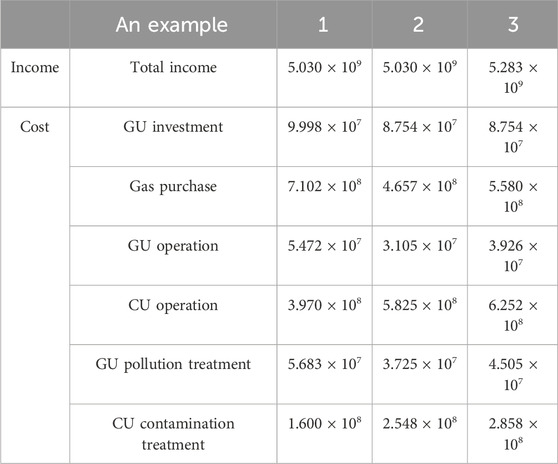
TABLE 7. Costs and benefits of power producers.
Table 8 reveals that, in contrast to Example 1, the network loss cost and line investment cost of Example 2 are reduced by 1.01 × 10⁷ and 5.2 × 10⁵ yuan, respectively. The reason is that in Example 2, based on the multi-agent game, the transmission network provider optimizes the set of new lines, and there is no line expansion in branches 23–20, resulting in some lines not required to be put into use, and the overall transmission distance of the line is reduced. It can be seen that the cost of these two items in Example 2 is relatively low. Compared with Example 2, the network loss cost of Example 3 will increase due to the large electrical load.
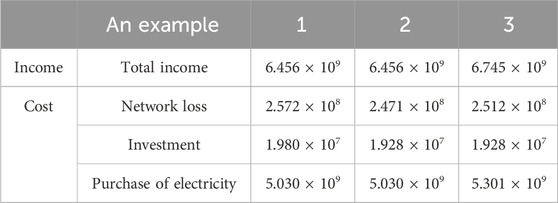
TABLE 8. Costs and benefits of transmission grid operators.
Table 9 illustrates that concerning the natural gas network, compared with Example 1, the investment cost of Example 2 is unchanged, and the total revenue and operation cost are reduced by 7.2 × 10⁷ and 3 × 10⁷ yuan, respectively. The reason is that Example 2 is based on the multi-agent game because the investment of one GU is reduced, the resulting lower operating cost of GU directly weakens the demand for natural gas, and the supply of natural gas will also decrease, so the operating cost of the gas source also shows a slight fluctuation and downward trend. Conversely, the total revenue of natural gas operators is reduced by reducing the new construction of GU, resulting in higher operation and pollution treatment costs of power generators. For Example 2, the operation cost of natural gas is 1.457 × 10⁹ and 9.055 × 10⁸ yuan higher than that of GU and CU, respectively. The reason is that the gas price is higher than the coal price, and based on the analysis of the above factors such as the cost change on the generator side, the natural gas operation cost is the highest among the three parties. However, the natural gas operator has not changed its investment strategy, so the investment cost remains unchanged. Compared with Example 2, the gas load in Example 3 is relatively small. Although the amount of gas purchased by power generators increases, the amount of natural gas directly used by users as energy decreases, which ultimately leads to the decrease in the total revenue of natural gas companies. The corresponding operating costs are also reduced.
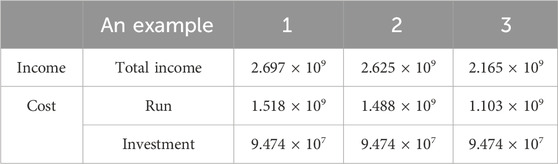
TABLE 9. Costs and benefits of a natural gas company.
It can be seen from Table 10 that, compared with Example 1, in Example 2, the revenue of the power generator and the transmission grid provider increases by 2 × 10⁷ and 1.1 × 10⁷ yuan, respectively, and the revenue of the natural gas operator decreases by 4.2 × 10⁷ yuan, resulting in the total revenue of the electricity–gas planning decreasing to 1.1 × 10⁷ yuan. The reason is that from the perspective of overall rationality, the final planning scheme is directly obtained through the unified decision-making of the three main bodies. Although its overall economy is relatively high, it deviates from the current IES market reform mechanism and market vitality at the cost of weakening the profits of transmission grid operators and natural gas operators. On the contrary, the dynamic game process based on the real-time interaction of tripartite decision-making information takes into account the individual rational behavior and ensures the rationality of the decision-making scheme while taking into account the interests of the three main bodies in the market, thus enhancing the vitality of the energy market. Compared with Example 2, in Example 3, the revenue of power generators and transmission grid increases by 7.115 × 10⁷ and 1.352 × 10⁷ yuan, respectively, while the revenue of natural gas operators decreases by 7.474 × 10⁷ yuan, which ultimately leads to an increase in 9.89 × 10⁶ yuan in the total revenue of electricity–gas planning. The reason is that, on the basis of planning and decision-making from the perspective of individual rationality in Example 2, Example 3 considers the comprehensive energy consumption behavior of users and allocates more resources to the electricity load with a larger proportion of energy consumption, which leads to the increase in the revenue of power generators and transmission grid operators and the decrease in the revenue of natural gas operators. The approach in this study considers the concerns of every market participant while enhancing the overall revenue.
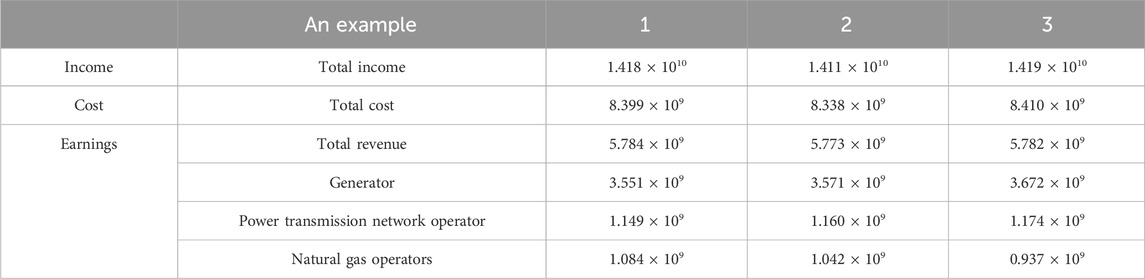
TABLE 10. Total revenue of the three parties.
6 Conclusion
This paper introduces a multi-agent collaborative planning approach for an integrated electricity–gas energy system utilizing game theory in the context of integrated user energy consumption. First, the model depicting characteristics in users’ energy consumption is constructed, and an analysis of users’ overall energy usage patterns is conducted through the application of evolutionary game theory. On this basis, the game relationship between different investment agents is fully considered, and a dynamic game model of electricity–gas multi-agent planning considering comprehensive energy consumption behavior is proposed. Ultimately, the model is resolved through an iterative search technique. The simulation example yields the following conclusions:
(1) In contrast to conventional approaches, this study takes into account users’ holistic energy usage patterns, enhancing the efficacy of the multi-agent planning scheme for electricity and gas.
(2) This paper plans from the overall point of view of the integrated energy system combining electricity and gas, and the planning scheme increases the total income of the electricity–gas integrated energy system on the whole.
(3) In the planning of this paper, the game behavior of each investor is fully considered, and the interests of all market participants are taken into account, which not only conforms to the market operation mechanism but also effectively guarantees the market vitality.
Data availability statement
The original contributions presented in the study are included in the article/Supplementary Material; further inquiries can be directed to the corresponding author.
Author contributions
WL: writing–original draft. BZ: writing–review and editing. MO: writing–original draft. WZ: writing–review and editing. GH: writing–original draft and writing–review and editing. TM: writing–review and editing.
Funding
The authors declare that this study received funding from This paper was supported by the Science and Technology Project of Shenzhen Power Supply Corporation, grant number SZKJXM20220036/09000020220301030901283. The funder was not involved in the study design, collection, analysis, interpretation of data, the writing of this article, or the decision to submit it for publication.
Conflict of interest
Authors WL, MO, and GH were employed by Shenzhen Power Supply Company.
The remaining authors declare that the research was conducted in the absence of any commercial or financial relationships that could be construed as a potential conflict of interest.
Publisher’s note
All claims expressed in this article are solely those of the authors and do not necessarily represent those of their affiliated organizations, or those of the publisher, the editors, and the reviewers. Any product that may be evaluated in this article, or claim that may be made by its manufacturer, is not guaranteed or endorsed by the publisher.
References
Barati, F., Seifi, H., Sepasian, M., Nateghi, A., Shafie-khah, M., and Catalao, J. P. S. (2015). Multi-period integrated framework of generation, transmission, and natural gas grid expansion planning for large-scale systems. IEEE Trans. Power Syst. 30, 2527–2537. doi:10.1109/TPWRS.2014.2365705
Chen, J., Qi, B., Rong, Z., Peng, K., Zhao, Y., and Zhang, X. (2021). Multi-energy coordinated microgrid scheduling with integrated demand response for flexibility improvement. Energy 217, 119387. doi:10.1016/j.energy.2020.119387
Dai, Z., Xie, P., Huang, Y., Cheng, G., Tang, W., Zou, K., et al. (2023). Optimization method of power grid material warehousing and allocation based on multi-level storage system and reinforcement learning. Comput. Electr. Eng. 109, 108771. doi:10.1016/j.compeleceng.2023.108771
Dou, X., Wang, J., and Wang, X. (2020a). User demand-side response behavior analysis of regional integrated energy system based on evolutionary game. Proc. CSEE. doi:10.13334/j.0258-8013.pcsee.190581
Dou, X., Wang, J., and Wang, X. (2020b). User demand-side response behavior analysis of regional integrated energy system based on evolutionary game. Proc. CSEE. doi:10.13334/j.0258-8013.pcsee.190581
Fang, H. (2008). Application research on HVAC scheme selection based on life cycle cost. Xi'an, China: Chang'an University.
Fang, P., Fu, W., Wang, K., Xiong, D., and Zhang, K. (2022). A compositive architecture coupling outlier correction, EWT, nonlinear Volterra multi-model fusion with multi-objective optimization for short-term wind speed forecasting. Appl. Energy 307, 118191. doi:10.1016/J.APENERGY.2021.118191
Fu, W., Jiang, X., Li, B., Tan, C., Chen, B., and Chen, X. (2023). Rolling bearing fault diagnosis based on 2D time-frequency images and data augmentation technique. Meas. Sci. Technol. 34, 045005. doi:10.1088/1361-6501/ACABDB
Gao, Q., Liu, C., and Jin, D. (2021). Optimized configuration of park integrated energy system considering integrated demand response. High. Volt. Appar., doi:10.13296/j.1001-1609.hva.2021.08.022
Guo, H., Cheng, H., and Ma, Z. (2017). Power quality comprehensive evaluation based on probability theory and combination weighting method. Smart Grid. doi:10.14171/j.2095-5944.sg.2017.06.002
Hu, Y., Bie, C., and Li, G. (2017). Study on joint planning of natural gas network, power source and power grid. Proc. CSEE. doi:10.13334/j.0258-8013.pcsee.161679
Huang, W., Zhao, X., and Jiang, L. (2016). Research on LCC evaluation method of transformer based on energy saving factors. High. Volt. Appar., doi:10.13296/j.1001-1609.hva.2016.02.024
Huang, Y., Wang, Y., and Yang, N. (2020a). Research on decision-making method of users' comprehensive energy consumption behavior based on evolutionary game. Power Syst. Prot. Control. doi:10.19783/J.CNKI.PSP.C.200511
Huang, Y., Wang, Y., and Yang, N. (2020b). Research on decision-making method of users' comprehensive energy consumption behavior based on evolutionary game. Power Syst. Prot. Control. doi:10.19783/J.CNKI.PSP.C.200511
Li, J., Ma, Y., and Gu, H. (2020b). Data-driven analysis method of user energy consumption behavior. Smart Power.
Li, Z., Wu, L., Xu, Y., Wang, L., and Yang, N. (2023). Distributed tri-layer risk-averse stochastic game approach for energy trading among multi-energy microgrids. Appl. Energy 331, 120282. doi:10.1016/J.APENERGY.2022.120282
Li, Z., Xu, Y., Fang, S., and Mazzoni, S. (2019). Optimal placement of heterogeneous distributed generators in a grid-connected multi-energy microgrid under uncertainties. IET Renew. Power Gener. 13, 2623–2633. doi:10.1049/iet-rpg.2019.0036
Li, Z., Xu, Y., Feng, X., and Wu, Q. (2020a). Optimal stochastic deployment of heterogeneous energy storage in a residential multienergy microgrid with demand-side management. IEEE Trans. Industrial Inf. 17, 991–1004. doi:10.1109/TII.2020.2971227
Li, Z., Yu, C., Abu-Siada, A., Li, H., Li, Z., Zhang, T., et al. (2021). An online correction system for electronic voltage transformers. Int. J. Electr. Power Energy Syst. 126, 106611. doi:10.1016/j.ijepes.2020.106611
Liao, S., Xu, J., Sun, Y., Bao, Y., and Tang, B. (2018). Control of energy-intensive load for power smoothing in wind power plants. IEEE Trans. Power Syst. 33, 6142–6154. doi:10.1109/tpwrs.2018.2834940
Murty, V. V. S. N., and Kumar, A. (2020). RETRACTED ARTICLE: multi-objective energy management in microgrids with hybrid energy sources and battery energy storage systems. Prot. Control Mod. Power Syst. 5, 2. doi:10.1186/s41601-019-0147-z
Shen, X., Ouyang, T., Yang, N., and Zhuang, J. (2021). Sample-based neural approximation approach for probabilistic constrained programs. IEEE Trans. neural Netw. Learn. Syst. 34, 1058–1065. doi:10.1109/TNNLS.2021.3102323
Sheng, S., Qiu, H., and Zhang, W. (2019). Comprehensive assessment method of new energy consumption considering steady and dynamic active power equilibrium constraints. Power Syst. Prot. Control. doi:10.12783/dtetr/amee2018/25370
Unsihuay, C., Marangon-Lima, J., De, S., Perez-Arriaga, I. J., and Balestrassi, P. P. (2010). A model to long-term, multiarea, multistage, and integrated expansion planning of electricity and natural gas systems. IEEE Trans. Power Syst. 25, 1154–1168. doi:10.1109/TPWRS.2009.2036797
Wang, C., Chu, S., Ying, Y., Wang, A., Chen, R., Xu, H., et al. (2023). Underfrequency load shedding scheme for islanded microgrids considering objective and subjective weight of loads. IEEE Trans. Smart Grid 14, 899–913. doi:10.1109/TSG.2022.3203172
Wang, Z., Zhang, Z., Li, Y., Wang, T., and Liao, X. (2021). Coordinated scheduling method of integrated energy supply side under multi-energy complementary environment. Energy Environ. Prot., doi:10.19389/j.cnki.1003-0506.2021.12.030
Wu, K., Wang, J., and Li, W. (2019). Research on new generation power system operation mode for energy Internet. Proc. CSEE. doi:10.13334/j.0258-8013.pcsee.172654
Xu, P., Fu, W., Lu, Q., Zhang, S., Wang, R., and Meng, J. (2023). Stability analysis of hydro-turbine governing system with sloping ceiling tailrace tunnel and upstream surge tank considering nonlinear hydro-turbine characteristics. Renew. Energy 210, 556–574. doi:10.1016/J.RENENE.2023.04.028
Yang, L., Luo, P., and Ren, Y. (2020). Game planning of integrated energy system considering uncertainty. Electr. Meas. Instrum., doi:10.19753/j.issn1001-1390.2020.11.014
Yang, N., Dong, Z., Wu, L., Zhang, L., Shen, X., Chen, D., et al. (2022b). A comprehensive review of security-constrained unit commitment. J. Mod. Power Syst. Clean Energy 10, 562–576. doi:10.35833/MPCE.2021.000255
Yang, N., Qin, T., Wu, L., Huang, Y., Xing, C., et al. (2022a). A multi-agent game based joint planning approach for electricity-gas integrated energy systems considering wind power uncertainty. Electr. Power Syst. Res. Mar 204, 107673. doi:10.1016/j.epsr.2021.107673
Yang, N., Yang, C., Xing, C., Ye, D., Jia, J., Chen, D., et al. (2021). Deep learning-based SCUC decision-making: an intelligent data-driven approach with self-learning capabilities. IET Generation, Transm. Distribution 16 (4), 629–640. doi:10.1049/GTD2.12315
Yu, G., Liu, C., Tang, B., Chen, R., Lu, L., Cui, C., et al. (2022). Short term wind power prediction for regional wind farms based on spatial-temporal characteristic distribution. Renew. Energy 199, 599–612. doi:10.1016/J.RENENE.2022.08.142
Yu, Z., Qiao, Z., and Lei, W. (2023). Optimal operation of regional microgrids with renewable and energy storage: solution robustness and nonanticipativity against uncertainties. IEEE Trans. Smart Grid. doi:10.1109/TSG.2022.3185231
Zang, H., Geng, M., and Huang, M. (2022). Review and prospect of state estimation for electricity-heat-gas hybrid integrated energy system. Automation Electr. Power Syst. 1. doi:10.7500/AEPS20210609003
Zhang, Y., Wei, L., Fu, W., Chen, X., and Hu, S. (2023). Secondary frequency control strategy considering DoS attacks for MTDC system. Electr. Power Syst. Res. 214, 108888. doi:10.1016/J.EPSR.2022.108888
Zhang, Y., Xie, X., Fu, W., Chen, X., Hu, S., Zhang, L., et al. (2022). An optimal combining attack strategy against economic dispatch of integrated energy system. IEEE Trans. Circuits Syst. II Express Briefs 70, 246–250. doi:10.1109/tcsii.2022.3196931
Zheng, G., Li, H., Zhao, B., Wu, B., and Tang, W. (2018). Comprehensive optimization of electrical/thermal energy storage equipments for integrated energy system near user side based on energy supply and demand balance. Power system protection and contorl. Dianli Xitong Baohu yu Kongzhi/Power System Protection and Control. doi:10.7667/PSPC171221
Zhou, W., and Zhao, S. (2013). Quantitative analysis of traveler route choice behavior based on Mixed Logit model. J. Jilin Univ. Eng. Technol. Ed., doi:10.13229/j.cnki.jdxbgxb2013.02.040
Zhu, B., Liu, Y., Zhi, S., Wang, K., and Liu, J. (2023). A family of bipolar high step-up zeta–buck–boost converter based on “coat circuit”. IEEE Trans. Power Electron. 38, 3328–3339. doi:10.1109/TPEL.2022.3221781
Keywords: comprehensive energy network, analysis of energy consumption patterns, complete information dynamic game, joint planning, iterative exploration
Citation: Liu W, Zhou B, Ou M, Zhao W, Huang G and Mao T (2024) Electricity–gas multi-agent planning method considering users’ comprehensive energy consumption behavior. Front. Energy Res. 11:1341400. doi: 10.3389/fenrg.2023.1341400
Received: 20 November 2023; Accepted: 20 December 2023;
Published: 10 January 2024.
Edited by:
Zhengmao Li, Aalto University, FinlandCopyright © 2024 Liu, Zhou, Ou, Zhao, Huang and Mao. This is an open-access article distributed under the terms of the Creative Commons Attribution License (CC BY). The use, distribution or reproduction in other forums is permitted, provided the original author(s) and the copyright owner(s) are credited and that the original publication in this journal is cited, in accordance with accepted academic practice. No use, distribution or reproduction is permitted which does not comply with these terms.
*Correspondence: Guanglei Huang, bDE1ODk3NTU0NDAyQDE2My5jb20=