 Shen Xin1
 Tang Jianlin
94% of researchers rate our articles as excellent or good
Learn more about the work of our research integrity team to safeguard the quality of each article we publish.
Find out more
ORIGINAL RESEARCH article
Front. Energy Res., 29 December 2023
Sec. Process and Energy Systems Engineering
Volume 11 - 2023 | https://doi.org/10.3389/fenrg.2023.1338807
This article is part of the Research TopicSmart Robust Operation and Trading of Integrated Energy Systems with Low Pollution GoalsView all 25 articles
The widespread application of electric vehicles (EVs) is a positive force driving green development. However, their widespread penetration also poses significant challenges and threats to the security and stable operation of the power grid. To address this urgent issue, this article constructs a bi-level optimal dispatching model fostering collaboration between electric vehicle aggregators and the distribution network. The upper-level optimization targets the minimization of peak-valley differences in the distribution network via considerably arranging power outputs of gas turbines, while the lower-level one focuses on reducing the charging expense of EV aggregators via efficient charging transfer. Note that the charging expense is not only composed of electric cost but also a dynamic carbon emission factor-based cost, which contributes to the electricity economy and carbon reduction concurrently. A geometric mean optimizer (GMO) is introduced to solve the mode. Its efficiency is evaluated against three typical algorithms, i.e., genetic algorithm, great-wall construction algorithm, and optimization algorithm based on an extended IEEE 33-bus system with different charging behaviors of EVs on both a typical weekday and weekend. Simulation results demonstrate that the GMO outperforms other competitive algorithms in accuracy and stability. The peak-valley difference between the distribution network and the total cost of EV aggregators can be decreased by over 98% and 76%, respectively.
With the increasingly prominent issue of climate change, reducing carbon emissions has become the common goal of the international community (Hu and Man, 2023). The power industry is widely regarded as one of the key areas to reducing carbon footprint because of its important position in global carbon emissions (Xu et al., 2020a). Meanwhile, the rapid popularization of electric vehicles (EVs) is considered to be a powerful means to reduce road traffic carbon emissions and improve urban air quality (Tan et al., 2023). However, large-scale electric vehicles connected to the power grid for disorderly charging will bring problems such as the increase in power loss (Manzolli et al., 2022), the decline of power quality, and the difficulty of optimal control of power grid operation (Xu et al., 2020b).
To address these tricky problems, extensive studies have been undertaken regarding vehicle-to-grid (V2G) in the past few years, which can be classified into two aspects, i.e., economic optimization (Ahmadpour et al., 2022) and safety enhancement (Sperstad et al., 2020). For instance, reference (Gan et al., 2020) proposed a probabilistic evaluation method to investigate household EVs’ dispatching potential when considering users’ multiple h2h travel needs, which gave a significant foundation for EVs to participate in power grid regulation. Literature (Chen et al., 2017) constructed an EV aggregation model to participate in auxiliary services to achieve effective scheduling management and improve the economy of the system. Literature (Long et al., 2021) presented an ordinal optimization-based real-time scheduling method for large-scale EV charging stations, which reduced 6% of operation cost. In reference (Liu et al., 2019), a two-stage economic charging framework for EV aggregators was developed. Reference (Manzolli et al., 2022) developed a charging schedule optimization model of battery electric buses considering the aging of the batteries, which pointed out that the charging cost is expected to reduce by 38% in 2030. Besides, extensive studies focused on the time-of-use (ToU) electricity price mechanism-guided charging schedule (Manzolli et al., 2022; Yan et al., 2021). References (Mathioudaki et al., 2021; Ghosh and Aggarwal, 2018) designed a price-based service menu for EV charging to maximize profits. A deep reinforcement learning based approach was constructed to address optimal charging scheduling under uncertain electric prices (Wan et al., 2019). Li Z. et al. (2023) established a price-based transfer model to avoid charging congestion.
Nevertheless, the above-mentioned studies mainly concentrated on economic scheduling, which unfortunately ignored the effects of carbon emission. Recently, calls have come for carbon assessment to reflect the nature of the grid generation mix via dynamic approaches (Khan et al., 2018). The research on the carbon reduction of electric vehicle cooperative power grid dispatch has gradually emerged (Wu et al., 2023). Daneshzand et al. (2023) developed a scheduling framework for EVs and assessed the power grid carbon emissions under various tariff designs and multiple vehicle adoption levels. In Wang et al. (2023), the park EV agent participates in the carbon market by selling carbon emission allowances to increase profits. In Zhang G. et al. (2023), source-load coordinated carbon reduction based bi-layer economic scheduling models were established when EVs were considered as controllable loads and mobile energy storage. However, these current studies only calculated the total carbon emission on the source side. The real-time carbon emission on the load side was ignored, which resulted in an unideal emission reduction on EVs.
In this context, this paper proposes a dynamic carbon emission-factor-based bi-level optimal dispatching of the distribution network considering friendly interaction with electric vehicles. Its main contributions are summarized as follows:
➢ A bi-level friendly interaction model between the EV aggregator and distribution network is established, upon which the upper-level optimization attempts to reduce the peak-valley difference of the distribution network and the lower-level one aims to minimize the operation cost of the EV aggregator;
➢ Dynamic carbon emission-factor-based emission cost is combined with electric cost to guide the charging behaviors of EV aggregator effectively, thus reducing combined charging cost;
➢ A novel meta-heuristic algorithm, namely, geometric mean optimizer (GMO) (Rezaei et al., 2023), is induced to solve the upper-level model, while three typical competitive algorithms are used to validate the outperformance of GMO under an extended IEEE 33-bus system, i.e., genetic algorithm (GA), great-wall construction algorithm (GWCA), optimization algorithm (WOA).
The rest of this paper is organized as follows: Section 2 models the distribution network; Bi-level optimization framework is introduced in Section 3; Two case studies are executed in Section 4; Section 5 summarizes this paper.
A common distribution network with different distributed power sources and loads can be depicted in Figure 1, which includes power flow and carbon emission flow.
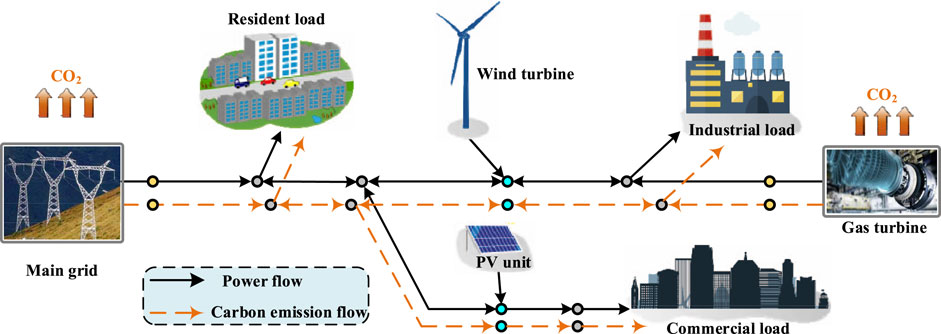
FIGURE 1. A common distribution network with power and carbon emission flows.
When the EV aggregator optimizes the scheduling of the single electric vehicle in the area, its charging time characteristics determine whether the single electric vehicle can participate in the scheduling task in this period of time. For electric vehicles in a charging station, the charging time characteristics mainly include plug-in time
where n represents the nth EV.
Besides, the charging demand of each EV is determined by Eq. (2)
where
where
According to the proportional sharing principle, the electric carbon factor of the node is carbon emission per unit of electricity of the power flow out of it, which yields Eq. (5)
where
Upper-level optimization aims to reduce the regulation burden of grid operators. Thus its objective function is designed to minimize the difference of peak-valley power in slack bus, which can be expressed by Eq. (6), as follows:
where
The constraints of upper-level optimization composed of power balance, the voltage of nodes, the power output of generators, and the capacity of transformation lines, which can be mathematized as Eq. (7)
where
Unlike upper-level optimization, the lower one attempts to protect the interests of the EV aggregator by optimizing EVs’ charging strategies. Thus its objective is the cost minimization of the EV aggregator, expressed by Eq. (8)
where
where
where
Additionally, the electricity charging cost
where
The solution of the lower-level optimization consists of charging strategies of different EV aggregators, which yields Eqs (12), (13)
where
To ensure the charging demand of each EV, lower-level scheduling satisfies the following power balance constraint:
In Eq. (14),
GMO is a meta-heuristic algorithm that uses the behavior of multiple search agents in social interaction to search for the best results, and its optimization performance has been effectively verified in various test problems (Rezaei et al., 2023).
In GMO, the position
where
Unlike traditional mate-heuristic algorithms, GMO adopts a dual-fitness index (DFI) to evaluate current solutions, which can be calculated by Eq. (17)
where
where
A weighted average of all opposite personal best-so-far agents is designed to make full use of the advantages of these best agents, as follows:
In Eq. (19),
where
The updating equations of position and velocity are defined as Eqs (22), (23)
where
where
The specific process of GMO solving optimization problems can be referred to (Rezaei et al., 2023).
Above all, the execution framework of GMO-based bi-level optimal scheduling is illustrated in Figure 2. GMO is utilized to find the most considerable power outputs of controllable resources (CS) in the distribution network. The interior point method (IPM) is applied to solve the lower-level model for the best charging strategies. Peak-valley difference of the slack bus and DECFs of EV access points obtained by power flow calculation are the interactive information optimized for upper and lower levels, respectively.
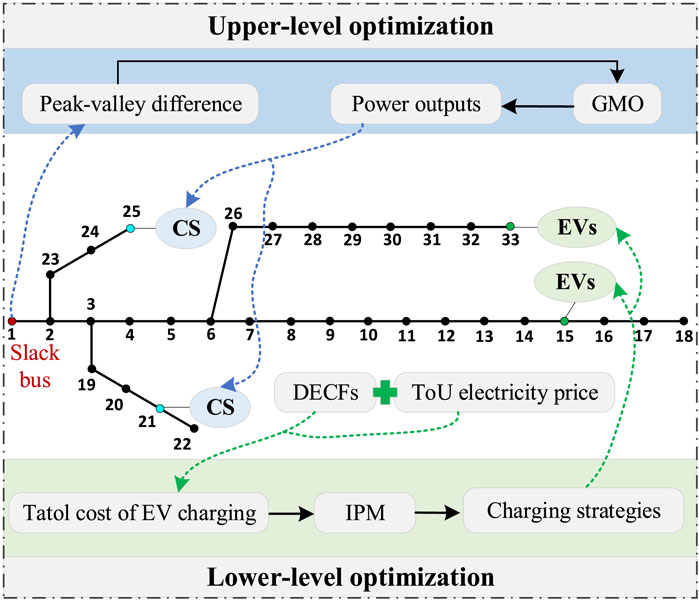
FIGURE 2. The flowchart of GMO-based bi-level optimal scheduling.
In this section, an extended IEEE 33-bus system is introduced to verify the validation of the proposed method, as depicted in Figure 3, which mainly attaches two same gas turbines (GTs), a wind turbine (WT), a PV unit, and three types of EV clusters on the basis of the standard system. The slack bus is connected to a main grid to ensure the power balance of the distribution network. Its time-of-use (ToU) electricity prices and DCEF are employed to guide economic low-carbon operations, illustrated in Figure 4A. The price of carbon emission is 0.0068 $/kg.
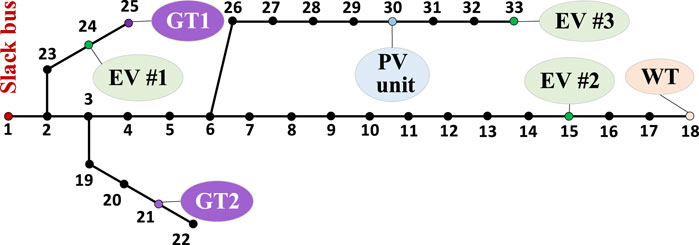
FIGURE 3. Extended IEEE 33-bus system.
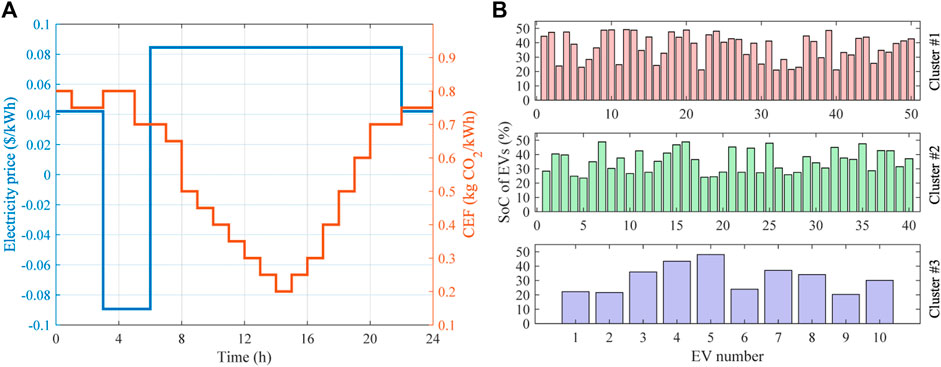
FIGURE 4. Initial conditions of IEEE 33-bus system: (A) ToU price and DCEF of the slack bus; and (B) initial SoC of EVs.
In addition, the power outputs of two GTs and the charging strategies of EV aggregators are set as decision-making variables for upper-level and lower-level optimizations. The upper and lower bounds of power outputs of GTs are set as 1,240 and 0 kW, and their unit generation cost is both 0.0822 $/kWh (Cao et al., 2022). For EV aggregators, charging behaviors of EV users on a weekday and weekends are taken into account. The initial state of charge (SoC) of EVs can be characterized by a normal distribution from 20% to 50% (Li YP. et al., 2023), as shown in Figure 4B. Their other critical parameters are offered in Table 1. Note that the dwell time of EVs are individually increased by an hour at night and decreased by two hours by day on weekend against weekday (Zheng et al., 2023). The scheduling time and interval are 24 and 1 h, respectively.
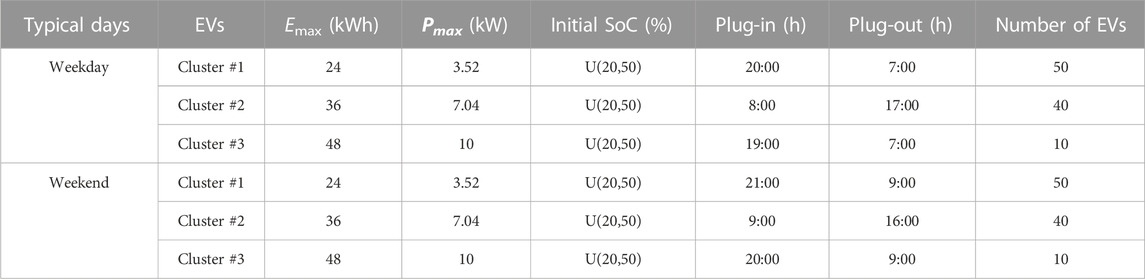
TABLE 1. Main parameters of different clusters of EVs (Cao et al., 2022; Li YP. et al., 2023).
GMO and three competitive algorithms, i.e., GA (Wang et al., 2022), GWCA (Guan et al., 2023), and WOA (Mirjalili and Lewis, 2016), are adopted to solve the bi-level optimization model. For fair and objective comparisons, the population size and iteration number of each algorithm are identically set to 30 and 100, respectively. Results obtained by different approaches in 10 independent runs are recorded, upon which the best result of each method is selected and compared. Additionally, the main parameters of competitive algorithms are tabularized in Table 2.
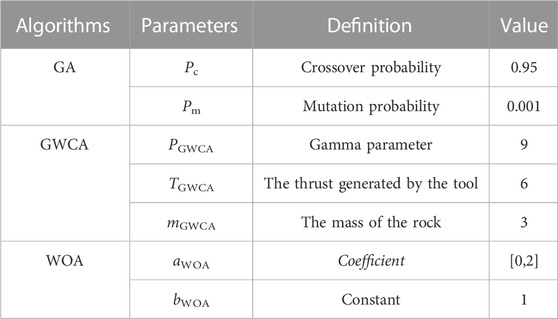
TABLE 2. Main parameters of different competitive algorithms.
Here, an interactive scheduling test on a weekday is executed to evaluate the performance of various algorithms. Figure 5A depicts the convergence curve of upper-level optimization obtained by various algorithms, which indicates GMO outperform others. Specifically, while GA enjoys the fastest convergence speed, its final fitness value is the largest, which means it traps in the local optimum. After around 30 additional iterations, GMO searches for the smallest fitness value, which validates the high accuracy of GMO. Furthermore, a boxplot comparison based on 20 independent runs of different algorithms is given in Figure 5B. One can observe the boxplot of GMO exhibits the smallest distribution, upper bound, and lower bound, which demonstrates GMO also wins other competitive algorithms in stability performance.
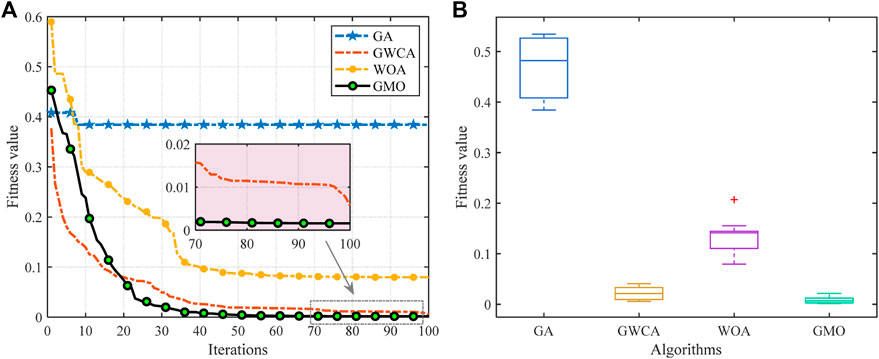
FIGURE 5. Comparisons of various algorithms for upper-level optimization on a weekday: (A) Convergence curve; and (B) Boxplot.
Table 3 statistics the optimum results and mean computation time of various algorithms, including the fitness value of upper-level optimization, electricity cost, carbon emission cost, and total cost of lower-level optimization, upon which the best indicator is highlighted in bold. WO means without optimization: the power outputs of two GTs only depend on ToU price and each EV is charged via average power. When the generation cost of GTs is lower than the ToU price, its power output is set to the rated value, otherwise, it is equal to zero. GMO obtains the best indicators in the upper-level optimization task. Its fitness value is only 6.018
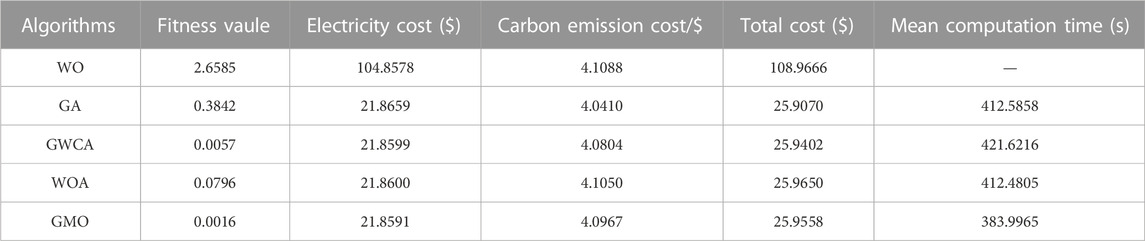
TABLE 3. Statistic results of various algorithms on a weekday.
Figure 6 provides the optimal solutions on a weekday. The power outputs of GTs are obviously decreased from 5:00 to 16:00 and increased at night to minimize the peak-valley difference of the distribution network, as shown in Figure 6A. As illustrated in Figure 6B, the charging power of EVs is significantly transferred from 18:00–24:00 and 0:00–2:00 to 3:00–5:00, which is mainly because the electric price is the lowest at 3:00–5:00.
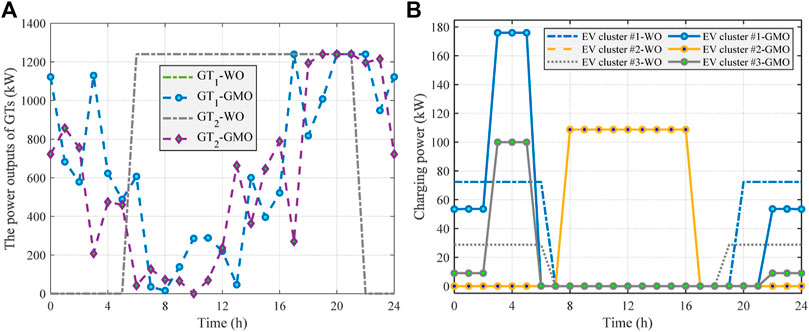
FIGURE 6. Optimal scheduling solutions on a weekday: (A) Upper-level; and (B) Lower-level.
Figure 7A gives the cost comparison of various algorithms on a weekday. Figure 7B illustrates the CEFs of each EV cluster obtained by WO and GMO, in which the CEF of EV cluster #2 is significantly reduced from 7:00 to 17:00 after optimization via GMO. The CEF of EV cluster #3 is always equal to zero because it is only charged by WT.

FIGURE 7. Result comparison of lower-level optimization on a weekday: (A) Costs; and (B) CEFs.
In addition, the interactive scheduling test on weekends is designed to further validate the feasibility of the proposed method. Similar to the upper optimization on a weekday, GMO acquires the smallest fitness value with the most powerful stability compared with other algorithms, as shown in Figure 8.
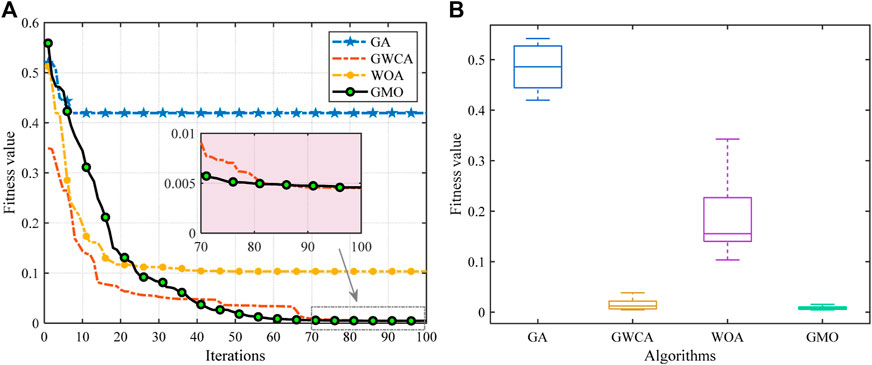
FIGURE 8. Comparisons of various algorithms for upper-level optimization on weekend: (A) Convergence curve; and (B) Boxplot.
Statistic results of various algorithms on weekends are tabulated in Table 4. The lowest total cost and carbon emission cost are simultaneously acquired by GMO. There are only slight differences between the smallest fitness value and shortest mean computation time and those obtained by GMO. In particular, the fitness value of upper-level optimization and total cost of the EV aggregator is decreased by 99.82% and 77.27%, respectively.
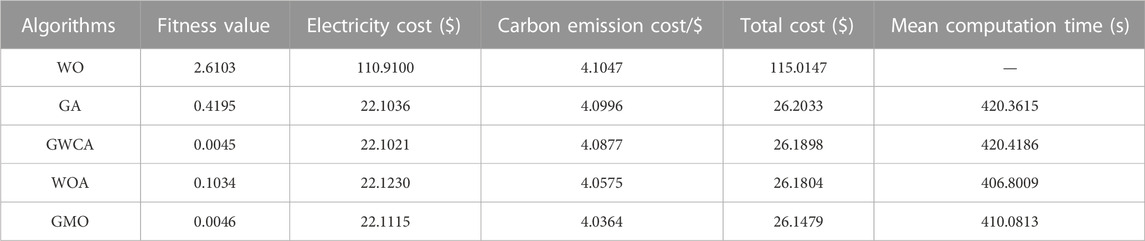
TABLE 4. Statistic results of various algorithms on weekend.
Besides, the optimal solutions on a weekend are illustrated in Figure 9, in which the power outputs of GTs are obviously transferred from daytime to night duration. Similarly, EVs are assigned to charge with maximum power from 3:00 to 5:00 to maximize total cost. Figures 10A, B offer the cost comparison of various algorithms and the CEFs of each EV cluster obtained by WO and GMO on weekends, respectively. One can easily observe that similar optimization results are acquired compared with those on the weekdays.
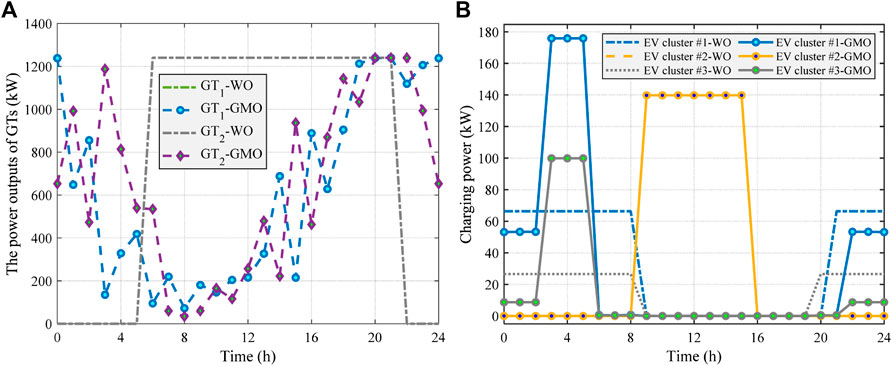
FIGURE 9. Optimal scheduling solutions on a weekend: (A) Upper-level; and (B) Lower-level.
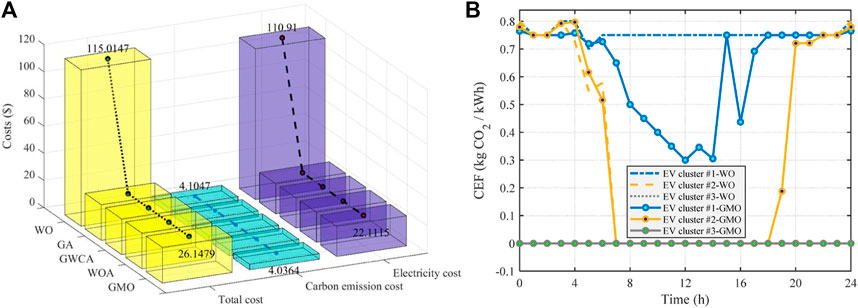
FIGURE 10. Result comparison of lower-level optimization on weekend: (A) Costs; and (B) CEFs.
This paper develops a bi-level optimal dispatching of distribution network considering friendly interaction with electric vehicles, in which a dynamic electrical carbon emission factor is introduced to precisely calculate the carbon emission of each node. According to two typical case studies based on an extended IEEE 33 bus system, three conclusions can be summarized as follows:
➢ The proposed bi-level optimal dispatching framework significantly contributes to the security and stability of the distribution network and the cost decrease of EV aggregators by considerable planning in power outputs of GTs and charging transformation of EVs. Peak-valley difference of the distribution network and the total cost of the EV aggregator can be decreased by over 98% and 76%, respectively;
➢ Compared with competitive algorithms, GMO acquires more satisfactory optimization indicators both in interactive scheduling tests on the weekday and weekend, which especially outperform others in convergence accuracy and stability;
➢ Due to the small cost of carbon emissions compared to electricity consumption, the reduction in electricity prices is dominant in the lower-level optimization, and the effect of electric vehicles participating in carbon reduction is not obvious. Higher carbon emission prices or multi-objective optimization may achieve more carbon reduction.
Notably, meta-heuristic algorithms used in this paper may be limited in accuracy and speed when various complex constraints are taken into consideration, such as start-stop constraint and climbing constraint of gas turbines, discharge constraint of electric vehicles, etc.
The original contributions presented in the study are included in the article/Supplementary Material, further inquiries can be directed to the corresponding author.
SX: Data curation, Formal Analysis, Funding acquisition, Writing–original draft, Writing–review and editing. LJ: Data curation, Formal Analysis, Software, Writing–original draft. YY: Conceptualization, Resources, Visualization, Writing–original draft. TJ: Writing–review and editing, Funding acquisition, Methodology, Supervision, Validation. LX: Conceptualization, Investigation, Resources, Writing–review and editing. QB: Formal Analysis, Resources, Validation, Writing–review and editing.
The authors declare financial support was received for the research, authorship, and/or publication of this article. The authors gratefully acknowledge the support of the China Southern Power Grid Technology Project (YNKJXM20222402).
Authors SX, LJ, and YY were employed by Yunnan Power Grid Co., Ltd.
The remaining authors declare that the research was conducted in the absence of any commercial or financial relationships that could be construed as a potential conflict of interest.
All claims expressed in this article are solely those of the authors and do not necessarily represent those of their affiliated organizations, or those of the publisher, the editors and the reviewers. Any product that may be evaluated in this article, or claim that may be made by its manufacturer, is not guaranteed or endorsed by the publisher.
Ahmadpour, A., Dejamkhooy, A., and Shayeghi, H. (2022). Optimization and modelling of linear Fresnel reflector solar concentrator using various methods based on Monte Carlo Ray-Trace. Sol. Energy 245, 67–79. doi:10.1016/j.solener.2022.09.006
Cao, Y., Zhan, J., Cao, Q., and Si, F. Q. (2022). Techno-economic analysis of cascaded supercritical carbon dioxide combined cycles for exhaust heat recovery of typical gas turbines. Energy Convers. Manag. 258, 115536. doi:10.1016/j.enconman.2022.115536
Chen, Q. F., Liu, N., Hu, C. G., Wang, L., and Zhang, J. (2017). Autonomous energy management strategy for solid-state transformer to integrate PV-assisted EV charging station participating in ancillary service. IEEE Trans. Industrial Inf. 13 (1), 258–269. doi:10.1109/tii.2016.2626302
Daneshzand, F., Coker, P. J., Potter, B., and Smith, S. T. (2023). EV smart charging: how tariff selection influences grid stress and carbon reduction. Appl. Energy 348, 121482. doi:10.1016/j.apenergy.2023.121482
Gan, L., Chen, X., Yu, K., Zheng, J., and Du, W. (2020). A probabilistic evaluation method of household EVs dispatching potential considering users multiple travel needs. IEEE Trans. Industry Appl. 56 (5), 5858–5867. doi:10.1109/tia.2020.2989690
Ghosh, A., and Aggarwal, V. (2018). Control of charging of electric vehicles through menu-based pricing. IEEE Trans. Smart Grid 9 (6), 5918–5929. doi:10.1109/tsg.2017.2698830
Guan, Z., Ren, C., Niu, J., Wang, P., and Shang, Y. (2023). Great Wall Construction Algorithm: a novel meta-heuristic algorithm for engineer problems. Expert Syst. Appl. 233, 120905. doi:10.1016/j.eswa.2023.120905
Hu, Y. S., and Man, Y. (2023). Energy consumption and carbon emissions forecasting for industrial processes: status, challenges and perspectives. Renew. Sustain. Energy Rev. 182, 113405. doi:10.1016/j.rser.2023.113405
Khan, I., Jack, M., and Stephenson, J. (2018). Analysis of greenhouse gas emissions in electricity systems using time-varying carbon intensity. J. Clean. Prod. 184, 1091–1101. doi:10.1016/j.jclepro.2018.02.309
Li, Y. P., Su, H., Chen, L. X., Shi, Y. W., Li, H. J., Feng, D. H., et al. (2023). Two-stage real-time optimal electricity dispatch strategy for urban residential quarter with electric vehicles’ charging load. Energy 268, 126702. doi:10.1016/j.energy.2023.126702
Li, Z., Sun, Y., Yang, H., Wang, S., Shen, Y., Wang, X., et al. (2023). A multi-time scale coordinated control and scheduling strategy of EVs considering guidance impacts in multi-areas with uncertain RESs. Int. J. Electr. Power & Energy Syst. 154, 109444. doi:10.1016/j.ijepes.2023.109444
Liu, Z., Wu, Q., Ma, K., Shahidehpour, M., Xue, Y., and Huang, S. (2019). Two-stage optimal scheduling of electric vehicle charging based on transactive control. IEEE Trans. Smart Grid 10 (3), 2948–2958. doi:10.1109/tsg.2018.2815593
Long, T., Jia, Q. H., Wang, G. M., and Yang, Y. (2021). Efficient real-time EV charging scheduling via ordinal optimization. IEEE Trans. Smart Grid 12 (5), 4029–4038. doi:10.1109/tsg.2021.3078445
Manzolli, J. A., Trovão, J. P., and Henggeler Antunes, C. (2022). Electric bus coordinated charging strategy considering V2G and battery degradation. Energy 254, 124252. doi:10.1016/j.energy.2022.124252
Mathioudaki, A., Tsaousoglou, G., Varvarigos, E., and Fotakis, D. (2021). “Efficient online scheduling of electric vehicle charging using a service-price menu,” in Proceedings of the 2021 International conference on smart energy systems and technologies (SEST), Vaasa, Finland, September 2021, 1–6.
Mirjalili, S., and Lewis, A. (2016). The whale optimization algorithm. Adv. Eng. Softw. 95, 51–67. doi:10.1016/j.advengsoft.2016.01.008
Rezaei, F., Safavi, H. R., Abd Elaziz, M., and Mirjalili, S. (2023). GMO: geometric mean optimizer for solving engineering problems. Soft Comput. 27, 10571–10606. doi:10.1007/s00500-023-08202-z
Sperstad, I. B., Degefa, M. Z., and Kjølle, G. (2020). The impact of flexible resources in distribution systems on the security of electricity supply: a literature review. Electr. Power Syst. Res. 188, 106532. doi:10.1016/j.epsr.2020.106532
Tan, K. M., Yong, J. Y., Ramachandaramurthy, V. K., Mansor, M., Teh, J. S., and Guerrero, J. M. (2023). Factors influencing global transportation electrification: comparative analysis of electric and internal combustion engine vehicles. Renew. Sustain. Energy Rev. 184, 113582. doi:10.1016/j.rser.2023.113582
Wan, Z., Li, H., He, H., and Prokhorov, D. (2019). Model-free real-time ev charging scheduling based on deep reinforcement learning. IEEE Trans. Smart Grid 10 (5), 5246–5257. doi:10.1109/tsg.2018.2879572
Wang, H., Zheng, T., Sun, W., and Khan, M. Q. (2023). Research on the pricing strategy of park electric vehicle agent considering carbon trading. Appl. Energy 340, 121017. doi:10.1016/j.apenergy.2023.121017
Wang, Y., Gan, S., Li, K., and Chen, Y. (2022). Planning for low-carbon energy-transportation system at metropolitan scale: a case study of Beijing, China. Energy 246, 123181. doi:10.1016/j.energy.2022.123181
Wu, J., Zhang, M., Xu, T., Gu, D., Xie, D., Zhang, T., et al. (2023). A review of key technologies in relation to large-scale clusters of electric vehicles supporting a new power system. Renew. Sustain. Energy Rev. 182, 113351. doi:10.1016/j.rser.2023.113351
Xu, D., Wu, Q. W., Zhou, B., Li, C. B., Bai, L., and Huang, S. (2020a). Distributed multi-energy operation of coupled electricity, heating and natural gas networks. IEEE Trans. Sustain. Energy 11 (4), 2457–2469. doi:10.1109/tste.2019.2961432
Xu, D., Zhou, B., Wu, Q. W., Chung, C. Y., Li, C. B., Huang, S., et al. (2020b). Integrated modelling and enhanced utilization of power-to-ammonia for high renewable penetrated multi-energy systems. IEEE Trans. Power Syst. 35 (6), 4769–4780. doi:10.1109/tpwrs.2020.2989533
Yan, L., Chen, X., Zhou, J., Chen, Y., and Wen, J. (2021). Deep reinforcement learning for continuous electric vehicles charging control with dynamic user behaviors. IEEE Trans. Smart Grid 12 (6), 5124–5134. doi:10.1109/tsg.2021.3098298
Zhang G., G., Wen, J., Xie, T., Zhang, K., and Jia, R. (2023). Bi-layer economic scheduling for integrated energy system based on source-load coordinated carbon reduction. Energy 280, 128236. doi:10.1016/j.energy.2023.128236
Zhang XS., X. S., Guo, Z. X., Pan, F., Yang, Y. Y., and Li, C. S. (2023). Dynamic carbon emission factor based interactive control of distribution network by a generalized regression neural network assisted optimization. Energy 283, 129132. doi:10.1016/j.energy.2023.129132
Keywords: distribution network, economic dispatching, electric vehicle, geometric mean optimizer, dynamic carbon emission factor
Citation: Xin S, Jiahao L, Yujun Y, Jianlin T, Xiaoming L and Bin Q (2023) Bi-level optimal dispatching of distribution network considering friendly interaction with electric vehicle aggregators. Front. Energy Res. 11:1338807. doi: 10.3389/fenrg.2023.1338807
Received: 15 November 2023; Accepted: 06 December 2023;
Published: 29 December 2023.
Edited by:
Shiwei Xie, Fuzhou University, ChinaCopyright © 2023 Xin, Jiahao, Yujun, Jianlin, Xiaoming and Bin. This is an open-access article distributed under the terms of the Creative Commons Attribution License (CC BY). The use, distribution or reproduction in other forums is permitted, provided the original author(s) and the copyright owner(s) are credited and that the original publication in this journal is cited, in accordance with accepted academic practice. No use, distribution or reproduction is permitted which does not comply with these terms.
*Correspondence: Tang Jianlin, dGFuZ2psMkBjc2cuY24=
Disclaimer: All claims expressed in this article are solely those of the authors and do not necessarily represent those of their affiliated organizations, or those of the publisher, the editors and the reviewers. Any product that may be evaluated in this article or claim that may be made by its manufacturer is not guaranteed or endorsed by the publisher.
Research integrity at Frontiers
Learn more about the work of our research integrity team to safeguard the quality of each article we publish.