 Lidong Qin
 Hengrui Ma
 Cunqiang Huang2
 Shidong Wu
94% of researchers rate our articles as excellent or good
Learn more about the work of our research integrity team to safeguard the quality of each article we publish.
Find out more
ORIGINAL RESEARCH article
Front. Energy Res. , 03 January 2024
Sec. Sustainable Energy Systems
Volume 11 - 2023 | https://doi.org/10.3389/fenrg.2023.1337164
This article is part of the Research Topic Smart Energy System for Carbon Reduction and Energy Saving: Planning, Operation and Equipments View all 42 articles
Integrated energy system is crucial in realizing China’s “dual carbon” targets. Considering the carbon capture based electricity to gas and the interaction of multiple markets, this paper proposes a low-carbon operation optimization method of integrated energy system. In terms of market policy, a coupling trading mechanism for carbon trade and green certificates is established. This approach is intended to delve into the profound significance of utilizing green certificates in carbon emission reduction. In terms of equipment models, the coupling model of carbon capture equipment with coal-fired cogeneration unit, as well as power-to-gas equipment with renewable energy, is con-structed. In addition, this equipment model is introduced into the operation optimization scheduling of the comprehensive energy systems. A low-carbon economic operational strategy is further proposed to minimize the daily operational costs, by which the integrated energy system is eco-nomically, environmental protection optimized. To verify the effectiveness and feasibility of the proposed model, this paper sets up several comparison scenarios and conducts the simulations using GUROBI solver. The results show that the proposed strategy can effectively improve the uptake rate of renewable energy, reduce the carbon emission, improve the operation economy, and realize the complementary incentive effect between markets.
In recent years, the rapid advancement of science and technology has propelled the economy, intensifying the significance of efficient energy resource utilization and consumption (Zhu et al., 2021; Kouveliotis-Lysikatos et al., 2022; Wu et al., 2022). As a result, there has been a notable increase in the consumption of fossil fuels, giving rise to environmental challenges that present a significant obstacle to global economic development in the present era. In this context, developing inte-grated energy systems, reducing carbon emissions from energy resources, and achiev-ing a transition towards clean energy has become crucial global objectives (Huang et al., 2022; Li et al., 2023).
Carbon capture and storage (CCS) technology offers technical backing to achieve dual carbon objectives. It can be combined with traditional energy production methods, and provides an emission reduction option for the transition period and provides time and space for clean energy development (Zhang et al., 2022). Power-to-Gas (P2G) technology transforms electricity into gas energy, serving as a crucial technical approach to drive the utiliza-tion of renewable energy. By combining these two technologies, the carbon needed for the energy conversion process in P2G can be captured using CCS. This integration not only promotes the consumption of renewable energy but also involves carbon resource utilization (Luo et al., 2022; Ma et al., 2018). For example, Li et al., 2023a considered the role of P2G in the consumption of re-newable energy, and. constructed a P2G-CCS coupling model utilizing the coupling device known as P2G-CCS-CHP. Li et al., 2023c proposed a two-tier optimal scheduling model for an integrated energy system with CCS and P2G, which improves the economy of the integrated energy system and the absorptive capacity of wind energy and solar energy. Ma et al., 2021 constructed a coupling model containing P2G-CCS-CHP, and analyzed the ther-moelectric coupling characteristics of CHP units in detail, proving that the model can not only improve renewable energy consumption and reduce system carbon emissions, but also improve CHP Power supply flexibility of the unit. Li et al., 2023d constructed a two-layer optimization model of P2G-CHP combined heat and power generation, and considered the problem of P2G on the optimization of energy storage system configuration, and verified that P2G can improve the economy of the system. Literature Kang et al., 2012 deeply stud-ied the energy flow inside CCS, and analyzed the peak-shaving characteristics of CCS, which has a significant effect in reducing the cost of peak-shaving. The preceding study focused on equipment optimization for low-carbon operational enhancement of the integrated energy system. Yet, they overlooked market mechanism constraints, limiting the ability to fully utilize the integrated energy system’s potential in renewable energy consumption.
Regarding market-oriented mechanism research, the establishment of multiple markets is a significant policy measure supporting the growth of renewable energy. This approach aids in carbon emission reduction and the advancement of green energy development, ultimately contributing to the creation of a new power system (Han et al., 2021). For in-stance, China’s current mainstream green market includes Renewable Portfolio Stand-ard (RPS), Carbon Emission Trading (CET) and Green Certificate Trading (GCT), among which GCT is the product of RPS (Wang et al., 2022; Shang et al., 2023 summarizes the status quo of each market construction, analyzes the interaction relationship and influence mechanism among each market, and provides exploration suggestions for the next step of market development. Chen and Jiang, 2023 established an integrated energy system market coupled transaction operation optimization model, pointed out the influence mechanism of carbon and green certificate markets on the electricity market, and verified that the coupled mar-ket model can promote renewable energy consumption and significantly reduce system carbon emissions. Feng et al., 2021 proposed to associate green power generation enterprises with traditional fossil energy power generation enterprises, and to increase the consump-tion rate of renewable energy and limit the carbon emissions of traditional fossil ener-gy power generation by allocating green certificates and carbon emission rights. Luo et al., 2021 built a carbon-green card joint trading market framework model, introduced condi-tional risk value to quantify the degree of market risk, analyzed the impact of market prices, and verified the feasibility and effectiveness of the model. Despite attempts in previous research to implement both markets, there is an ongoing requirement for a more in-depth examination of the integration of these market mechanisms. Without such integration, the complete potential of market mechanisms in advancing the low-carbon and cost-efficiency aspects of the integrated energy system may not be ful-ly harnessed.
In summary, the majority of existing low-carbon research on integrated energy systems primarily focuses on analyzing technical equipment or standalone market mechanisms, giving lesser consideration to the coupling trading mechanism. Based on this, this paper considers both carbon capture power-to-gas and multi-market interac-tion, and proposes a low-carbon operation optimization method for integrated energy system. Specifically, a low-carbon economic operation optimization model is con-structed, where the influence of CCS-P2G and CET-GCT coupling trading mechanism on system operation is considered. The optimization goal is to minimize the compre-hensive energy cost of the system. Examples verify that the proposed strategy can ef-fectively improve the output of renewable energy, reduce the carbon emissions, im-prove the economy of system operation, and realize the complementary incentive ef-fect between markets.
As shown in Figure 1, the IES constructed in this paper includes CHP cogeneration, P2G operation link and CCS coupling operation link. The CCS is coupled with the car-bon emission source CHP unit, and the CHP unit is used as the source of CCS equip-ment. P2G is coupled with wind and solar renewable energy. To promote the absorp-tion of abandoned wind and solar power, P2G is set to operate when there is aban-doned wind and solar power in the system, greatly increasing the consumption rate of renewable energy (Yang et al., 2022a; Zhang et al., 2023).
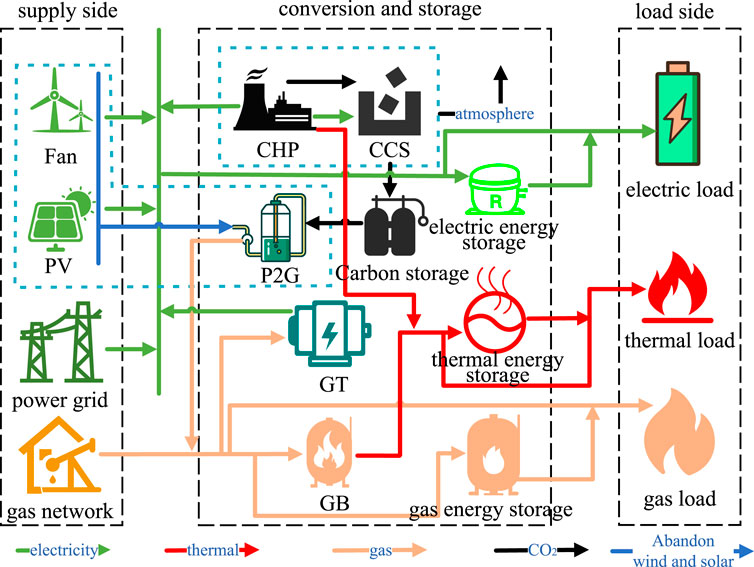
FIGURE 1. Integrated energy system with carbon capture from power-to-gas.
The CHP coal-fired cogeneration system can meet the electricity demand of CCS and electric load through coal. Furthermore, it can recover the waste heat in the power generation process and supply the heat load demand (Liu et al., 2021). The power of CHP cogeneration can be divided into the following two parts according to its function, as Eq. 1:
where
According to the operation characteristics ' heat-determined power ' of CHP unit, the electro-thermal characteristics of CHP unit can be described as Eq. 2 (Zhang et al., 2023):
where
The upper and lower limits of the electric heating power output of the CHP unit are as follows Eq. 3:
where
The output ramp constraint of CHP unit is as Eq. 4:
where
Amidst the ongoing low-carbonization trend within the energy industry (Xu et al., 2023), con-ducting research on carbon capture technology holds crucial significance for optimiz-ing the low-carbon operation of integrated energy systems. This paper employs CCS operation with liquid storage and configures P2G to activate only when the system has excess wind and solar power (Lu et al., 2023). CCS uses the electric energy provided by CHP to cap-ture the carbon dioxide it emits. To address the issue of disparate operation duration between P2G and CCS, as well as the supply of carbon dioxide required by P2G, a car-bon storage device with energy time shift characteristics is introduced. The specific energy conversion links are as follows:
CCS has the capability to capture the carbon dioxide emissions from CHP units, which can then be reused in P2G. The expressions of carbon capture are as Eqs 5, 6:
where
According to Eqs 1, 2, 6, the power constraints of CHP units supplying power network can be obtained as Eq. 7:
Comparing Eqs 1, 2, 7, it can be seen that after the CCS carbon capture equipment is coupled with the CHP unit, the lower limit of the power supply power of the CHP unit is smaller than that before the coupling, and the overall power supply adjustment range is larger, which enhances the flexibility of the power adjustment of the CHP unit power supply network.
The carbon dioxide released from the CHP unit is stored following CCS capture. This approach not only minimizes carbon transaction expenses but also enables the utilization of stored carbon dioxide for initiating P2G. Consequently, it effectively addresses the challenge of surplus wind power utilization (Li et al., 2023). The models of carbon storage equipment are as Eqs 8, 9:
where
By electrolyzing water to create hydrogen and synthesizing methane, P2G trans-forms electric energy into gas energy. In optimizing the operation of an integrated en-ergy system, incorporating P2G equipment enables energy conversion, storage, and ef-fective scheduling. This serves to enhance the operational efficiency and overall per-formance of the energy system (Tao et al., 2021). The implementation of P2G power-to-gas technology can effectively address the renewable energy consumption problem (Lyu et al., 2023). For this reason, P2G will operate only when there is excess wind and solar power, significantly en-hancing the consumption rate of renewable energy. At the same time, the carbon di-oxide captured by CCS carbon capture equipment can be used to synthesize CH4 and supply the gas network of the system.
P2G is set as a means of renewable energy consumption in this paper, based on which the output models of renewable energy are as Eqs 10, 11:
where
P2G is mainly realized through two technical parts: The first part involves water electrolysis to produce hydrogen, a process consuming electrical energy. This step is configured to utilize wind and solar power, significantly boosting the consumption rate of renewable energy within the integrated energy system. The second part is the synthesis process of CH4. In this stage, CH4 is synthesized by chemical reaction between hydrogen produced in the first stage and carbon dioxide captured by CCS, which can effectively reduce the carbon emission content of the system (Wang et al., 2022). The computation for the quantity of CH4 generated is outlined as Eqs 12, 13:
where
Considering that the energy supply source of P2G is the power of abandoned wind and light, so according to (Eq. 10) and (Eq. 13), the upper and lower limits of its operating power can be written as Eq. 14:
The consumed carbon dioxide is the
where
The carbon trading market is a market-based mechanism designed to decrease greenhouse gas emissions, enabling the buying and selling of carbon emissions, effectively treating them as commodities. The main goal is to encourage enterprises to reduce greenhouse gas emissions through economic incentives, by which enterprises and countries can obtain a specific number of emission quotas according to their emission levels (Chen et al., 2023). If the carbon emissions generated during the production process exceed the carbon quota set by the government, quota need to be purchased in the carbon trading market to meet policy requirements; otherwise the carbon emissions generated during the production process are lower than the carbon quota set by the government, then the remaining allowances can be sold in the carbon trading market for revenue (Li et al., 2023f).
At present, the initial carbon in China mainly includes three allocation methods: free allocation, auction allocation, and combination of free allocation and auction allocation (Xun and Raksincharoensak, 2022; Zhou et al., 2023). Liu (2023) carbon emission sources in IES mainly include purchased electricity, gas boilers, gas turbines and CHP coal-fired units. Taking thermal power generation as an example, the calculation of carbon emission quota is as Eq. 16:
where
Gives the accounting method of actual carbon emissions. The calculation method of actual carbon emissions in IES is as Eq. 17:
where
Given that this paper incorporates both CCS carbon capture equipment and P2G power-to-gas equipment, the calculation method for actual carbon emissions in IES should be modified to the Eq. 18:
The calculation of carbon emissions from fossil fuels is described as Eqs 19, 20, 21:
where
In this paper, fossil fuels include natural gas and coal, and the calculation method of activity data is as Eqs 22, 23:
where
The calculation of carbon emissions of purchased electricity in IES is as Eq. 24:
where
To control the total amount of carbon emissions, this paper uses the ladder-type carbon trading model in (Zou et al., 2023), so that the greater the carbon emissions, the greater the carbon trading price in the corresponding interval. The calculation method of the step-by-step carbon trading cost is as Eq. 25:
where
The green certificate is a certification for renewable energy generation issued by governments to power generation companies. It stems from the renewable energy quota system and signifies the environmentally friendly characteristics of renewable energy (Zhu et al., 2023). The green certificate trading market can be analogized to a financial market within the environmental domain (Gao et al., 2023). Typically, government agencies set the indicators for renewable energy quotas. The proportion of renewable energy generation from renewable energy power generation enterprises must comply with relevant regulations. To be specific, green electricity can be quantified into a certain number of green certificates based on a specific proportion. When a company possesses more green certificates than the government’s designated quota, they can sell the surplus certificates on the green certificate trading market to generate revenue. Conversely, if the company has fewer green certificates than required by the quota, they need to purchase additional certificates from the green certificate trading market to meet the quota (Zhang et al., 2022).
According to China’s green certificate transaction policy, the green certificate transaction model constructed in this paper is as Eq. 26:
where
The process diagram of the interaction mechanism between carbon trading and green card trading is shown in Figure 2. Given that the green certificate encompasses comprehensive details regarding new energy grid integration and allows for precise quantification of carbon emission reductions from the new energy supply, once ownership of green rights and interests is clearly defined, a connection between CET and GCT can be established using the information within the green certificate. Building upon the initial engagement in GCT, the green certificate will counterbalance a portion of carbon emissions during the assessment of carbon emission rights through the quantified carbon emission reductions from the associated new energy. This process consequently influences CET (Yan et al., 2021). The inception of the green certificate trading market aims to incentivize renewable energy power generation companies. To mitigate duplicative incentives, this paper suggests that green certificates designated for carbon emission reduction should not be tradable within the green certificate market, ensuring their exclusive use for transactions related to the green certificate market. Furthermore, the certificate implies that carbon emission reduction within its own system cannot proceed. In such cases, the green certificate concurrently engages in both CET and GCT, achieving interaction between the two by considering factors like their individual market demand and transaction prices (Cui et al., 2023; El-Bahay et al., 2023).
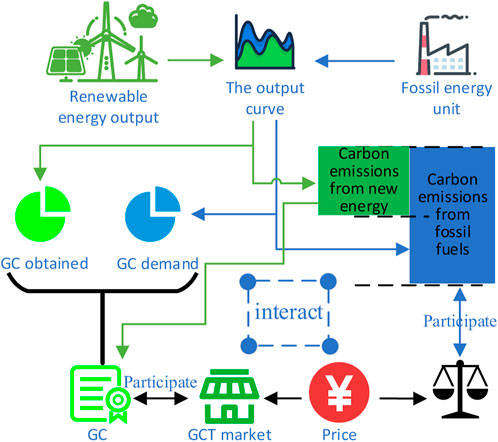
FIGURE 2. Flow chart of the coupling transaction mechanism.
The calculation method of the carbon emission reduction implicit in the green certificate is as Eq. 27:
where
When considering the interaction mechanism between CET and GCT, GCT mechanism will also be affected. The cost calculation of the improved carbon trading is as Eq. 28:
The objective function in the IES economic scheduling model for carbon trading and green certificate transactions aims to minimize the total cost, considering carbon transaction costs, revenue from green certificate transactions, expenses related to electricity and gas purchases, and operation and maintenance costs for each equipment in the system. As Eq. 29.
1. Ladder carbon transaction cost [see (Eq. 28)].
2. Green certificate trading revenue [see (Eq. 26)].
3. Power purchase cost is as Eq. 30.
where
4. Cost of purchasing coal and gas are as Eq. 31.
where
5. Operation and maintenance costs of renewable energy are as Eq. 32.
where
6. CCS-P2G operating cost are as Eq. 33.
where
1. Power balance constraints
For all types of loads, the Eqs 34, 35, 36 power constraints must be met:
where
2. CCS constraint
The amount of carbon dioxide captured by carbon should satisfy the Eq. 37 constraints:
where
3. Green certificate trading constraints
Green certificate transactions should meet the Eq. 38 quota constraints:
where
4. Constraints of energy storage equipment
The energy storage system must adhere to constraints on stored energy capacity as well as upper and lower limits on charging and discharging power. As Eqs 39, 40, 41, 42, 43.
where
5. Gas turbine constraints
The gas turbine must meet the constraints of rated power and ramp rate, as Eqs 44, 45:
where
6. Gas boiler constraints
Gas-fired boilers must meet the constraints of rated power and ramp rate, as Eqs 46, 47:
where
7. External network constraints
Constraints on the range of external energy exchange in IES, as Eqs 48, 49:
where
This paper presents a low-carbon economic day-ahead scheduling model for an integrated energy system, incorporating considerations of carbon capture, power-to-gas technologies, and trading mechanisms (Jogunola et al., 2022; Li et al., 2021). The model’s solution falls under the category of a mixed-integer linear programming problem (Yang et al., 2022b; Yang et al., 2018). The formulation is as the Eq. 50:
where
The simulation and solution process involve using MATLAB (R2016a) to call the YALMIP toolbox and the commercial optimization solver GUROBI. The solution process is depicted in Figure 3:
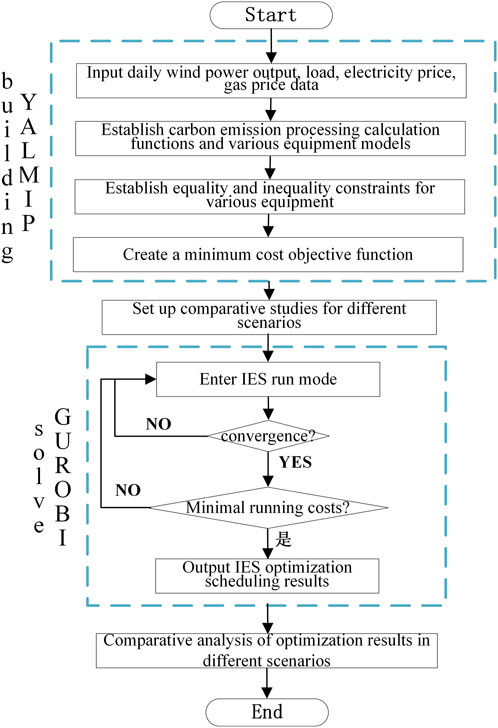
FIGURE 3. Flow chart of model solution.
The simulation example used in this paper is the IES shown in Figure 1. The various equipment parameters (Ma et al., 2021) essential for the optimizing the model are provided in Table 1. The curves of electric heating, gas load and wind power forecast output power (Li et al., 2023) are depicted in Figure 4. The trading mechanism Various parameters are shown in Table 2, and time-of-use electricity price, gas price and coal price are shown in Table 3. The da-ta used is an industrial park in western China. To facilitate a clear comparison of the optimization outcomes, this paper enhances various datasets based on actual curves and their corresponding probability distributions. The optimization period for sched-uling is set at 24 h with a time step of 1 h. The study delves into an analysis of the proposed model based on the intraday optimization results.
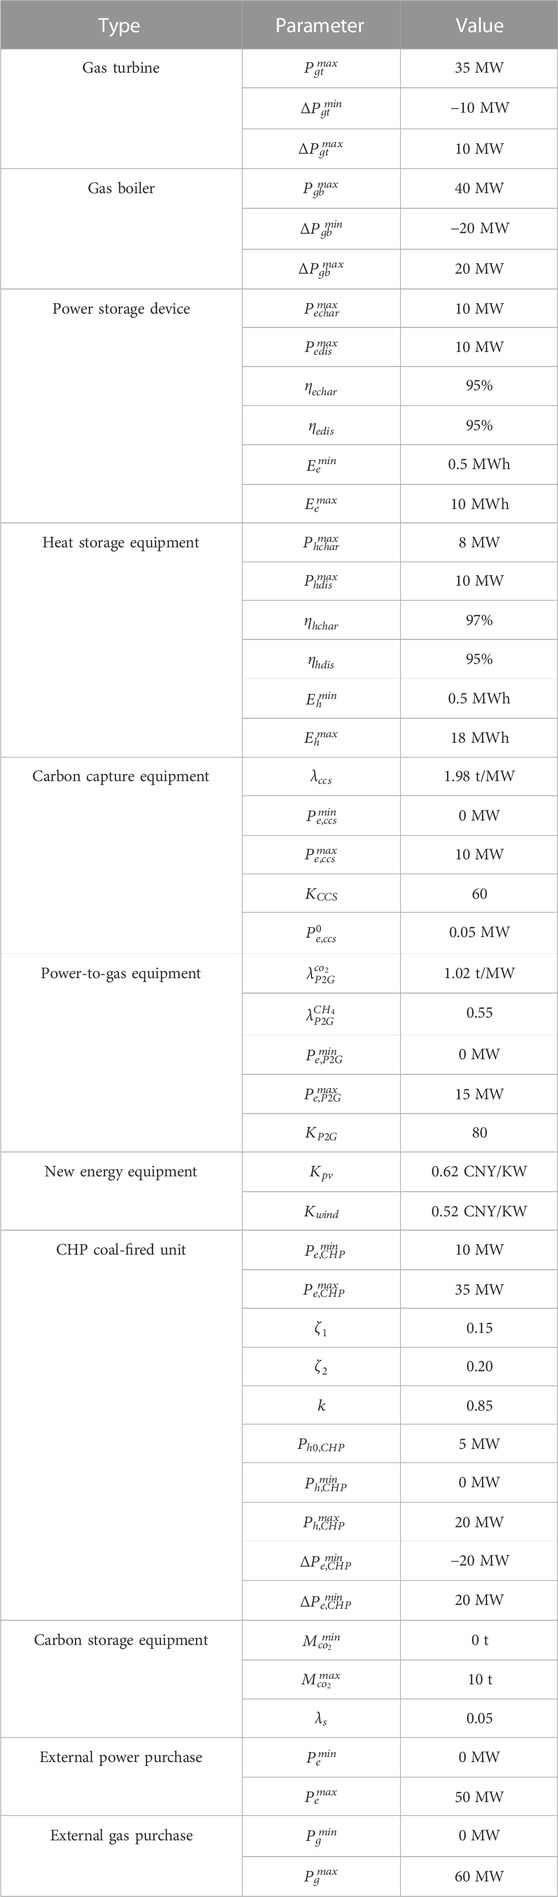
TABLE 1. Parameters of each equipment in the system.

FIGURE 4. Load and renewable energy output curves.
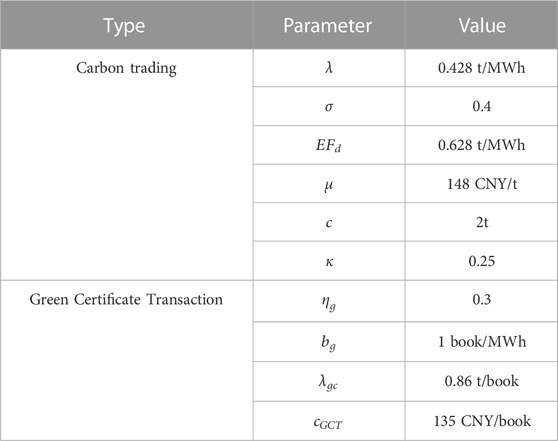
TABLE 2. Transaction mechanism related parameters.
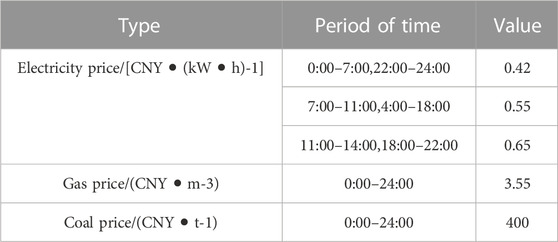
TABLE 3. Time-of-use electricity price, gas price and coal price.
In order to verify the effectiveness and feasibility of the model proposed in this paper, and analyze the differences between P2G-CCS equipment and GCT-CET mechanism in traditional optimization and existing research optimization, the innovation of the model proposed in this paper can be verified by multi-scenario comparison. Therefore, the following six comparison scenarios are set up in this paper.
Scenario 1: Optimization of IES operation without considering Power-to-Gas with Carbon Capture and Storage (P2G-CCS) and transaction mechanisms.
Scenario 2: Optimization of IES operation considering the traditional carbon trading mechanism derived from a unified formula. This scenario excludes optimiza-tion of IES operation involving P2G-CCS equipment, ladder carbon trading, and the green certificate trading mechanism.
Scenario 3: Optimization of IES operation considering P2G-CCS and the tradi-tional carbon trading mechanism, while excluding ladder carbon trading and the green certificate trading mechanism.
Scenario 4: Optimization of IES operation considering P2G-CCS and the ladder carbon trading mechanism, without considering the green certificate trading mecha-nism.
Scenario 5: Optimization of IES operation considering P2G-CCS and the ladder carbon trading-green certificate trading mechanism, but without considering the cou-pling relationship between the trading mechanisms.
Scenario 6: Optimization of IES operation considering P2G-CCS and a coupled transaction mechanism.
To validate the rationality and effectiveness of the scheduling model proposed in this paper, the example results are analyzed from the perspectives of cost, renewable energy integration rate, carbon emissions, and unit scheduling.
Table 4 shows the optimized cost results of the six different scheduling scenarios, the unit is ten thousand CNY.
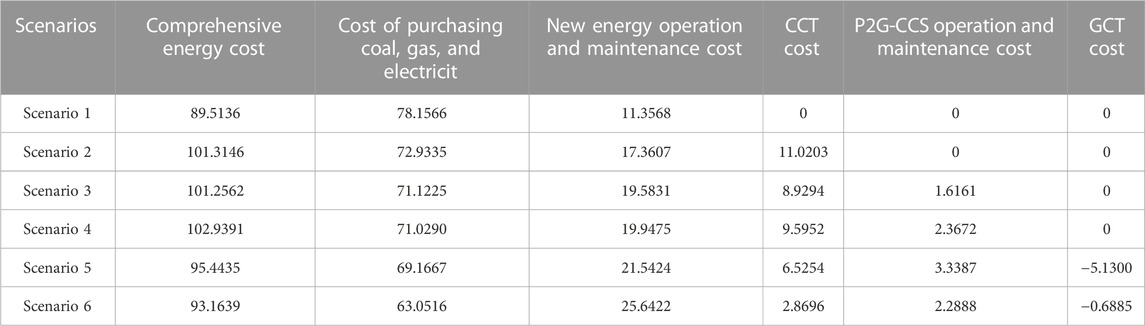
TABLE 4. Cost optimization results of each scenario.
By comparing the results of scenario 1 and scenario 2, it can be seen that the overall operating cost of the system is increasing, which is caused by the cost constraint of the carbon trading mechanism. In addition, comparing various sub-cost factors, the cost of external coal, electricity, the gas purchases in Scenario 2 is significantly reduced. According to the model settings, it can be seen that in order to meet various load demands, except for purchasing energy, the difference between the supply side of scenarios 1 and 2 lies in the consumption rate of renewable energy. From this, it can be obtained that scenario 2 increases the consumption of renewable energy to a certain extent compared with scenario 1.
By comparing the results of scenario 2 and scenario 3, the comprehensive energy cost difference is minor. In terms of various sub-costs, the carbon trading cost is reduced while an additional operating and maintenance cost of 16,100 yuan for P2G-CCS is incurred. This suggests that the operation of P2G-CCS utilizes a portion of the system’s carbon dioxide, consequently reducing the system’s carbon trading cost. The operation and maintenance cost of wind and solar power has increased. This is due to the coupling of P2G with renewable energy sources, as P2G operation absorbs a portion of the renewable energy, thereby increasing the system’s renewable energy integration rate.
Through the comparison of the results of scenario 3 and scenario 4, the overall cost is not much different, and the cost of scenario 4 is relatively increased. The difference lies in the different carbon trading mechanisms between the two. The carbon trading mechanism in scenario 4 makes its carbon constraints stronger due to the tiered price, and the resulting costs will be relatively increased. However, this also imposes a more pronounced constraint on the system’s carbon emissions, encouraging a reduction in the system’s carbon emissions. Through the comparison of various sub-costs, it can be found that the operating cost of P2G and CCS in scenario 4 is significantly higher than that in scenario 3, and the gap between the remaining sub-costs is very small, so the carbon emissions captured and utilized by P2G-CCS are higher than that in scenario 3.
Through the comparison of the results of scenario 4 and scenario 5, the comprehensive cost of scenario 5 is significantly lower than that of scenario 4, and the difference between the two scenarios lies in the implementation of the green certificate transaction mechanism. Thus we can get the benefits brought by the implementation of the green certificate transaction mechanism to the system operation revenue. This is evident from the sub-cost result of green certificate income in scenario 5, which amounts to 51,300 CNY. In comparison to the various sub-costs, the carbon trading expenses have decreased, indicating a reduction in carbon emissions. This decrease in carbon emissions signifies a reduction in the utilization of non-renewable energy at the supply end, resulting in an increase in the operational power of P2G-CCS. The comparison of purchased energy costs and P2G-CCS operating costs also verifies the rationality of the above analysis. To meet the balance between supply and demand, the output of renewable energy should be increased accordingly. At the same time, the cost of wind and solar operation and maintenance has increased, which shows that Scenario 5 has a greater increase in the consumption rate of renewable energy than Scenario 4.
Comparing the results of scenarios 5 and scenarios 6, the comprehensive operating cost of scenario 6 is lower than that of scenario 5, and the revenue brought by the green certificate in Scenario 6 is 44,400 CNY less than that of Scenario 4. The reduction of its income is caused by the setting of the coupling relationship of the trading mechanism in scenario 6. Due to the coupling and interaction between carbon trading and the green certificate trading market in Scenario 6, some green certificates are not sold, but the carbon emission reduction effect behind some green certificates is used to offset some carbon emissions and reduce carbon transaction costs.
Based on the cost analysis of the above scenarios, the existence of the trading mechanism has improved the consumption rate of renewable energy, and the P2G-CCS equipment can further reduce the carbon emissions of the system while reducing the carbon constraints of the trading mechanism. It is verified that the proposed model can improve the economy and low-carbon nature of the system, while also increasing the consumption rate of renewable energy.
Figure 5 depicts the comparison chart of the total renewable energy output curves in each scenario. Table 5 is the daily curtailment of wind and solar power in various scenarios. For the ease of comparison, renewable energy is no longer classified and analyzed. In scenario 1, the total abandoned wind and optical power reaches 468.21 MWh, and the absorption rate is 31.87%. After the initial implementation of traditional carbon trading constraints, Scenario 2 increases the output of renewable energy by 243.67 MWh, and the consumption rate is increased significantly. Among them, P2G also plays a role in promoting the consumption of renewable energy. The renewable energy consumption rate in scenario 3 is further improved, reaching 67.62%. The reason is that the carbon constraints of the ladder carbon trading mechanism have more severe restrictions on carbon emissions. To minimize system carbon emissions, the primary approach involves reducing overall primary energy consumption within the system. Additionally, increasing the power utilized by P2G-CCS necessitates a higher share of renewable energy to achieve a balanced equilibrium, meeting the demand-supply equilibrium. In Scenario 4, the total curtailed wind and solar power is decreased to 11.37 MWh. This illustrates that the system, with the inclusion of the green certificate trading market, significantly stimulates the utilization of renewable energy to augment revenue. In scenario 5, the utilization rate of renewable energy reaches 98.35%, representing a further enhancement compared to scenario 4.

FIGURE 5. New energy output and consumption diagram for each scenario.
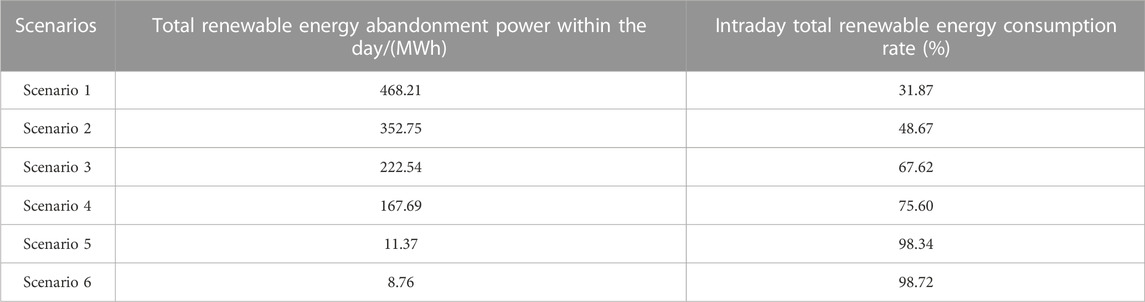
TABLE 5. Renewable energy consumption data.
The categorization and comparison of the comprehensive trading mechanisms, namely, scenarios 1 and 2, 3, 4, 5, and 6, reveal that the implementation of trading mechanisms significantly enhances the rate of renewable energy consumption. How-ever, it is important to note that China’s domestic green certificate trading market is in its early stages, and the stability of green certificate income is still under development. While the carbon trading market is progressing towards maturity, the coupled trading mechanism proposed in Scenario 6 is expected to greatly advance the development of the green certificate trading market.
Figure 6 illustrates a comparative chart showcasing carbon emissions and P2G gas production power results for each scenario. The calculation of carbon emissions for each scenario adheres to the specified calculation method outlined in the carbon trad-ing market.
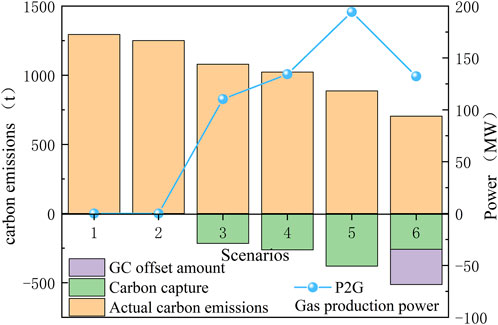
FIGURE 6. Carbon emissions and P2G gas production power in each scenario.
It can be seen from the comparison in Figure 6 that, due to the absence of carbon constraints and carbon utilization in Scenario 1, the carbon emissions will reach the peak when the cost target is minimized. Scenario 2 introduces a ladder carbon trading mechanism, which sets preliminary constraints on carbon emissions, which reduces carbon emissions by 44.22 t compared with Scenario 1. In Scenario 3, under the opera-tion of P2G-CCS coupling equipment, part of the carbon emissions of the system is ab-sorbed and utilized, and P2G uses carbon dioxide to generate a certain amount of CH4, which alleviates the pressure of regional energy consumption to a certain extent. Compared with Scenarios 1, 2, and 3, Scenario 4 has a significant reduction in carbon emissions, indicating that the carbon constraints of the ladder carbon trading mecha-nism are relatively greater, under the premise of strengthening carbon constraints, the utilization rate of CCS carbon capture and P2G gas production in Scenario 4 is higher than that in Scenario 3, which verifies that carbon constraints can increase the sys-tem’s output on carbon capture and utilization. In comparison to Scenario 4, Scenario 5 demonstrates a reduction of 167.28 t in carbon emissions and an increase of 69.13% in the capture and utilization of CCS-P2G. This validates that the integration of the green certificate trading market imposes more effective constraints on carbon emis-sions. It is evident that the introduction of market mechanisms holds significant im-portance for carbon emissions control. In Scenario 6, the reduction in carbon emissions calculated in the carbon market surpasses that of other scenarios. The presence of a coupled system allows green certificates to offset a substantial portion of the carbon emission quotas, thereby reducing a portion of the carbon emissions in the carbon market calculations.
Based on the optimization results of carbon emissions in each scenario, it can be seen that the introduction of the trading mechanism can control the carbon emissions of the system to a certain extent. Furthermore, with the incorporation of P2G-CCS coupling equipment built upon the trading mechanism, carbon dioxide can be effec-tively utilized to substantially reduce overall system carbon emissions. The implemen-tation of the coupled trading mechanism will enhance the proactive engagement in the green certificate trading market, broadening its scope of application scenarios.
Considering the coupling transaction mechanism, Figure 7 shows the results of electricity, heat, and gas power balance scheduling in Scenario 6, respectively.
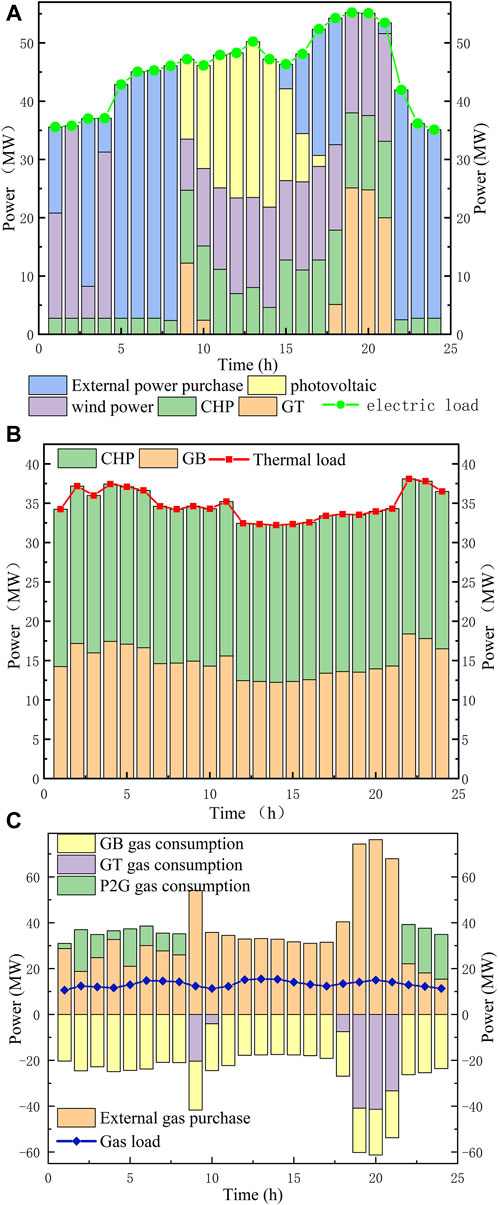
FIGURE 7. (A) Electric energy scheduling; (B) Heat energy scheduling; (C) Gas energy scheduling.
As depicted in Figure 7A, during the low load period (0:00–8:00), the system relies more on purchased electricity from external sources. Additionally, the time-of-use electricity price is lower during this timeframe. Considering P2G’s involvement in gas energy scheduling during this time period as shown in Figure 7B, and with P2G con-figured to utilize excess wind and solar energy, it is evident that P2G consumes a spe-cific amount of renewable energy during this period. The system consumes most of the renewable energy during the peak hours of electric load. Given the substantial energy demand on the load side during this period, coupled with the significant influence of time-of-use electricity prices on the system, the coupling transaction mechanism serves as an incentive, effectively reducing the cost gap between renewable energy power generation and purchased electricity. During this period, the incentive system effec-tively utilizes a substantial amount of renewable energy to meet the high load demand. To accommodate this demand, the Combined Heat and Power (CHP) unit increases its output. It is apparent that upon considering the coupled trading mechanism, the over-all output of gas turbines is relatively lower, thereby reducing carbon emissions from fossil fuels within the system. As indicated in Figure 7B, the CHP unit on the heat load supply side exhibits a higher output, underscoring its cost advantage for supply-ing heating power compared to gas-fired boilers, especially under the ‘heating fixed power’ operating conditions. Figure 7C illustrates that a significant portion of the natural gas required by the system is sourced from the external energy network. Dur-ing the period from 22:00 to 8:00, P2G synthesizes a specific amount of methane, com-pensating for the natural gas demand. Moreover, Figure 7A underscores that P2G be-comes the primary load absorber of renewable energy during the low load valley.
The comprehensive analysis of the results clearly indicates that the low-carbon operational optimization of the integrated energy system, as proposed in Scenario 6, considering the interplay between CCS-P2G and multiple markets, effectively encour-ages renewable energy consumption during peak and off-peak load periods. Addition-ally, at a technical level, P2G also offers a compensatory effect on the system’s natural gas demand.
Considering carbon capture power-to-gas and multi-market interaction mecha-nisms, this paper proposes a low-carbon operation optimization model of an integrat-ed energy system to enhance the system’s economic efficiency and environmental sus-tainability. Furthermore, the mechanism of multi-market interaction can broaden the potential applications of the existing green certificate trading market. From the simu-lations, the following conclusions can be obtained:
1. In terms of equipment, the coupling of CCS and CHP units can improve the flexibility of power supply regulation of CHP units, and can be used as a measure of system carbon emission reduction. The coupling model of P2G and renewable energy output can improve the renewable energy consumption rate.
2. In terms of trading mechanism, the carbon constraints brought by the introduction of the ladder carbon trading mechanism greatly reduce the carbon emissions of the system. The introduction of the green certificate trading mechanism can promote the consumption of renewable energy, and bring benefits to the system and improve the economy of the system.
3. In terms of the coupling trading mechanism, the setting of the carbon trading-green certificate coupling trading mechanism can reduce the carbon emissions of the system to a greater extent and increase the renewable energy consumption rate. At the same time, in view of the current development status of the green certificate market, this mechanism expands the application scenarios of the green certificate market and improves the practicability of the green certificate trading market.
Subsequent research should concentrate on investigating the impact of diverse parameters within the trading mechanism on the optimization of IES operations. This approach will facilitate further refinement of the operational framework for the cou-pled trading market, offering constructive insights for the advancement of the green certificate trading market.
The original contributions presented in the study are included in the article/Supplementary Material, further inquiries can be directed to the corresponding author.
LQ: Methodology, Writing–original draft. HM: Supervision, Writing–review and editing. CH: Resources, Writing–review and editing. HL: Resources, Writing–review and editing. SW: Investigation, Writing–review and editing. GW: Investigation, Writing–review and editing.
The author(s) declare financial support was received for the research, authorship, and/or publication of this article. This research was funded by the State Grid Corporation of China headquarters science and technology project, the project name is to support the new power system construction of new energy friendly grid, source load coordination technology and key equipment research, grant number SGQHJYOOGHJS2100269.
Authors CH and HL were employed by Institute of Economic Technology State Grid Qinghai Electric Power Company.
The remaining authors declare that the research was conducted in the absence of any commercial or financial relationships that could be construed as a potential conflict of interest.
The authors declare that this study received funding from the State Grid Corporation of China headquarters science and technology project. The funder had the following involvement in the study: The funders provided some of the required simulation data in this study.
All claims expressed in this article are solely those of the authors and do not necessarily represent those of their affiliated organizations, or those of the publisher, the editors and the reviewers. Any product that may be evaluated in this article, or claim that may be made by its manufacturer, is not guaranteed or endorsed by the publisher.
Chen, W., and Jiang, Y. (2023). Trading optimization of carbon-green certificate-electricity market coupling. Power Syst. Technol. 47 (6), 2273–2284. doi:10.13335/j.1000-3673.pst.2022.1793
Chen, X., Dong, W., Yang, L., and Yang, Q. (2023). Scenario-based robust capacity planning of regional integrated energy systems considering carbon emissions. Renew. Energy. 207, 359–375. doi:10.1016/j.renene.2023.03.030
Cui, Y., Shen, Z., Wang, Z., Wang, M., and Zhao, Y. (2023). Green dispatch of regional integrated energy system considering green certificate-carbon emission equivalent interaction mechanism. Proc. Chin. Soc. Electr. Eng. 43 (12), 4508–4516. doi:10.13334/j.0258-8013.pcsee.213299
El-Bahay, M. H., Lotfy, M. E., and El-Hameed, M. A. (2023). Effective participation of wind turbines in frequency control of a two-area power system using coot optimization. Prot. Control Mod. Power Syst. 8 (1). doi:10.1186/s41601-023-00289-8
Feng, C., Xie, F., Wen, F., Zhang, Y., and Hu, J. (2021). Design and implementation of joint trading market for green power certificate and carbon based on smart contract. Automation Electr. Power Syst. 45 (23), 1–11. doi:10.7500/AEPS20200925010
Gao, H., Hu, M., He, S., and Liu, J. (2023). Green electricity trading driven low-carbon sharing for interconnected microgrids. J. Clean. Prod. 414. doi:10.1016/j.jclepro.2023.137618
Han, X., Li, T., Zhang, D., and Zhou, X. (2021). New issues and key technologies of new power system planning under double carbon goals. High. Volt. Eng. 47 (9), 3036–3046. doi:10.13336/j.1003-6520.hve.20210809
Huang, S., Wang, J., Guo, P., and Li, Z. (2022). The short-term strategy and long-term prospect of energy structure optimization under the goal of carbon neutrality. Huagong Jinzhan/Chemical Industry Eng. Prog. 41 (11), 5695–5708. doi:10.16085/j.issn.1000-6613.2022-1209
Jogunola, O., Adebisi, B., Anoh, K., Ikpehai, A., Hammoudeh, M., and Harris, G. (2022). Multi-commodity optimization of peer-to-peer energy trading resources in smart grid. J. Mod. Power Syst. Clean. Energy. 10 (1), 29–39. doi:10.35833/MPCE.2020.000136
Kang, C., Ji, Z., and Chen, Q. (2012). Review and prospects of flexible operation of carbon capture power plants. Automation Electr. Power Syst. 36 (6), 1–10. doi:10.3969/j.issn.1000-1206.2012.06.001
Kouveliotis-Lysikatos, I., Hatziargyriou, N., Liu, Y., and Wu, F. (2022). Towards an internet-like power grid. J. Mod. Power Syst. Clean. Energy. 10 (1), 1–11. doi:10.35833/MPCE.2020.000154
Li, G., Zhao, X., Liu, H., Lai, J., and Wang, Y. (2023g). Integrated energy system optimization considering cascading carbon trading mechanism and two-stage operation of power-to-gas. J. Glob. Energy Interconnect. 6 (3), 331–340. doi:10.19705/j.cnki.issn2096-5125.2023.03.013
Li, J., Ai, Q., and Chen, M. (2023e). Strategic behavior modeling and energy management for electric-thermal-carbon-natural gas integrated energy system considering ancillary service. Energy 278. doi:10.1016/j.energy.2023.127745
Li, P., Jiang, L., Zhang, C., Wang, J., Wang, N., Liu, H., et al. (2023d). Coordinated planning of integrated electricity-heat-gas energy system considering renewable energy consumption. IET Gener. Transm. Distrib. 17 (14), 3232–3244. doi:10.1049/gtd2.12895
Li, X., Liu, L., Huang, J., Wu, X., Li, H., and Chen, Y. (2023b). Optimal scheduling of park-level integrated energy system with coupling of p2g and ccs. Proc. CSU-EPSA 35 (4), 18–25. doi:10.19635/j.cnki.csu-epsa.001050
Li, Z., Wu, L., Xu, Y., Wang, L., and Yang, N. (2023c). Distributed tri-layer risk-averse stochastic game approach for energy trading among multi-energy microgrids. Appl. Energy. 331. doi:10.1016/j.apenergy.2022.120282
Li, Z., Xu, Y., Wang, P., and Xiao, G. (2023a). Restoration of multi energy distribution systems with joint district network recon figuration by a distributed stochastic programming approach. IEEE Transactions on Smart Grid. 1-1. doi:10.1109/TSG.2023.3317780
Li, Z., Zhao, B., Chen, Z., Ni, C., Yan, J., Yan, X., et al. (2023f). Low-carbon operation method of microgrid considering carbon emission quota trading. Energy Rep. 9, 379–387. doi:10.1016/j.egyr.2023.03.045
Li, Z. M., Xu, Y., Feng, X., and Wu, Q. W. (2021). Optimal stochastic deployment of heterogeneous energy storage in a residential multienergy microgrid with demand-side management. IEEE Trans. Ind. Inf. 17 (2), 991–1004. doi:10.1109/TII.2020.2971227
Liu, G. (2023). Analysis and suggestion of carbon emission in thermal power plants under the background of carbon peak and carbon neutrality. Clean. Coal Technol. 29 (6), 189–195. doi:10.13226/j.issn.1006-6772.21081205
Liu, Z., Gao, W., Qian, F., Zhang, L., and Kuroki, S. (2021). Potential analysis and optimization of combined cooling, heating, and power (cchp) systems for eco-campus design based on comprehensive performance assessment. Front. Energy Res. 9. doi:10.3389/fenrg.2021.781634
Lu, Z., Shi, B., He, L., Li, X., Guo, X., and Li, Y. (2023). Optimal scheduling of virtual power plant based on CCS-P2G-EMC collaboration. Dianwang Jishu/Power Syst. Technol. 47 (8), 3088–3098. doi:10.13335/j.1000-3673.pst.2023.0458
Luo, Z., Qin, J., Liang, J., Shen, F., Liu, H., Zhao, M., et al. (2021). Day-ahead optimal scheduling of integrated energy system with carbon-green certificate coordinated trading mechanism. Electr. Power Autom. Equip., 248–255. doi:10.16081/j.epae.202109042
Luo, Z., Wang, J., Xiao, N., Yang, L., Zhao, W., Geng, J., et al. (2022). Low carbon economic dispatch optimization of regional integrated energy systems considering heating network and p2g. Energies 15 (15). doi:10.3390/en15155494
Lyu, Z., Lai, Y., Yi, J., and Liu, Q. (2023). Low carbon and economic dispatch of the multi-microgrid integrated energy system using ccs-p2g integrated flexible operation method. Energy Sources Part A-Recovery Util. Environ. Eff. 45 (2), 3617–3638. doi:10.1080/15567036.2023.2195368
Ma, J., Li, Q., Kuehn, M., and Nakaten, N. (2018). Power-to-gas based subsurface energy storage: a review. Renew. Sust. Energ. Rev. 97, 478–496. doi:10.1016/j.rser.2018.08.056
Ma, Y., Wang, H., Hong, F., Yang, J., Chen, Z., Cui, H., et al. (2021). Modeling and optimization of combined heat and power with power-to-gas and carbon capture system in integrated energy system. Energy 236. doi:10.1016/j.energy.2021.121392
Shang, N., Chen, Z., Lu, Z., and Leng, Y. (2023). Interaction principle and cohesive mechanism between electricity market, carbon market and green power certificate market. Dianwang Jishu/Power Syst. Technol. 47 (1), 142–154. doi:10.13335/j.1000-3673.pst.2022.0375
Tao, Y., Qiu, J., Lai, S., Zhao, J., and Xue, Y. (2021). Carbon-oriented electricity network planning and transformation. IEEE Trans. Power Syst. 36 (2), 1034–1048. doi:10.1109/TPWRS.2020.3016668
Wang, H., Shen, X., and Liu, J. (2022a). Planning of new distribution network considering green power certificate trading and carbon emissions trading. Energies 15 (7). doi:10.3390/en15072435
Wang, J., Mao, J., Hao, R., Li, S., and Bao, G. (2022b). Multi-energy coupling analysis and optimal scheduling of regional integrated energy system. Energy 254. doi:10.1016/j.energy.2022.124482
Wu, K. L., Gu, J., Meng, L., Wen, H. L., and Ma, J. H. (2022). An explainable framework for load forecasting of a regional integrated energy system based on coupled features and multi-task learning. Prot. Control Mod. Power Syst. 7 (1). doi:10.1186/s41601-022-00245-y
Xu, P., Fu, W., Lu, Q., Zhang, S., Wang, R., and Meng, J. (2023). Stability analysis of hydro-turbine governing system with sloping ceiling tailrace tunnel and upstream surge tank considering nonlinear hydro-turbine characteristics. Renew. Energy. 210, 556–574. doi:10.1016/j.renene.2023.04.028
Xun, S., and Raksincharoensak, P. (2022). Pedestrian-aware statistical risk assessment. IEEE Trans. Intell. Transp. Syst. 23 (7), 7910–7918. doi:10.1109/TITS.2021.3074522
Yan, Q., Ai, X., and Li, J. (2021). Low-carbon economic dispatch based on a ccpp-p2g virtual power plant considering carbon trading and green certificates. Sustainability 13 (22). doi:10.3390/su132212423
Yang, N., Dong, Z., Wu, L., Zhang, L., Shen, X., Chen, D., et al. (2022b). A comprehensive review of security-constrained unit commitment. J. Mod. Power Syst. Clean. Energy. 10 (3), 562–576. doi:10.35833/MPCE.2021.000255
Yang, N., Qin, T., Wu, L., Huang, Y., Huang, Y., Xing, C., et al. (2022a). A multi-agent game based joint planning approach for electricity-gas integrated energy systems considering wind power uncertainty. Electr. Power Syst. Res. 204. doi:10.1016/j.epsr.2021.107673
Yang, N., Ye, D., Zhou, Z., Cui, J., Chen, D., and Wang, X. (2018). Research on modelling and solution of stochastic scuc under ac power flow constraints. IET Gener. Transm. Distrib. 12 (15), 3618–3625. doi:10.1049/iet-gtd.2017.1845
Zhang, S., Wang, D., Cheng, H., Song, Y., Yuan, K., and Du, W. (2022a). Key technologies and challenges of low-carbon integrated energy system planning for carbon emission peak and carbon neutrality. Automation Electr. Power Syst. 46 (8), 189–207. doi:10.7500/AEPS20210703002
Zhang, Y., Deng, H., Yang, J., Xu, C., Zhou, Z., Wen, F., et al. (2022b). Impacts of renewable portfolio standard on carbon emission peaking and tradable green certificate market: a system dynamics analysis method. Front. Energy Res. 10. doi:10.3389/fenrg.2022.963177
Zhang, Y., Xie, X., Fu, W., Chen, X., Hu, S., Zhang, L., et al. (2023a). An optimal combining attack strategy against economic dispatch of integrated energy system. IEEE Trans. Circuits Syst. II-Express Briefs. 70 (1), 246–250. doi:10.1109/TCSII.2022.3196931
Zhang, Z., Du, J., Li, M., Guo, J., Xu, Z., and Li, W. (2023b). Bi-level optimization dispatch of integrated-energy systems with p2g and carbon capture. Front. Energy Res. 9, 784703. doi:10.3389/fenrg.2023.1109799
Zhou, W., Sun, Y., Zong, X., Zhou, H., and Zou, S. (2023). Low-carbon economic dispatch of integrated energy system considering carbon trading mechanism and laes-orc-chp system. Front. Energy Res. 11. doi:10.3389/fenrg.2023.1134221
Zhu, B., Liu, Y., Zhi, S., Wang, K., and Liu, J. (2023). A family of bipolar high step-up zeta-buckboost converter based on "coat circuit. IEEE Trans. Power Electron. 38 (3), 3328–3339. doi:10.1109/TPEL.2022.3221781
Zhu, M., Xu, C., Dong, S., Tang, K., and Gu, C. (2021). An integrated multi-energy flow calculation method for electricity-gas-thermal integrated energy systems. Prot. Control Mod. Power Syst. 6 (1). doi:10.1186/s41601-021-00182-2
Keywords: carbon capture, power to gas, interaction mechanism, integrated energy system, low carbon economy
Citation: Qin L, Ma H, Huang C, Li H, Wu S and Wang G (2024) Low-carbon operation optimization of integrated energy system considering CCS-P2G and multi-market interaction. Front. Energy Res. 11:1337164. doi: 10.3389/fenrg.2023.1337164
Received: 12 November 2023; Accepted: 11 December 2023;
Published: 03 January 2024.
Edited by:
Zhengmao Li, Aalto University, FinlandCopyright © 2024 Qin, Ma, Huang, Li, Wu and Wang. This is an open-access article distributed under the terms of the Creative Commons Attribution License (CC BY). The use, distribution or reproduction in other forums is permitted, provided the original author(s) and the copyright owner(s) are credited and that the original publication in this journal is cited, in accordance with accepted academic practice. No use, distribution or reproduction is permitted which does not comply with these terms.
*Correspondence: Hengrui Ma, aGVucnkzNzY0QGZveG1haWwuY29t
Disclaimer: All claims expressed in this article are solely those of the authors and do not necessarily represent those of their affiliated organizations, or those of the publisher, the editors and the reviewers. Any product that may be evaluated in this article or claim that may be made by its manufacturer is not guaranteed or endorsed by the publisher.
Research integrity at Frontiers
Learn more about the work of our research integrity team to safeguard the quality of each article we publish.