 Jian Yang
 Bochun Li
- Engineering Technology Research Institute of PetroChina Southwest Oil and Gas Field Company, Chengdu, China
With the scale development of shale gas, the importance of selecting appropriate deliquification process has become increasingly evident in maintaining well productivity and improving shale gas recovery rate. At present, the preferred deliquification process are macro-control plate method and field experience method. The existing methods can only qualitatively select the deliquification process by considering limited influencing factors, resulting in poor process implementation. Based on the results of error analysis, the Gray model was optimized to calculate the pressure distribution in the shale gas wellbore and determine the applicable pressure limit. The W.Z.B. empirical model, which fully considers the influence of wellbore inclination, is used to calculate the gas-liquid carrying situation and determine the applicable liquid carrying limit. By analyzing the technical limits of five commonly used deliquification processes in the Changning shale gas field, namely, plunger lift, optimizing pipe string, gas lift, foam drainage, and intermittent production, a quantitative optimization method for deliquification processes was established. This method was then used to obtain the optimization chart for deliquification processes in shale gas wells. This method was applied in Well Ning 209-X, where the corresponding optimization chart for deliquification processes was drawn based on the production characteristics of the gas well. By quantitatively optimizing the deliquification processes and adjusting to suitable techniques, it effectively guided the production of the gas well and improved the gas field recovery rate.
1 Introduction
The current petroleum industry is in a new phase of conversion from conventional to unconventional, with increasing energy demand (Alotaibi and Al-Qahtani, 2013; Zou et al., 2020; Olubodun, 2022), and clean energy represented by shale gas has become an important target for development, changing the global energy mix. The United States started the “shale gas revolution” in 1985, and “energy independence” was achieved in 2019 (Meisenhelder, 2013; Chin and Roark, 2017). China is the largest shale gas producer outside of North America, and with strong government promotion, the national oil company has made the historic leap of producing 200 × 108 m3 of shale gas per year in just two decades (Zou et al., 2021).
Compared with clastic reservoirs, shale reservoirs have obvious low pore and low permeability characteristics, there is no free water in the reservoir, or even in a water-bearing undersaturated state (Cai et al., 2013; Ojha et al., 2013; Mohanty and Pal, 2017). Since the shale gas reservoir needs to be put into production after volume fracturing to obtain industrial gas flow, it is very difficult to backflow a large amount of fracturing liquid after it is injected into the reservoir. It is generally believed that a certain amount of injected water will be produced in the initial stage of shale gas well production (Zhang et al., 2016; Booth et al., 2017; Song et al., 2022). In the early stage of shale gas well development, production and wellhead pressure increase rapidly, and most wells are directly put into production with empty casing. When production declines rapidly, the production tubing needs to be lowered in time to improve the deliquification capacity of shale gas wells. As the production declines further, the insufficient energy in the gas well to drain all the liquids can lead to liquid accumulation in the wellbore, requiring the selection of suitable deliquification processes. The production system is not scientific (Elwan et al., 2021), the stage production targets are unreasonable (Ghorayeb et al., 2008), and the timing of intervention of the deliquification is unclear (Rubio, 2023), all of which will affect the production of gas wells and reduce the recovery rate. It is necessary to timely select suitable drainage and gas extraction processes based on the production status of shale gas wells.
Changning Shale Gas Field has initially formed a shale gas well drainage and production process system represented by plunger gas lift, optimizing pipe string, gas lift, foam drainage and intermittent production (Guo et al., 2006; Shen et al., 2017; Xiang et al., 2022). At present, the preferred deliquification process are macro-control plate method and field experience method. The existing methods can only qualitatively select the deliquification process by considering limited influencing factors, resulting in poor process implementation. This paper establishes a quantitative preference method for the deliquification process by analyzing five types of deliquification process, taking into account both pressure supply and critical liquid carrying flow rate (Wang et al., 2022). Drawing the corresponding deliquification process optimization chart according to the production characteristics of gas wells, quantitatively preferring the deliquification process, and adjusting the appropriate deliquification process are significant in maintaining the production capacity of shale gas wells and improving the recovery rate of gas fields.
2 Vertical lift performance curve limit in optimization chart
In the production process of shale gas well throughout its life cycle, annual flow, churn flow, slug flow, bubble flow and other flow patterns may occur in turn. At the initial stage of gas well production, the gas rate and water rate are relatively large. Annular flow may appear in the wellbore. The gas is continuous phase and the liquid is dispersed phase, so the lifting efficiency is high; With the decrease of gas production, Slug flow will appear after Annular flow. The gas is a continuous phase and the liquid is a dispersed phase. The lifting efficiency is still high; After the slug flow, if the gas rate of the gas well continues to decline, the lifting efficiency will decline significantly, and Bubble flow and other flow patterns are easy to occur. As shown in Figure 1.
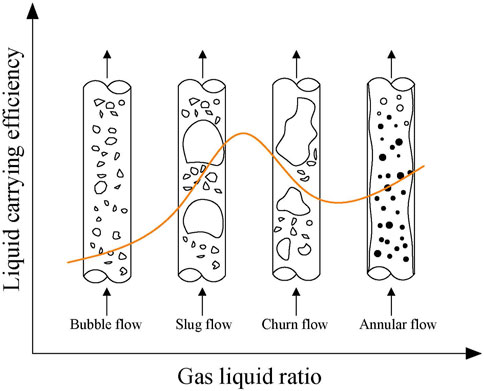
FIGURE 1. Variation of lifting efficiency with flow pattern.
Choosing the appropriate pressure drop calculation model must take into account various factors, such as wellbore size, well depth, well-bottom pressure, properties of the fluid, etc. It is necessary to combine field data to select and adjust the model to ensure that the selected model can provide accurate predictions for specific well conditions. The applicable conditions for common pressure drop calculation models are shown in the Table 1.
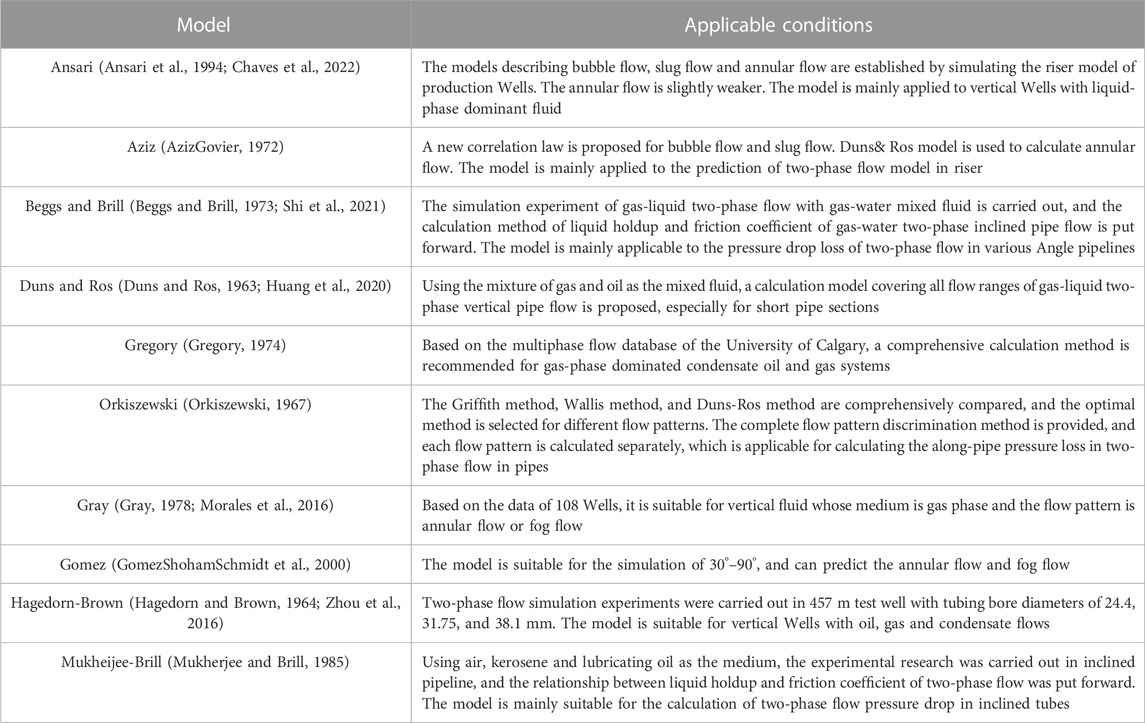
TABLE 1. The applicable conditions of common pressure drop calculation models.
In order to accurately calculate the wellbore pressure, five commonly used wellbore pressure models are compared (Table 2). It is found that the Gray model has the highest accuracy. Therefore, the VLP curve of the gas well is calculated through the Gray model.
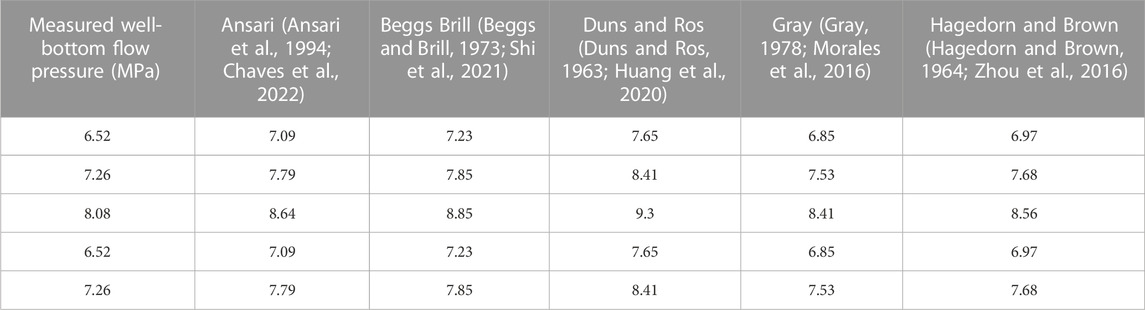
TABLE 2. Comparison between model calculation results and test pressure.
The Gray model uses a two-phase flow pressure drop calculation formula as follows (Gray, 1978; Morales et al., 2016):
where, g is the acceleration of gravity; gc is a dimensionless constant;
Solving the above equation requires the data of mixture liquid density, liquid holdup, friction loss factor, etc., which are difficult to obtain in actual production, So the Gray model is solved by some empirical equations based on temperature, pressure and liquid specific gravity as follows:
The calculated surface tension of the mixture liquid is:
where, Nv is the speed numeral; Nd is the pipe diameter numeral;
The VLP (Vertical Lift Performance) Curve describes the well-bottom flow pressure required for different production under the condition of fixed tubing pressure. Under the condition of normal tubing pressure, calculate the VLP curve under the conditions of Annular flow and Slug flow. Under the condition of transmission pressure, calculate the VLP curve when the wellhead pressurization process is adopted (Figure 2).
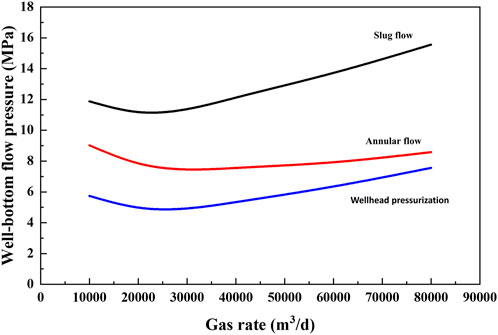
FIGURE 2. VLP Curve under the condition of limiting GLR (Gas-Liquid Ratio).
3 Application limit of deliquification process
3.1 Calculation method for application limit of optimizing pipe string
3.1.1 Model for critical gas rate
As shale gas is mostly developed by horizontal wells, In order to fully consider the effect of well deviation angle and give consideration to accuracy and practicability, W.Z.B. Empirical model (Zhibin Wang model) (Wang et al., 2017) is selected as the on-site gas well liquid carrying analysis model to analyze liquid carrying state and production performance of the gas well. The W.Z.B. model, based on the study of liquid film thickness and the friction factor of the gas-liquid interface, established a new analytical model to reveal the carrying mechanism of the liquid from the perspective of the force balance of the inclined pipe bottom liquid film. It proposed an empirical model similar in form to the Belfroid model (Belfroid et al., 2008). The coefficient
W.Z.B. model:
Where,
3.1.2 Application limit of optimizing pipe string
The optimizing pipe string process is a deliquification process that readjusts the size of the tubing to reduce the slippage loss of gas flow and make full use of the energy of the gas well in the middle and late stages of water gas well production (Belfroid et al., 2008; Wang et al., 2017; Ali et al., 2019; Kuku et al., 2020). The optimizing pipe string process is suitable for little water production gas wells with certain self flowing capacity, which are generally characterized by large tubing-casing pressure difference and rapid decline of production. Conventional foam drainage and gas lift are effective, but the gas lift is short in validity or can not meet the requirements for water drainage (Waltrich et al., 2015; Hamad et al., 2017).
For gas wells with good drainage capacity, high flow rate and large water rate, large diameter tubing can be used to reduce resistance loss and increase gas rate; For gas wells in the middle and later stages of production, since the gas rate and well-bottom flow pressure have decreased, and the drainage capacity is poor, small diameter tubing must be replaced accordingly. In order to enhance the liquid carrying capacity of gas flow, reduce or removes the liquid accumulation at the well-bottom, and extend the self flowing production period of gas wells.
The casing size used in shale gas wells in Ning 209 block is
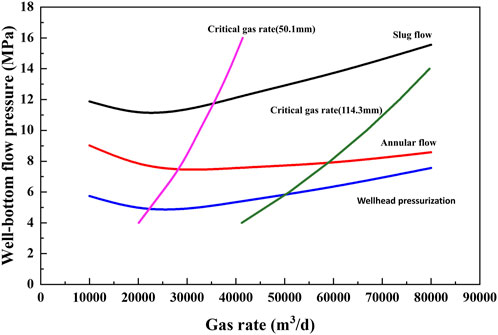
FIGURE 3. Application limits of optimized pipe string.
The critical gas rate curve corresponding to production tubing of all sizes is the application limit of optimizing pipe string under current production conditions. Bring the current production point of the gas well into Figure 3. If the production point falls on the right side of the critical gas rate curve, the gas well can still be produced by optimizing pipe; If the production point falls to the left of the critical gas rate curve, it means that the energy of the gas well has not met the liquid carrying demand, and it is necessary to replace other processes or use other processes to assist production.
3.2 Application limit of plunger lift
When the optimizing pipe string can no longer meet the production demand, the plunger lift can be used to replace the production. As a solid sealing interface, the plunger separates the gas from the lifted liquid, reducing gas channeling and liquid falling back, and improving the lifting efficiency of liquid.
Similar to the optimizing pipe string technology, the energy of plunger lift mainly comes from the reservoir. This process eliminates the liquid accumulation at the well-bottom by improving the liquid lifting efficiency, increases the production differential pressure, and prolongs the flowing period of gas well production with liquid.
Plunger lift is suitable for gas wells with low bottom hole pressure, high GLR, liquid production less than 30 m3/d, and a well depth not exceeding 4,000 m. When the tubing is connected, the GLR should be greater than 200 m3/m3 per 1,000 m, and when the tubing is not connected, the GLR should be greater than 1,100 m3/m3 per 1,000 m (Darden, 1994). The plunger lift process is greatly affected by well deviation, and when the deviation is large, the plunger lift is prone to sticking during the up and down process, resulting in the inability to lift to the wellhead or fall to the bottom of the well. In 2011, the plunger reached a deviation angle of 74° in Marcellus shale gas field, proving that plunger lift can be applied in horizontal wells, but there are still various problems such as large leakage and difficult tool seating (Kravits et al., 2011). Currently, plunger gas lift is mainly used for gas wells with a deviation angle of less than 40° (Lea et al., 2007).
As shown in the Figure 4, the critical gas rate is the limit of production with the optimizing pipe string, while the plunger lift is applicable to drainage gas production at the left side of the curve. Within the range on the left side of the curve, drainage gas production can be carried out through the plunger lift process.
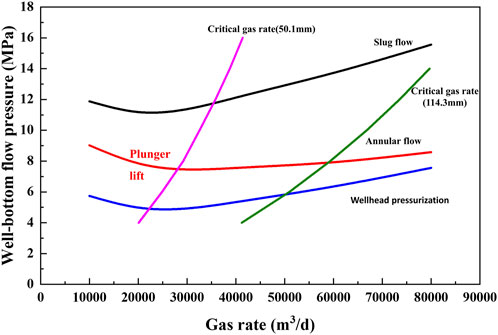
FIGURE 4. Application limit of plunger lift.
The basic requirement for using plunger lift for deliqufication is that the actual production point of the gas well is higher than the VLP curve of the wellhead pressurization process. In order to make more effective use of gas well energy, the gas well should also be located between the two curves of annular flow and slug flow for production.
3.3 Application limit of gas lift recovery
The gas lift is applicable to deep wells, deviated wells, wells with more water and sand, and wells with corrosive components. It also has its advantages in inducing blowout of gas wells with large liquid production, re production of water flooded wells, and forced drainage of gas reservoirs, with the maximum liquid discharge reaching 400 m3/d. When the gas well produces more liquid and the energy of the gas well is not enough to discharge the liquid accumulated, the production of the gas well will gradually decline, even water flooding will occur. For water flooded gas wells with serious well-bottom liquid accumulation, inefficient bubble drainage or ineffective shut down, gas lift technology can be used to resume production.
As shown in the Figure 5, the limit of gas lift recovery is the VLP curve of slug flow. At this time, when the production of the gas well continues to decline, the liquid carrying efficiency of the gas will be significantly reduced, resulting in liquid accumulation at the well-bottom, further reducing the gas production and increasing the flow pressure at the well-bottom. When the actual production point of the gas well falls into the gas lift recovery area, high-pressure natural gas is injected into the gas well through the gas lift process to improve the GLR and gas rate in the tubing, increase the liquid carrying capacity of the gas, discharge the liquid accumulated, and restore the production capacity of the gas well.
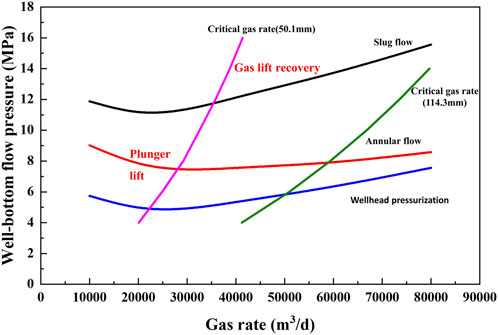
FIGURE 5. Application limit of gas lift recovery.
3.4 Application limit of foam drainage
Foam drainage is mainly used for deliquification in low production gas wells with small liquid production. It has the advantages of simple operation and convenient management. Without moving the downhole string, surfactant can be injected to reduce the critical gas rate, which can be reduced by 30%–50%. For low production gas wells with small liquid production, due to the further reduction of production in the late production period, the velocity strings often cannot meet the liquid carrying demand, and it is not economical to use the gas lift process. Therefore, the way of form drainage is often used to reduce the critical gas rate. For the foam drainage process, the transition limit from annular flow to slug flow in the wellbore can be considered as the critical gas rate (LIU et al., 2020).
As shown in the Figure 6, the critical gas rate of the corresponding tubing is the limit by foam drainage. By adding surfactant, a large amount of stable low-density water containing foam is generated from the accumulated liquid. The foam is used to carry the accumulated liquid to the ground with the air flow, significantly reducing the critical gas rate, so as to achieve the purpose of drainage gas production and recovery of normal production of gas wells.
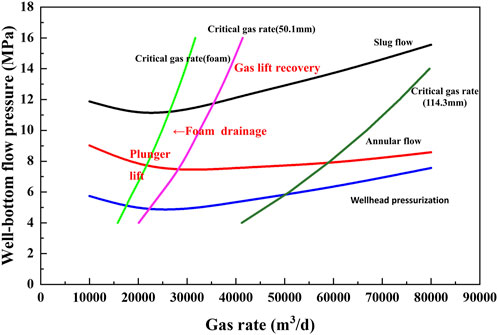
FIGURE 6. Application limit of foam drainage.
The commonly used types of foaming agents for gas wells are ion-type, non-ion-type, amphoteric ion-type, and their complexes. The produced water from the Changning shale gas well is the residual liquid of fracturing fluid, and the water type is calcium chloride type with a mineralization degree of 19–50 g/L (Table 3). Based on the evaluation of foaming power, foam stability, liquid carrying capacity, etc., the preferred foaming agent is the non-ion-type CT5-7C1 foaming agent, and the corresponding defoamer is CT5-10. The recommended foaming agent injection concentration is 1.0 g/L, and the defoamer is maintained at a ratio of 1:2.

TABLE 3. Analysis results of formation water in typical wells.
The use of foam drainage requires that the gas well has a certain flowing capacity (gas rate ≥1,000 m3/d), and liquid rate is less than 100 m3/d. With the development of production, if the well-bottom flow pressure further reduces to below the VLP curve of the wellhead pressurization process, it is no longer able to meet the liquid discharge demand, so it is necessary to consider using other processes to replace production.
3.5 Application limit of intermittent production
When the gas production of the gas well is lower than the critical gas rate, or the well-bottom flow pressure cannot meet the demand of the transmission pressure, the gas well should enter the intermittent production stage. Intermittent well shut-in is required to restore pressure to achieve periodic liquid drainage production. The lower the production decline rate, the higher the GLR, and the faster the reservoir pressure recovery rate, the longer the duration of the intermittent production stage. For gas wells with poor production capacity, serious liquid accumulation, and continuous production of no gas, intermittent production helps to supplement the formation energy near the well and improve the gas rate to a certain extent.
As shown in the Figure 7, the limit of intermittent production is the VLP curve of the wellhead pressurization process. When the well-bottom flow pressure drops below the VLP curve of the wellhead pressurization process, the well should be shut in to restore the pressure until the well-bottom flow pressure is balanced with the static pressure, or the wellhead pressure returns to a certain value, the well should be opened again for production. Generally, when the daily average gas rate of intermittent production is less than 50% of the theoretically predicted gas rate, the intermittent efficiency is low, it is necessary to consider using other processes to maintain production.
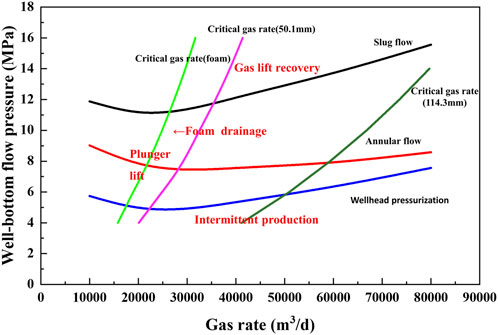
FIGURE 7. Application limit of intermittent production.
4 Field application
According to the current production status of the gas well, read the current gas rate and wellhead pressure, and calculate the corresponding well-bottom flow pressure, which can judge whether the current deliquification process is effective and whether it falls within the corresponding range according to the chart. Moreover, the adjustment plan of the production process can be formulated in advance according to the distance between the actual production point and the application limit.
When the production point of a gas well falls within the region where both foam drainage and plunger lift can be used, the choice of process should be based on the actual situation. For the foam drainage process, the effectiveness of the surfactant is crucial. For high-temperature, high-pressure, and high-mineralization gas wells, only a surfactant that meets all conditions can generate a large amount of low-density water-containing foam, reducing the liquid density and increasing the liquid-carrying capacity of the gas well. The plunger lift process is suitable for gas wells with a high GLR and certain reservoir energy. Conventional plunger devices are mostly difficult to enter the inclined or horizontal sections through the build-up points of highly deviated and horizontal wells, and can only be applied to vertical sections. Although improved tools have been applied in some highly deviated and horizontal wells, there are still some problems in actual production. Therefore, the plunger lift is still mainly used for gas wells with not too high deviation.
4.1 Gas well production processes
The Ning209-X well was opened for production in February 2020 and has been producing for 3 years with the production curve shown in Figure 8. The initial production from the well was high and the gas well was producing directly using casing. After a period of time, the production and pressure dropped rapidly and could not meet the requirements of the gas well to carry liquids, so a velocity tubing was put in place to stabilize production. Based on the experience of the field experts, as production continued, when the well gas rate was further reduced to 1.2 times the critical gas rate, production was switched to the plunger lift process.
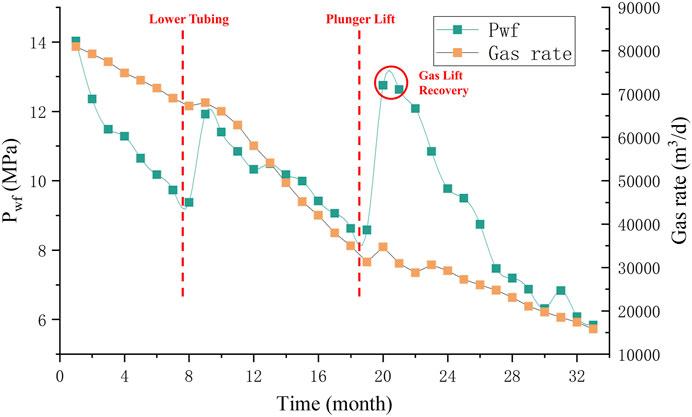
FIGURE 8. Production curve of well Ning209-X.
4.2 Application of the optimization chart
As shown in the Figure 9, The production data points of gas well Ning 209-X were placed into the optimization chart of deliquification process, and it was found that the well went through roughly three stages of production: “①→②→③,” with three gas lift recovery due to liquid accumulation.
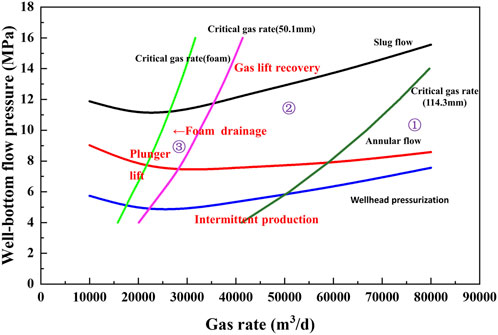
FIGURE 9. Production process of well Ning209-X.
At the initial stage of development, the production gas rate is high. The gas well is directly produced by casing, which can effectively carry liquid production. Under the pressure release production system, the wellhead pressure drops rapidly to the transmission pressure; Then, the gas well enters the “②” stage. If the casing production is continued, liquid accumulation or even water flooding may occur. After the tube is lowered into the gas well, due to the significant reduction of the critical gas rate, the gas well is still able to carry liquid with its own energy for production, and the gas well flowing production period can still last for a period of time.
When the production of the gas well enters the “③” stage, as the production is less than the critical gas rate, the liquid carrying capacity of the gas becomes poor, and liquid will accumulate at the bottom of the well, so the production can be replaced by the plunger lift.
When the gas well produces more water and the energy of the gas well is not enough to discharge the accumulated liquid in time, the production of the gas well will gradually decline, and the gas well often enters the “④” stage, which requires gas lift recovery. The high-pressure natural gas is injected into the gas well through the compressor to improve the GLR and gas flow speed in the gas well, increase the liquid carrying capacity of the gas, discharge the accumulated liquid and restore the production capacity.
When the energy of the gas well decreases rapidly and the well-bottom flow pressure cannot meet the transmission demand, the gas well will enter the “⑤” stage, requiring a long shut-in period to achieve periodic liquid drainage production. When the well-bottom flow pressure is balanced with the static pressure, or when the wellhead pressure returns to a certain value, the well will be opened again for production.
5 Conclusion
(1) It is very difficult to backflow a large amount of fracturing liquid after volumetric fracturing of shale gas reservoirs. In order to effectively drain liquid accumulated in shale gas wells, Changning shale gas field has initially formed a shale gas well deliqufication process system represented by plunger lift, optimizing pipe string, gas lift, foam drainage and intermittent production.
(2) Based on the deliqufication process system of Changning shale gas field, this paper establishes an optimization chart of deliqufication process for shale gas wells, and provides the application limits of plunger lift, optimizing pipe string, gas lift, foam drainage and intermittent production.
(3) This method was applied in Well Ning 209-X, where an optimization chart of deliqufication process was developed based on the production characteristics of the gas well. The optimization chart realizes quantitatively preferred deliqufication process, effectively guides the production of gas wells, timely adjusts the appropriate drainage gas extraction process, and improves the recovery rate of the gas field.
Data availability statement
The original contributions presented in the study are included in the article/Supplementary Material, further inquiries can be directed to the corresponding author.
Author contributions
JY: Writing–original draft. JX: Methodology, Writing–original draft. BL: Writing–original draft. TZ: Writing–review and editing. QW: Writing–review and editing, Software. LZ: Validation, Writing–review and editing.
Funding
The author(s) declare financial support was received for the research, authorship, and/or publication of this article. This work is financial support from the National Natural Science Foundation of China (No. 52204059).
Conflict of interest
Authors JY, JX, BL, TZ, QW, and LZ were employed by PetroChina Southwest Oil and Gas Field Company.
Publisher’s note
All claims expressed in this article are solely those of the authors and do not necessarily represent those of their affiliated organizations, or those of the publisher, the editors and the reviewers. Any product that may be evaluated in this article, or claim that may be made by its manufacturer, is not guaranteed or endorsed by the publisher.
Supplementary material
The Supplementary Material for this article can be found online at: https://www.frontiersin.org/articles/10.3389/fenrg.2023.1336359/full#supplementary-material
References
Ali, S., Kumar, S., and Kalwar, S. A. (2019). A case study in production enhancement through installation of optimum artificial lift technology. Brasil: Offshore Technology Conference.
Alotaibi, M. A., and Al-Qahtani, A. A. (2013). “Rising challenges call for new strategies to prepare future leaders & innovators,” in SPE annual technical conference and exhibition (New Orleans: Louisiana).
Ansari, A. M., Sylvester, N. D., Sarica, C., Shoham, O., and Brill, J. P. (1994). A comprehensive mechanistic model for upward two-phase flow in wellbores. SPE Prod. Facil. 9 (2), 143–151. doi:10.2118/20630-pa
AzizGovier, K. G. W. (1972). Pressure drop in wells producing oil and gas. J. Can. Petroleum Technol. 11 (3). doi:10.2118/72-03-04
Beggs, H. D., and Brill, J. P. (1973). A study of tow-phase flow in inclined pipes. JPT 25 (5), 607–617. doi:10.2118/4007-pa
Belfroid, S., Schiferli, W., Alberts, G., Veeken, C., and Biezen, E. (2008). Predicting onset and dynamic behaviour of liquid loading gas wells. Denver, Colorado, USA: SPE Annual Technical Conference and Exhibition.
Booth, P., Brown, H., Nemcik, J., and Ting, R. (2017). Spatial context in the calculation of gas emissions for underground coal mines. Int. J. Min. Sci. Technol. 27 (5), 787–794. doi:10.1016/j.ijmst.2017.07.007
Cai, Y. D., Liu, D. M., Pan, Z. J., Yao, Y. B., Li, J., and Qiu, Y. (2013). Pore structure and its impact on CH4 adsorption capacity and flow capability of bituminous and subbituminous coals from Northeast China. Fuel 103, 258–268. doi:10.1016/j.fuel.2012.06.055
Chaves, G. S., Karami, H., Filho, V., and Vieira, B. F. (2022). A comparative study on the performance of multiphase flow models against offshore field production data. J. Petroleum Sci. Eng. 208, 109762. doi:10.1016/j.petrol.2021.109762
Chin, Y. D., and Roark, T. (2017). US shale revolution impacts on deepwater and global energy landscape[C]//Offshore technology conference. OnePetro.
Darden, D. P. (1994). Plunger lift application in wells with set packers or permanent tubing. J. Petroleum Technol. 46 (1), 6. doi:10.2118/27845-pa
Duns, H., and Ros, N. C. J. (1963). Proc. Frankfurt, Germany: Sixth World Petroleum Congress. Vertical flow of gas and liquid mixtures in wells.
Elwan, M., Davani, E., and Ghedan, S. G. (2021). Automated well production and gas lift system diagnostics and optimization using augmented AI approach in a complex offshore field[C]//SPE annual technical conference and exhibition.
Ghorayeb, K., Limsukhon, M., Dashti, Q. M., and Aziz, R. M. (2008). Multiple reservoir simulations integration: an alternative to full field simulation in the North Kuwait jurassic complex. J. Phys. Chem. c. doi:10.2118/115881-ms
GomezShohamSchmidt, L. E. O. Z., Chokshi, R. N., and Northug, T. (2000). Unified mechanistic model for steady-state two-phase flow: horizontal to vertical upward flow. SPE J. 5 (3), 339–350. doi:10.2118/65705-PA
Gray, H. E. (1978). Vertical flow correlation in gas wells”, user’s manual for API 14B surface controlled subsurface safety valve sizing computer program. 2nd Edition. Dallas, TX, USA: American Petroleum Institute.
Gregory, G. A. (1974). Comments on the prediction of liquid holdup for gas-liquid flow in inclined pipes, 463.
Guo, B., Ghalambor, A., and Xu, C. (2006). A systematic approach to predicting liquid loading in gas wells. SPE Prod. Operations 21 (1), 81–88. doi:10.2118/94081-pa
Hagedorn, A. R., and Brown, K. E. (1964). The effect of liquid viscosity in two-phase vertical flow. J. Petroleum Technol. 16, 203–210. doi:10.2118/733-pa
Hamad, F. A., Faraji, F., Santim, C. G. S., Basha, N., and Ali, Z. (2017). Investigation of pressure drop in horizontal pipes with different diameters. Int. J. Multiph. Flow 91, 120–129. doi:10.1016/j.ijmultiphaseflow.2017.01.007
Huang, Q., Lin, X., He, Y., Wang, C., Li, J., Ding, H., et al. (2020). Mathematical Simulation and program of gas-liquid two-phase well flow pattern. EDP Sci. 185, 01087. doi:10.1051/e3sconf/202018501087
Kravits, M. S., Frear, R. M., and Bordwell, D. (2011). Analysis of plunger lift applications in the Marcellus shale[C]//paper presented at the SPE annual technical conference and exhibition. Denver, Colorado, USA. SPE-147225-MS.
Kuku, A., Adowei, E., Jumbo, S., Dada, Y., and Okeke, G. (2020). SPE Nigeria annual international conference and exhibition. Denver, Colorado, USA. Maple field rejuvenation: a practical and effective approach for field production increase through gas lift.
Lea, J. F., Rowlan, O. L., and McCoy, J. N. (2007). “Measurement and calculation of key events during the plunger lift cycle[C],” in SPE Annual Technical Conference and Exhibition. Anaheim, CA: OnePetro.
Liu, Y., Wu, P., Luo, C., Liu, T., Ni, J., and Wang, H. (2020). Experimental study on the applicable range of surfactant injection technology. J. Shenzhen Univ. Sci. Eng. 37 (5), 490–496. doi:10.3724/sp.j.1249.2020.05490
Meisenhelder, J. (2013). Shale 2.0: from efficient to effective shale development. J. Petroleum Technol. 65 (07), 18–21. doi:10.2118/0713-0018-jpt
Mohanty, M. M., and Pal, B. K. (2017). Sorption behavior of coal for implication in coal bed methane an overview. Int. J. Min. Sci. Technol. 27 (2), 307–314. doi:10.1016/j.ijmst.2017.01.014
Morales, G., Urdaneta, G., and Poletzky, I. C. (2016). SPE annual technical conference and exhibition. Dubai: United Arab Emirates.Bottomhole pressure prediction using multiphase hydraulics in underbalanced and managed pressure drilling operations
Mukherjee, H., and Brill, J. P. (1985). Pressure drop correlations for inclined two-phase flow. J. Energy Resour. Technol. 107 (4), 549–554. doi:10.1115/1.3231233
Ojha, K., Mandal, A., Karmakar, B., Pathak, A. K., and Singh, A. K. (2013). Studies on the estimation and prospective recovery of coal bed methane from raniganj coalfield, India. Energy Sources, Part A Recovery, Util. Environ. Eff. 35 (5), 426–437. doi:10.1080/15567036.2010.512911
Olubodun, J. (2022). “Assessment of the prospect and challenges of the african oil and gas industry in harnessing energy for a more sustainable world,” in SPE Nigeria Annual International Conference and Exhibition. Lagos, Nigeria: SPE, D022S001R001. [C]//Day 2 Tue, August 02, 2022. Lagos, Nigeria.
Orkiszewski, J. (1967). Predicting two-phase pressure drops in vertical pipe. J. Petroleum Technol. 19 (6), 829–838. doi:10.2118/1546-PA
Rubio, E., Reddicharla, N., Ali, M. A. S., and Attar, M. A. (2023). “Data-Driven Well Candidate Recognition Solution. Case Study in a Digital Oil Field in Abu Dhabi[C],” in Paper presented at the Middle East Oil, Gas and Geosciences Show. Manama, Bahrain.
Shen, J., Zhang, C., Qin, Y., and Zhang, B. (2017). Effect factors on co-mining of sandstone gas and coalbed methane in coal series and threshold of parameter in Linxing block, Ordos basin. Nat. Gas. Geosci. 28 (3), 479–487. doi:10.11764/j.issn.1672-1926.2017.02.018
Shi, S. Z., Han, G. Q., Wu, B. H., Xu, K., Li, Z., and Sun, K. (2021). An experimental study of liquid unloading in the curve section of horizontal gas wells. Oil Gas Sci. Technology–Revue D Ifp Energies nouvelles 76, 69. doi:10.2516/ogst/2021051
Song, Y. Q., Zhou, X. L., and Wang, J. A. (2022). Adsorption performance of activated carbon for methane with low concentration at atmospheric pressure. Energy Sources, Part A Recovery, Util. Environ. Eff. 43 (7/12), 1337–1347. doi:10.1080/15567036.2019.1636903
Waltrich, P. J., Posada, C., Martinez, J., Falcone, G., and BarbosaJr, J. R. (2015). Experimental investigation on the prediction of liquid loading initiation in gas wells using a long vertical tube. J. Nat. Gas Sci. Eng. 26, 1515–1529. doi:10.1016/j.jngse.2015.06.023
Wang, H., Zhou, C., Zhou, Z. Y., He, Z. Q., and Chen, M. Z. (2022). Comprehensive optimal selection method of drainage gas recovery technology for shale gas horizontal wells. Drill. Prod. Technol. 45 (2), 154–159. doi:10.3969/J.ISSN.1006-768X.2022.02.28
Wang, Z. B., Guo, L. J., Zhu, S. Y., and Nydal, O. J. (2017). Prediction of the critical gas velocity of liquid unloading in the horizontal gas well. SPE J. 24 (2), 328–345. doi:10.2118/189439-PA
Xiang, J. H., Wen, M., Wang, Q., Chen, M., Li, X. R., Wei, L. S., et al. (2022). Study and application of shale gas well deliquification technology. Petroleum Sci. Technol. Forum 41 (3), 67–76. doi:10.3969/j.issn.1002-302x.2022.03.009
Zhang, X. H., Song, Y. Q., Zhou, X. L., Li, C. L., and Xu, L. Y. (2016). Performance of different zeolites as adsorbents for methane. Energy Sources, Part A Recovery, Util. Environ. Eff. 38 (2), 202–208. doi:10.1080/15567036.2011.608104
Zhou, C., Wu, X., Li, H. C., Lin, H., Liu, X. W., and Cao, M. J. (2016). Optimization of methods for liquid loading prediction in deep condensate gas wells. J. Petroleum Sci. Eng. 146, 71–80. doi:10.1016/j.petrol.2016.04.016
Zou, C. N., Pan, S. Q., Jing, Z. H., Gao, J. L., Yang, Z., Wu, S. T., et al. (2020). Shale oil and gas revolution and its impact. Acta Pet. Sin. 41 (1), 1–12. doi:10.7623/syxb202001001
Keywords: shale gas, deliquification, process optimization, wellbore, optimized method
Citation: Yang J, Xiang J, Li B, Zhang T, Wang Q and Zeng L (2023) A new optimized method in wellbore to improve gas recovery in shale reservoirs. Front. Energy Res. 11:1336359. doi: 10.3389/fenrg.2023.1336359
Received: 10 November 2023; Accepted: 28 November 2023;
Published: 29 December 2023.
Edited by:
Feng Dong, China University of Geosciences, ChinaReviewed by:
Daobing Wang, Beijing Institute of Petrochemical Technology, ChinaMianmo Meng, China University of Geosciences Wuhan, China
Copyright © 2023 Yang, Xiang, Li, Zhang, Wang and Zeng. This is an open-access article distributed under the terms of the Creative Commons Attribution License (CC BY). The use, distribution or reproduction in other forums is permitted, provided the original author(s) and the copyright owner(s) are credited and that the original publication in this journal is cited, in accordance with accepted academic practice. No use, distribution or reproduction is permitted which does not comply with these terms.
*Correspondence: Bochun Li, bGliYzIwMjBAcGV0cm9jaGluYS5jb20uY24=