 Bo Zeng
 Shengjie Wei
 Yuliang Su
 Junchuan Gui
 Jiangrong Feng
 Yintong Guo
 Peihong Lyu
95% of researchers rate our articles as excellent or good
Learn more about the work of our research integrity team to safeguard the quality of each article we publish.
Find out more
ORIGINAL RESEARCH article
Front. Energy Res. , 05 January 2024
Sec. Advanced Clean Fuel Technologies
Volume 11 - 2023 | https://doi.org/10.3389/fenrg.2023.1336148
This article is part of the Research Topic Production Technology for Deep Reservoirs View all 37 articles
Hydraulic fracturs size inversion plays an important role on evaluating hydraulic fracturing efficiency. Fracture size can be calculated by microseism events or all the pressure data generated by hydraulic fracturing stimulations. These methods are time-consuming. However, the sudden shutoff of pumping can induce a special data known as the water hammer signal. The size of this data is much fewer than others so using it to calculate fracture size is efficient. This study proposes a method of using water hammer signal to work out the hydraulic fracture size. The numerical simulation model is proposed based on the transient flow model to describe the water hammer behavior. The impacts of fracture on water hammer behavior are represented by three parameters (R,C and I). Through these parameters, the fracture size can be calculated. The accuracy of this method is validated by comparing fracture size inversion results between different methods. The results show that the parameter C and R have obvious impacts on water hammer signal and they can cause the amplitude of water hammer signal alternate from 5 to 2 MPa. In addition, this method is accurate for fracture size calculation and the overall error between its results and ones from normal methods is about 6.28%. This method is more suitable for fractures away from horizontal well toe than ones near to well toe. The mean error of fractures away from well toe is only 3.49% but it is 12.75% for fracture near well toe. It is because that the fracture structure is complex near well toe. It indicates that the more accurate relationship between fracture size and parameters (R,C and I) is required for fracture with complex structure.
Shale gas plays an extremely important role as an energy resource and a source of some chemical products (Armor John, 2013). However, shale gas reservoirs are usually characterized by low porosity and ultra-low permeability. For example, Sichuan shale gas reservoir is a deep shale gas reservoir whose depth is about 5,000 m, and the reservoir is mainly free-phase gas (Qian et al., 2023). In order to improve gas production, hydraulic fracturing is a necessary stimulation method, and the hydraulic fracture size affects the production of shale gas. The appropriate hydraulic fracture size can form an effective fracture network, which decreases economic costs and enhances production recovery (Guo et al., 2022; Peng-Fei et al., 2023).
Since the hydraulic fracture size cannot be directly observed, many methods for calculating hydraulic fracture size have been proposed to evaluate the quality of hydraulic fracture. The common calculation methods are: G-function analysis, AVO (Amplitude Variation with Offset) inversion, thermal neutron detection technology and field direct logging or microseismic detection. Since the G-function method was proposed in 1987, the research on fracture size calculation methods by G-function had been widely studied (Castillo, 1987; Yuan et al., 2016; Recep et al., 2021; Tu et al., 2022; Jatykov and Bimuratkyzy, 2022). However, the traditional G-function model is difficult to estimate the shape of the multi-fracture network in each fracturing stage. In the latest study (Hou et al., 2022), a multi-fracture geometry calculation model based on the G-function graph of the pressure drop data after fracturing was proposed. It can obtain the fracture length and width by considering the proportional function of fracture length. However, its accuracy of the heterogeneous reservoir is usually low. The AVO inversion algorithm identifies fluids in different statements through the dispersion characteristics of fluids, thus determines the effectiveness of fractures (Minsley Burke et al., 2004; Gregg et al., 2009; Gabriel et al., 2009; Muhammad and Sun, 2020; Xiao et al., 2022). Traditional frequency-dependent AVO inversion algorithms cannot consider the azimuth of seismic data acquisition, and ignores the effect of seismic anisotropy dispersion in real media. Through considering the anisotropy of seismic data, a frequency-dependent AVOAz (Amplitude Versus offset/Angle and Azimuth) inversion method is proposed (Ajaz et al., 2021; Li et al., 2013). However, the shortcomings of seismic noise affecting inversion results and low resolution of inversion results are still required improvements. Thermal neutron detection technology is based on the high thermal neutron absorption capacity of gadolinium oxide labeled proppant, and the fracture parameters are determined by thermal neutron detection. Monte Carlo simulation method is used to analyze the spatial distributions of thermal neutrons before and after fracturing stimulations, and the relationship between thermal neutron number, gadolina content and proppant placement is built (Qian et al., 2020). On this basis, a mathematical relationship between the change of thermal neutron number and fracture parameters is established. Fracture height and width are quantitatively evaluated. However, thermal neutron detection technology has high economic cost and cannot maximize economic benefits. Seismic data such as seismic amplitude, azimuth and other parameters are usually used to invert fracture information in field tests (Davis et al., 2008; Cao and Sharma, 2022). The current methods are mainly used to obtain the elastic constant, anisotropy coefficient or fracture weakness, but they cannot directly obtain the fracture information. In order to improve their accuracy, scholars have proposed weighted calculation or improved inversion schemes based on seismic data (Guo et al., 2022; Huang et al., 2023). These improvements can accurately describe fracture information and the prediction of fracture trend. Their results are in good agreement with the results of tectonic stress field analysis.
The Hydraulic Fracturing Test Site (HFTS) program conducted in 2015 was a site-based hydraulic fracturing experiment in the West Texas Permian (Midland) basin and had successfully tested a new patented method of pumping hydraulic fracturing (Jordan and Iraj, 2017). This method rapidly changes the speed of fluid pump from a predetermined constant rate to a significantly low rate, and then rapidly increases to the maximum rate. Rapid changes in fluid velocity or rate pulses can temporarily produce pressure pulses of hundreds to thousands psi. They generate a water hammer phenomenon. The water hammer signal fracture inversion method uses the dynamic changing pressure signal as the input boundary condition. Substituting this condition into the fluid transient flow model can solve the water hammer response in the fracture through the MOC (Method of Characteristics) algorithm and finite difference method (Zaruba, 1993; Chen, 2005; Chen et al., 2006; Hou et al., 2021). Parameters that can represent the impact of fractures on pressure signal are added into the transient flow model. When the fitting pressure value satisfies with the real data of actual stimulation pressure curve, those parameters presenting fracture impacts can be set as the real fracture size (Qiu et al., 2022; Carey et al., 2015; Hwang et al., 2017; Iriarte et al., 2017).
In this paper, in order to test the applicability of water hammer signal fracture inversion method for horizontal wells, the finite element method is used to simulate the fracturing stimulation process in shale reservoirs to obtain hydraulic fracture size. Based on the transient flow model, the characteristics of water hammer signal are analyzed, and the fracture size is retrieved by the fracturing water hammer signal, and the feasibility of water hammer signal inversion is verified and its influencing factors are discussed.
The hydraulic fracture size characteristics are obtained by the finite element method in this section. Those solutions can be used to verify the accuracy of the water hammer signal fracture inversion method.
The actual stimulation data used in this study is obtained from a shale gas reservoir in the south Sichuan Basin. The target reservoir is located at the Silurian reservoir with a buried depth about 4,000 m. It mainly contains gray and dark gray shale rocks in the upper layer, gray black-black interlayer shale rocks in the bottom layer, and its caprock is gray argillaceous limestone. The shale gas reservoir has good preservation conditions, and the measured pressure coefficient of single well is 1.8–2.4. The reservoir is developed by a well group, and the target well group (P4) contained 6 wells. According to the rock mechanical experiment and logging data, its reservoir mechanical properties are shown in Table 1. The range of difference between in-situ stresses in two directions is 2–17 MPa and the difference of Young’s modulus is greater than 10 GPa, indicating that the reservoir is highly heterogeneous.
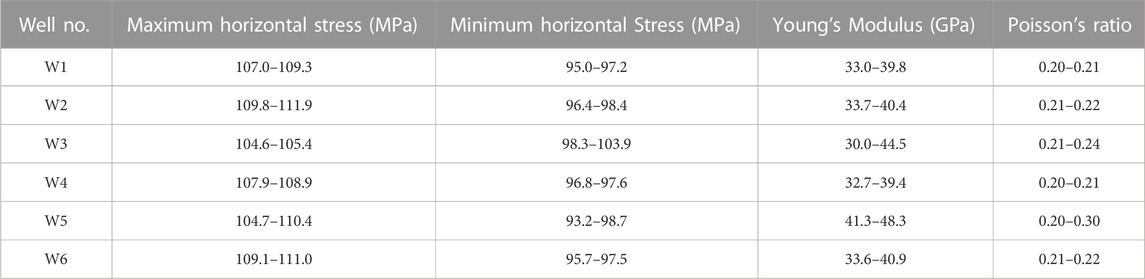
TABLE 1. Mechanical properties of Silurian reservoirs in P4 platform.
According to the reservoir mechanical properties in Table 1, the reservoir mechanical properties around a single well are set, and the mechanical properties of rocks in interwell reservoir areas are established using the interpolation function. The distributions of Young’s modulus and Poisson’s ratio are shown in Figures 1A, B, respectively. The mechanical boundary condition of the reservoir is set as uniaxial strain condition. The stress generated by the gravity of overlying rock is applied to the top boundary, and the remaining boundaries are set as the rolling support condition (no normal displacement). Through numerical simulation, the reservoir in-situ stress values are calculated. The distributions of the minimum horizontal stress and maximum horizontal stress are shown in Figures 2A, B, respectively. Compared with the in-situ stress values of each well in Table 1, it is found that the average error between the numerical simulation solution and the actual values is 5.3%. Therefore, the above geomechanical model is accurate and can improve the accuracy of subsequent hydraulic fracturing simulation.
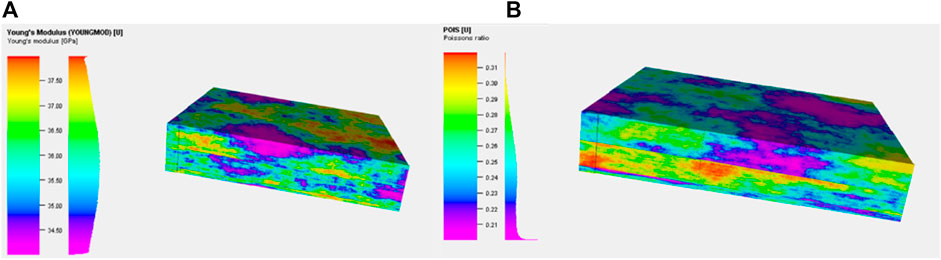
FIGURE 1. 3D distribution of reservoir mechanical properties. (A) illustration of Young’s modulus distribution; (B) illustration of Poisson’s ratio distribution.
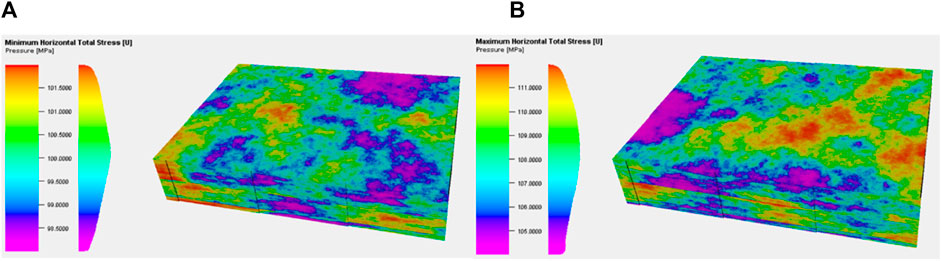
FIGURE 2. 3D distribution of reservoir in-situ stress. (A) illustration of Minimum horizontal stress distribution; (B) illustration of Maximum horizontal stress distribution.
Six Wells on the P4 platform are stimulated by multi-stages hydraulic fracturing method. Well W5 is stimulated by variable-viscosity slip water (viscosity range: 400–600 mPa·s), and the remaining five wells are stimulated by low-viscosity slip water. Each stage has 6 clusters and perforation density is 16 perforations/m, the stage distance is 15–25 m. The main stimulation parameters is shown in Table 2.
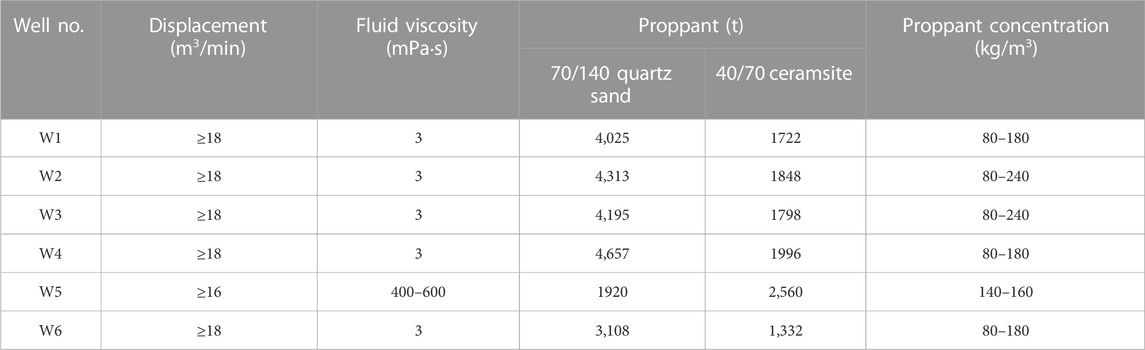
TABLE 2. Stimulation parameters of six wells in P4 platform.
On the basis of the above geomechanical model, the fracturing stimulation scheme is input, and the hydraulic fracture propagation is simulated by Kinetx software. The software assumes the fracture as a vertical plane fracture and proposes an unconventional fracture model (UFM). This model can simulate the interaction between hydraulic fractures and natural fractures, consider the one-dimensional flow of fracturing fluid, the migration of proppant and the elastic deformation of fracture width. Due to the difficulty in obtaining natural fracture data and the increased difficulty in modeling, the geological model used in this study will generate natural fracture conditions based on empirical formulas. It can also fully consider the rock mechanical properties and irregular fracture morphology of the reservoir. This software is widely used in the numerical simulation of hydraulic fracturing stimulation for shale reservoirs.
In order to verify the accuracy of numerical simulation results, the numerical simulation results are compared with three types of field data. Firstly, the simulated fracture distribution results are compared with the microseismic data, as shown in Figure 3. Because the microseismic data itself is susceptible to interference, it cannot accurately reflect the fracture length and other characteristics, so only the microseismic data is used to verify the simulated fracture distribution characteristics. As shown in Figure 3, in the area with dense microseismic data points, the simulated fractures are also relatively dense. Therefore, the fracture distribution obtained by numerical simulation is basically consistent with that of microseismic data. Secondly, the simulated wellbore pressure curve is compared with the actual pressure curve. The comparisons of pressure between field data and numerical solution for the Well 2, Well 3 and Well 5 are shown in Figures 4A–C, respectively. As shown in Figure 4, the simulated pressure curve is in good agreement with the actual curve in terms of value and variation law. Finally, after fracturing simulation, the shale gas production is simulated, and the shale gas daily production simulation data is obtained, and compared with the actual production data. The comparisons of daily production rate between field data and numerical solution for the Well 2, Well 3 and Well 5 are shown in Figures 5A–C, respectively. As shown in Figure 5, the alternation behavior of the numerical simulation results is consistent with that of the actual production data, but the data is hard to be highly consistent with the actual ones. The actual stimulation is complicated, and there are operations such as well repairing. However, the overall agreement between the numerical simulation and the actual data reached 84%. Through the comparison of the above three types of data, it is clear that the fracture size obtained by numerical simulation is basically accurate.
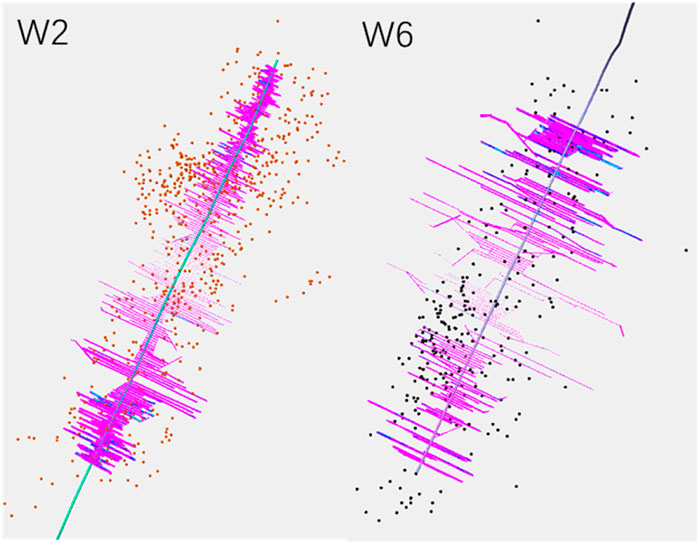
FIGURE 3. Comparison of fracture morphology and micro-seismic data of Well2 and 6.
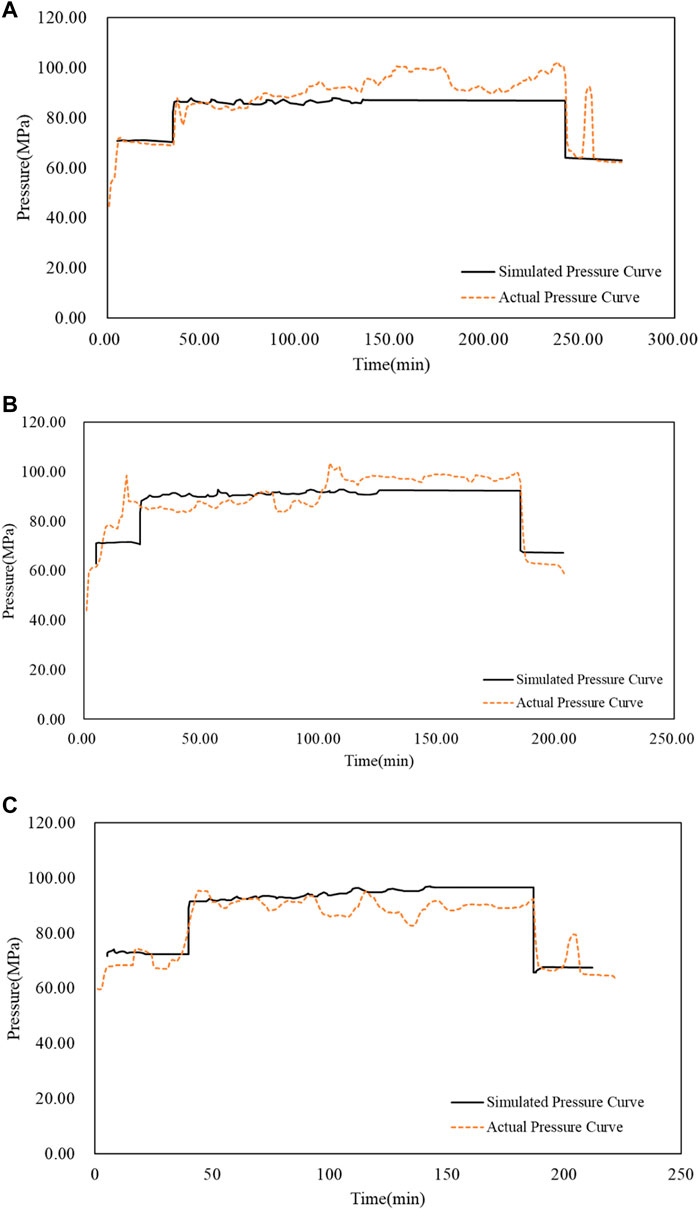
FIGURE 4. The comparison of pressure curve between numerical solution and field data. (A) comparison result of Well 2; (B) comparison result of Well 3; (C) comparison result of Well 5.
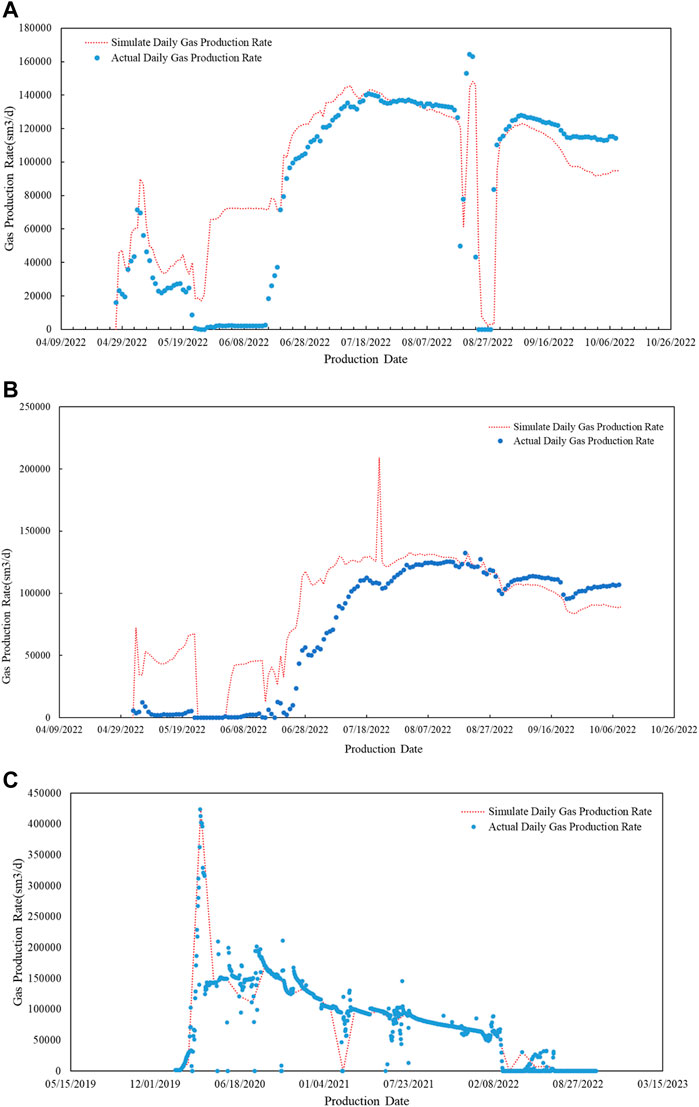
FIGURE 5. Comparison of daily production data between numerical solution and field data. (A) comparison result of Well 2; (B) comparison result of Well 3; (C) comparison result of Well 5.
The fracture length obtained by this numerical simulation is shown in Figure 6. The total length of fractures in each well falls in the range of 100–350 m. The simulation results also show that the overall fracture height is about 40 m and the fracture width falls in the range of 5–15 mm. The fracture size difference of the same well is large, resulting from reservoir heterogeneity as shown in Figure 1 and Figure 2. For example, the minimum horizontal principal stress of each horizontal well is quite different and its difference is about 5 MPa. The similar flow rate and the upper limit pressure of the fracturing equipment, therefore, the fracture length is short at location where the in-situ stress is high, while, the fracture length is moderate at location where the in-situ stress is low. Although the fracture lengths for different multi-stages are quite different, the numerical solutions are basically accurate because that their distributions are consistent with micro-seismic data as shown in Figure 3, the pressure curves of numerical solutions are consistent with field data as shown in Figure 4 and the daily production data of numerical solutions are also consistent with field data as shown in Figure 5. These solutions of fracture lengths can be used to verify the ones obtained by the water hammer signal in the following section.
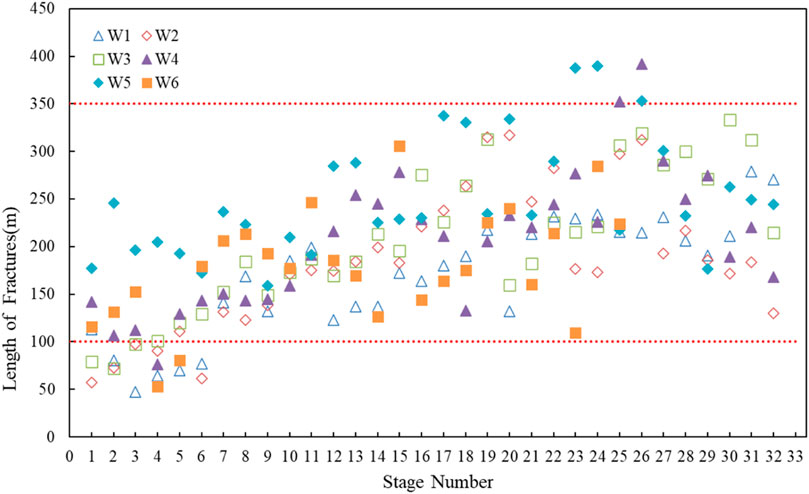
FIGURE 6. The corresponding fracture length of each well fracturing stage in P4 platform.
The pump or valve is closed at the end of hydraulic fracturing stimulation, inducing a pressure wave because of the fluid flow inertia. This phenomenon is known as the water hammer phenomenon. This pressure wave transports in the wellhole and is reflected when it reaches at the end of wellhole. During this process, the hydraulic fracture affects the pressure wave transport behavior, and pressure signal with some oscillations can be received at the wellhead. The characteristics of pressure signal (such as amplitude, frequency) dynamically change with time due to fluid flow friction and flowing into fractures, as shown in Figure 7. By simulating the water hammer pressure signal, the characteristics of the fracture can be inverted.
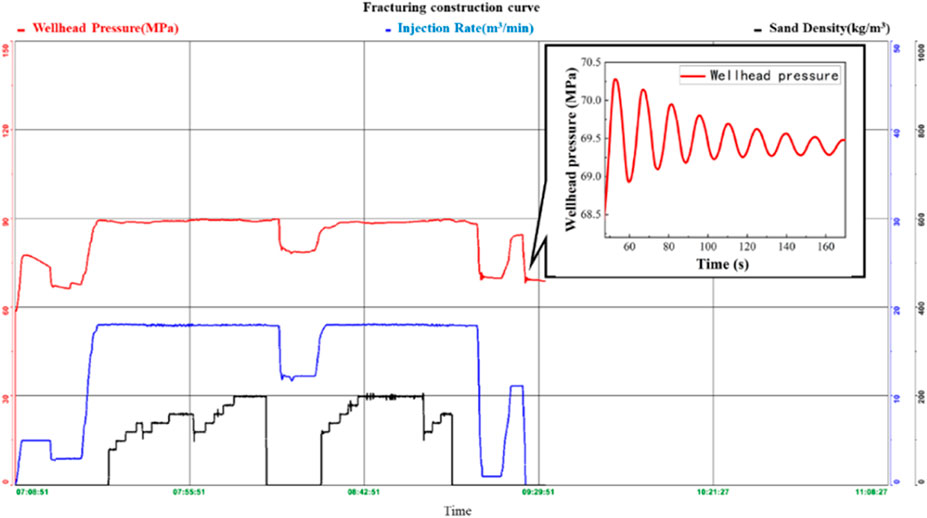
FIGURE 7. Illustration of pressure signal at wellhead caused by the water hammer phenomenon.
Figure 8 shows the geometry model of wellbore-fracture structure. When the fracturing stimulation is stopped instantaneously, the pressure wave propagates through the fracturing fluid, reflects at the end of the wellbore, and is superimposed with other pressure waves. The overall pressure signal is monitored by the wellhead pressure sensor. Due to the existence of fractures, some amount of fluid flows into fractures, affecting the pressure signal at the wellhead The fracture size can be inverted based on the characteristics of pressure wave at the wellhead.
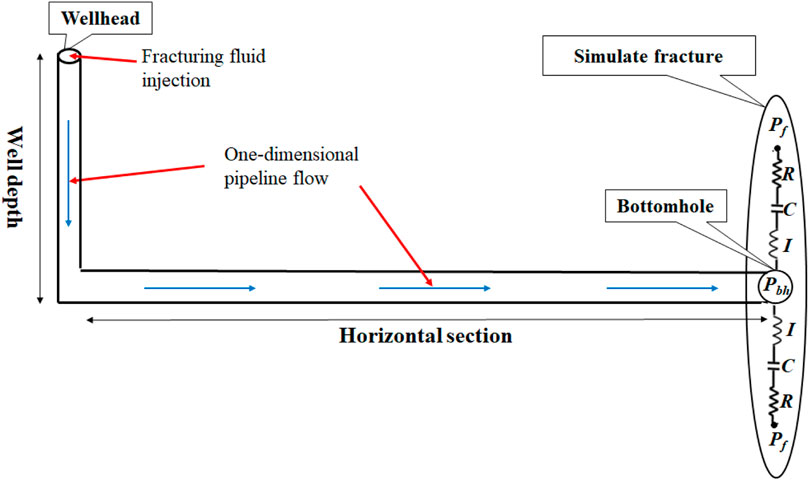
FIGURE 8. Illustration of fluid flow path in the wellbore-fracture structure.
The fluid flow of water hammer phenomenon in the wellbore can be regarded as a one-dimensional pipeline flow when establishing the numerical model. The momentum and mass conservation equation of fluid flow in a one-dimensional pipeline are shown in Eqs 1, 2 without considering the liquid compression (Chaudhury, 1987):
where p is the pressure, V is the fluid flow velocity, f is the Darcy-Weisbach friction coefficient (Churchill, 1997), ρ is the fluid density, D is the equivalent diameter of the hydraulic fracture, a is the velocity of pressure wave. The value of some parameter and conversion relationship between them is shown in Eqs 3–7:
where e is the surface roughness of the main joint; μ is the fluid viscosity, A is the area of a fracture cross section, and S means the perimeter of the fracture cross section, H is the pressure measuring head, Q is the flow, z is reference depth, K is the fluid elastic modulus, which is 0.218 GPa.
By combining the above equations, the flow equations represented by H and Q in one-dimensional horizontal wellbore is obtained, as shown in Eqs 8, 9:
To get the response of the water hammer signal with fractures, it is necessary to introduce parameters related to fractures into the equation. Three physical parameters, R, C, and I, is used to simulate the effect of fractures on the water hammer signal. The pressure inside fractures is different from the pressure inside wellbore (pBH). Their difference (Δpnwf) can be represented by those three parameters, as shown in Eq. 10 (Carey et al., 2015):
According to the wellbore flow Eqs 8–10, the response of the water hammer signal in the case of a single fracture can be simulated by adjusting the three parameters R, C, and I.
To simplify the calculation of fracture size, the following assumptions are made.
(1) The water hammer simulation model only considers a single fracture in each a single fracturing stage. The corresponding impact of fracture on the water hammer is the equivalent result of all fractures in the single fracturing stage;
(2) During the whole process of water hammer occurrence, the fracture stop to propagating and its length is constant;
(3) The fracture leakage is ignored in the whole process of water hammer occurrence;
(4) The pressure drop induced by flow through perforation is ignored.
For the horizontal well, there are several fractures in one fracturing stage. The calculated fracture size is considered as the equivalent fracture size which is the sum of all these fractures’ geometry sizes. Shylapobersky et al. (1988) related net pressure to fracture dimensions with Eq. 11 below:
There are two cases: short crack (2Lf/hf < 1) or long crack (2Lf/hf > 1). Equations for fracture half-length, height, and width were derived from Eqs 12–14.
where Lf is the seam length, hf is the seam height, w is the seam width, E′ is the plane strain elastic modulus, and E(m) is the complete elliptic integral of the second kind (Mondal, 2010).
In order to illustrate the impact of three parameters (R,C,I) on the water hammer signal, several simulation cases are conducted. The geometry model is as shown in Figure 8 and it is assumed that there is a fracture at the end of horizontal well. The impact of fracture on fluid flow is that there is an additional pressure at the location where the fracture exists. This additional pressure is represented by Eq. 10. The parameters used in these simulations are shown in Table 3.
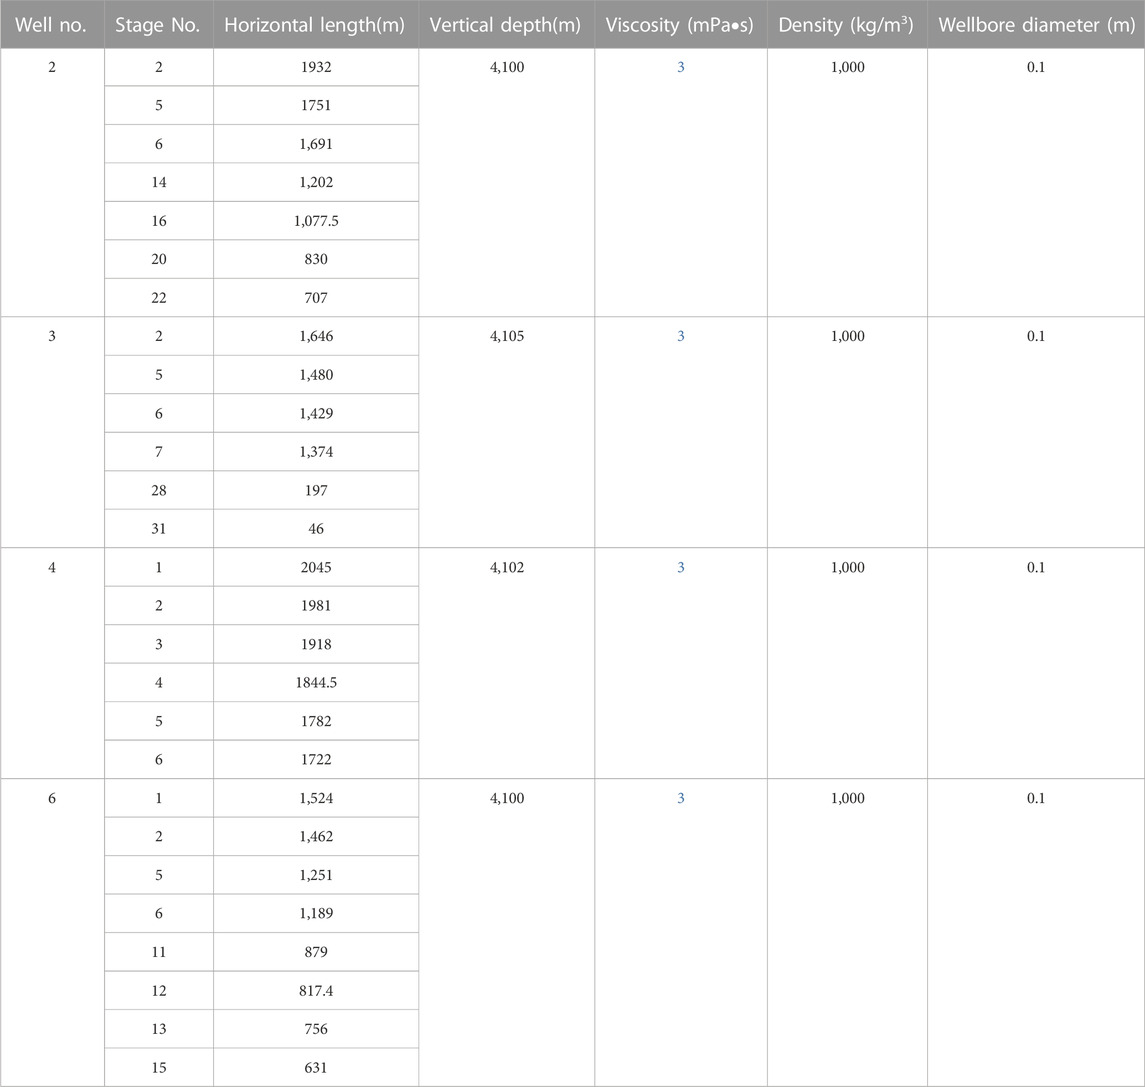
TABLE 3. Parameters used to illustrate the impacts of three key parameters on water hammer signal.
The impact of R on water hammer signal at wellhead is shown in Figure 9. It is clearly shown that R affects the amplitude of the simulated water hammer signal. The amplitude of water hammer signal decreases with the R value. When the R increases from 10 to 50, the initial amplitude of water hammer signal decreases from 5 to 3 MPa. After several periods of vibration, the amplitude also decreases. When the R increases from 10 to 50, the following amplitude of water hammer signal decreases from 3 to 1 MPa.
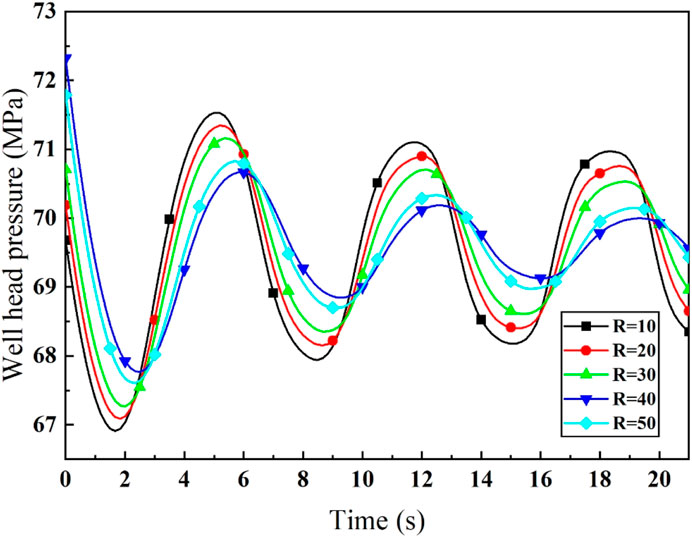
FIGURE 9. Pressure profiles for different R values.
The impact of C on water hammer signal at wellhead is shown in Figure 10. It is clearly shown that C affects the mean value of the simulated water hammer signal. The mean value of water hammer signal decreases with the C value. When the C increases from 0.2 to 1, the mean value of water hammer signal decreases from 74 to 69 MPa. Through these two figures, it is can be seen that water hammer signal is dependent with those parameters, so it is possible that the real water hammer signal could be matched by carefully selecting those parameters’ values.
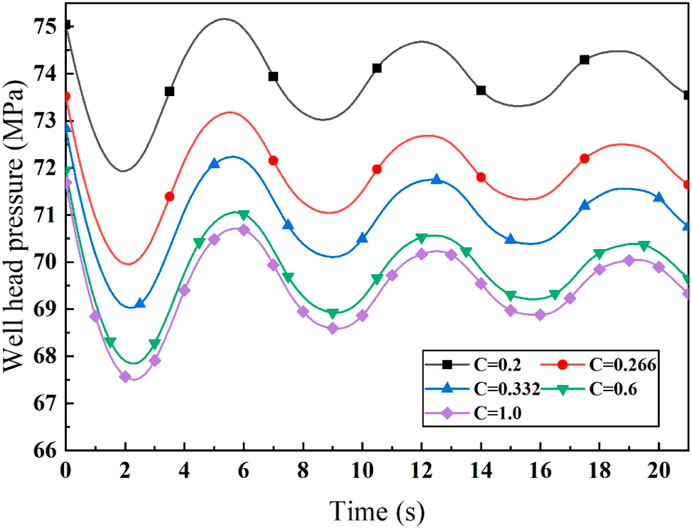
FIGURE 10. Pressure profiles for different C values.
After the available parameters are found out through matching water hammer signal, the fracture size can be calculated by substituting those into Eqs 11–14. To work out the fracture size, the following steps are required.
(1) Obtaining the real water hammer signal from the pressure curve of fracturing stimulation, as shown in Figure 7.
(2) Obtaining the reasonable parameters (R, C, and I) through conducting the numerical simulation of water hammer signal, as shown in Eqs 8–10. The geometry model is shown in Figure 8 and the real well size is set based on the actual data. Optimizing The values of parameters (R, C, and I) are optimized until the minimum error between numerical solution and the real signal is obtained.
(3) Calculating the fracture size. The fracture size can be calculated by substituting the above reasonable values of R, C, and I into Eqs 11–14.
Since some wells do not observe water hammer signals, water hammer inversion cannot be carried out. In the fracturing data from the above 6 wells in section 2, it is found that 27 pressure curves of fracturing stimulations contain water hammer signals. Through the above diagnosis procedure in section 3.4, the suitable values of R, C, and I for these 27 cases are found out and shown in Table 4. The errors between simulation solutions and real water hammer signals are mainly less than 2% and the maximum error is 3.76%.
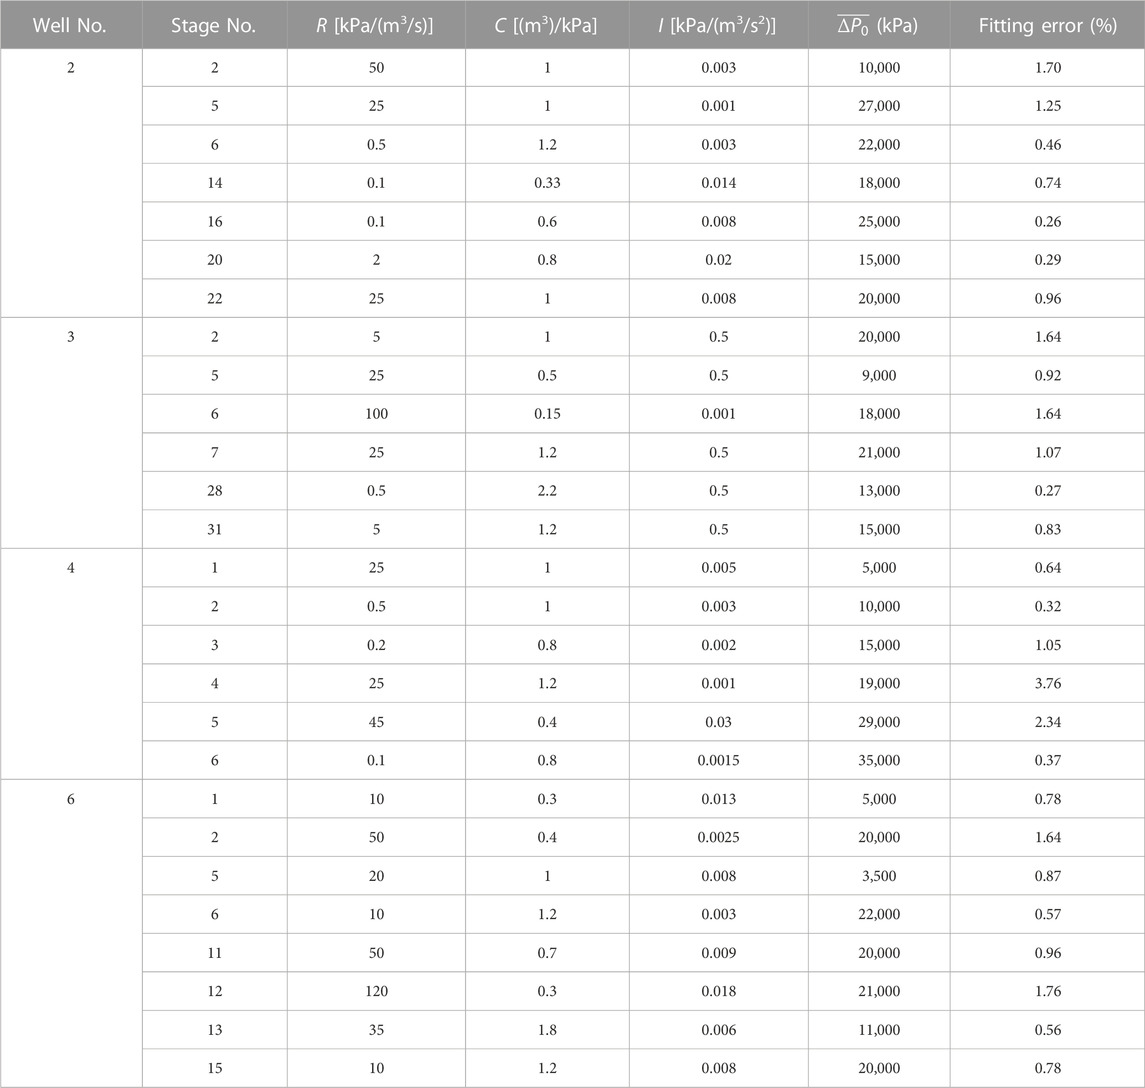
TABLE 4. Parameters required for fitting water hammer signal.
Figure 11 shows the comparison of pressure between simulation solutions and water hammer signal from fracturing stimulations. The comparison results between field data and numerical solutions for 10 stages of Well 2, Well 3, Well 4 and Well 6 are shown in Figures 11A–J, respectively. The order of these figures is set by the accuracy values. The best comparison result is shown in Figure 11A and the worst comparison result is shown in Figure 11J. The main errors are less than 2%, indicating the availability of this numerical model. The accuracy of this model depends on the quantity of water hammer signal. If the water hammer signal has over 4 circles of vibration and the pressure amplitude is less than 1.5MPa, the error falls within 0.26%–0.70%, as shown in Figures 11A–I. Otherwise, the error increases to 1.64%–3.76%, as shown in Figures 11f–J. The reasons for this phenomenon are as follows.
(1) The friction model in the numerical simulation model of the water hammer (f in Eq. 5) may not be suitable for the actual friction behavior of fracturing fluid. When the amplitude of the water hammer signal is less than 1.5 MPa, it indicates that the friction is small, so the error is few.
(2) The method of using three parameters, R, C, and I to represent the effect of fractures on water hammer signals may not be suitable for horizontal wells with quite complex fracture network. The fracture morphology of some horizontal wells has the main fracture and the secondary fractures which are more complex than the normal bi-wing fracture morphology. The impact of such complex fracture on water hammer signal may be hard to be represented by the simple three parameters. If the relationship between these three parameters and fracture size or fracture network is known, this method can be used to evaluate more information of fracture morphology. The corresponding studies are required in the further.
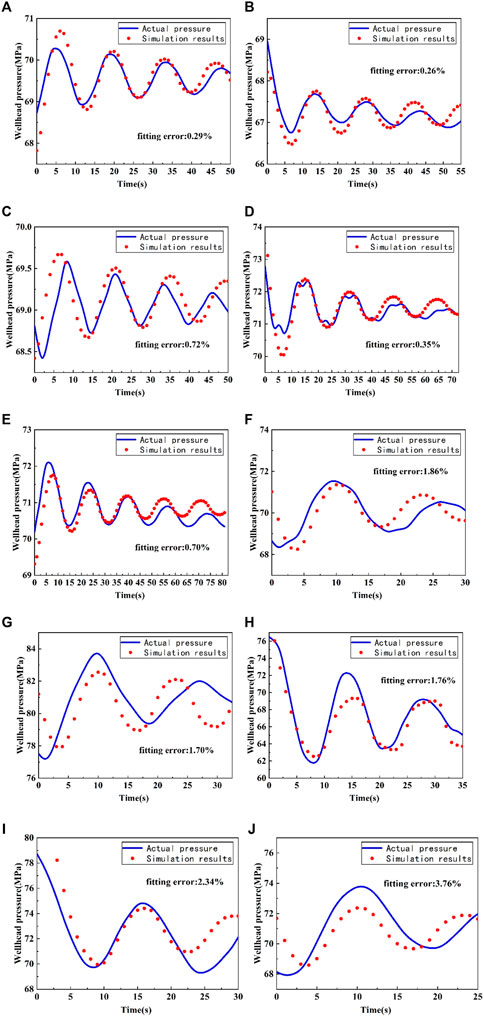
FIGURE 11. Comparison between numerical simulation solutions and actual water hammer signals. (A) comparison result of Stage 20 in Well 2; (B) comparison result of Stage 16 in Well 2; (C) comparison result of Stage 28 in Well 3; (D) comparison result of Stage 2 in Well 4; (E) comparison result of Stage 6 in Well 4; (F) comparison result of Stage 2 in Well 3; (G) comparison result of Stage 2 in Well 2; (H) comparison result of Stage 12 in Well 6; (I) comparison result of Stage 5 in Well 4; (J) comparison result of Stage 4 in Well 4.
After the reasonable values of R, C, and I are obtained, substituting them into Eqs 10–12 can get fracture size. The iteration process is implemented using EXCEL software, with 200 iteration steps. The relevant parameters are shown in Table 4. The fracture length obtained by the water hammer inversion method is compared with that simulated by hydraulic fracturing finite element software. The comparison results for the Well 2, Well 4 and Well 6 are shown in Figures 12A–C, respectively.
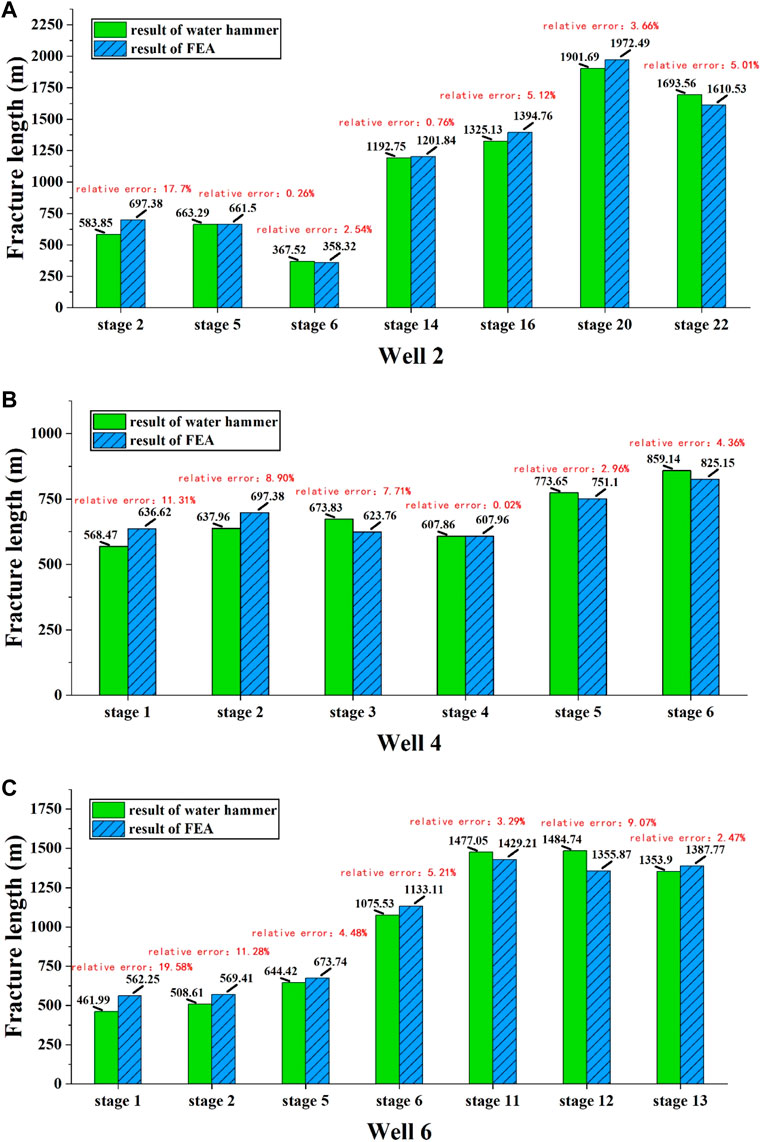
FIGURE 12. Comparison of water hammer inversion results and finite element inversion results. (A) comparison result of Well 2; (B) comparion result of Well 4; (C) comparison result of Well 6.
According to the comparison with the finite element results, the overall errors of this new method is 6.28%. These few errors magnitude indicate that this new method is quite accurate. This method of using water hammer signal to calculate fracture size is much simpler than the one of finite element method, therefore, this new method has more efficiency and can give timely feedback to engineers and ensures quick modification of fracturing stimulation. However, the errors of stages near to horizonal well toe (the number of fracture stage is less than 4) are one-time higher than the overall errors and their errors can be 15%. The fractures of these stages near to horizontal well toe are significantly affected by drilling stimulations so the fracture morphology may be more complex than the one of bi-wing fracture. The relationship of fracture size and water hammer parameters (R, C, and I) is far away from ones shown in Eq. (13) ∼ (15), indicating high errors.
In order to enhance fracture size inversion efficiency, this study proposes a method to obtain fracture size through water hammer signal. The fracture size is first evaluated by normal method. The corresponding method is then built and its results are compared with ones from normal method. The main conclusions are as follows.
(1) The special parameters (R,C and I) in this new method is used to represent impact of fracture on water hammer signal. The parameter C and R have obvious impacts on water hammer signal and they can cause the amplitude of water hammer signal alternate from 5 to 2 MPa.
(2) This new method is accurate for fracture size evaluation and the overall error between its results and the one from normal methods is about 6.28%.
(3) This new method is more suitable for fractures away from horizontal well toe than ones near to well toe. The mean error of fractures away from well toe is only 3.49% but it is 12.75% for fracture near well toe. It is because that the fracture structure is complex near well toe. It indicates that the more accurate relationship between fracture size and parameters (R,C and I) is required for fracture with complex structure.
The raw data supporting the conclusions of this article will be made available by the authors, without undue reservation.
BZ: Conceptualization, Data curation, Formal Analysis, Methodology, Software, Writing–original draft. SW: Writing–review and editing, Data curation. YS: Conceptualization, Investigation, Methodology, Supervision, Writing–review and editing. JG: Formal Analysis, Software, Writing–review and editing. JF: Formal Analysis, Validation, Writing–review and editing. YG: Supervision, Writing–review and editing. PL: Data curation, Writing–review and editing.
The author(s) declare that no financial support was received for the research, authorship, and/or publication of this article.
Authors BZ, JG, and JF were employed by PetroChina Southwest Oil and Gas Field Company.
The remaining authors declare that the research was conducted in the absence of any commercial or financial relationships that could be construed as a potential conflict of interest.
All claims expressed in this article are solely those of the authors and do not necessarily represent those of their affiliated organizations, or those of the publisher, the editors and the reviewers. Any product that may be evaluated in this article, or claim that may be made by its manufacturer, is not guaranteed or endorsed by the publisher.
AjazOuyang, M. F., Wang, G. H., Liu, S. L., Wang, L. X., and Zhao, J. G. (2021). Fluid identification and effective fracture prediction based on frequency-dependent AVOAz inversion for fractured reservoirs. Petroleum Sci. 18 (4), 1069–1085. ISSN 1995-8226. doi:10.1016/j.petsci.2021.07.011
Armor John, N. (2013). Emerging importance of shale gas to both the energy and chemicals landscape. J. Energy Chem. 22 (1), 21–26. ISSN 2095-4956. doi:10.1016/S2095-4956(13)60002-9
Cao, M., and Sharma, M. M. (2022). “Fracture diagnostics in naturally fractured formations: an efficient geomechanical microseismic inversion model,” in Paper presented at the SPE/AAPG/SEG Unconventional Resources Technology Conference, Houston, Texas, USA, June 2022. doi:10.15530/urtec-2022-3723539
Carey, M. A., Mondal, S., and Sharma, M. M. (2015). “Analysis of water hammer signatures for fracture diagnostics,” in Paper presented at the SPE Annual Technical Conference and Exhibition, Houston, Texas, USA, September 2015. doi:10.2118/174866-MS
Castillo, J. L. (1987). “Modified fracture pressure decline analysis including pressure-dependent leakoff,” in Paper presented at the SPE/DOE Joint Symposium on Low Permeability Reservoirs, Denver, Colorado, USA, May, 1987. doi:10.2118/16417-MS
Chaudhury, H. M. (1987). Applied hydraulic transients. New York, NY, USA: Van Nostrand Reinhold Company.
Chen, Z. (2005). Finite element methods and their applications. Heidelberg, Germany: Springer-Verlag. doi:10.1007/3-540-28078-2
Chen, Z., Huan, G., and Ma, Y. (2006). Computational methods for multiphase flows in porous media. Comput. Sci. Eng. Ser. 2. doi:10.1137/1.9780898718942
Churchill, S. W. (1997). Friction factor equation spans all fluid-flow regimes. Chem. Eng. 84 (24), 91–92.
Davis, J., Warpinski, N. R., Davis, E. J., Griffin, L. G., and Malone, S. (2008). “Joint inversion of downhole tiltmeter and microseismic data and its application to hydraulic fracture mapping in tight gas sand formation,” in Paper presented at the The 42nd U.S. Rock Mechanics Symposium (USRMS), San Francisco, California, June 2008.
Gabriel, C., Sonja, M., Thierry, C., Christian, D., and Varela, I. (2009). “Fracture characterization of a tight gas reservoir using seismic attributes derived from singular value decomposition of azimuthal AVO data,” in Paper presented at the International Petroleum Technology Conference, Doha, Qatar, December 2009. doi:10.2523/IPTC-14042-MS
Gregg, Z., Lu, C.-P., Tsenn Michael, C., Mitchell, J., and Michael DeGraff, J. (2009). “P-Wave seismic azimuthal anisotropy for detection and prediction of fractures in a middle eastern carbonate reservoir,” in Paper presented at the International Petroleum Technology Conference, Doha, Qatar, December, 2009. doi:10.2523/IPTC-13903-MS
Guo, Z., Nie, N., and Cai, L. (2022). Fracture characterization based on improved seismic amplitude variation with azimuth inversion in tight gas sandstones, Ordos Basin, China. Mar. Petroleum Geol. 146 (2022), 105941. ISSN 0264-8172. doi:10.1016/j.marpetgeo.2022.105941
Hou, Y., Peng, Y., Chen, Z., Liu, Y., and Tian, Y. (2022). Investigating heterogeneous distribution of fluid pressure in hydraulic fractures during pulsating hydraulic fracturing. J. Petroleum Sci. Eng. 209, 109823, 109823. ISSN 0920-4105. doi:10.1016/j.petrol.2021.109823
Hou, Y., Peng, Y., Chen, Z., Liu, Y., Zhang, G., Ma, Z., et al. (2021). Investigation on the controlling factors of pressure wave propagation behavior induced by pulsating hydraulic fracturing. SPE J. 26, 2716–2735. doi:10.2118/205384-PA
Huang, G., Jing, Ba, Davide, G., and José, M. (2023). Carcione,Amplitude variation with angle and azimuth inversion to estimate fracture properties in shale-gas reservoirs. Gas Sci. Eng. 111 (204919), 2023. ISSN 2949-9089. doi:10.1016/j.jgsce.2023.204919
Hwang, J., Szabian Matthew, J., and Sharma, M. (2017). “Hydraulic fracture diagnostics and stress interference analysis by water hammer signatures in multi-stage pumping data,” in Paper presented at the SPE/AAPG/SEG Unconventional Resources Technology Conference, Austin, Texas, USA, July 2017. doi:10.15530/URTEC-2017-2687423
Iriarte, J., Merritt, J., and Kreyche, B. (2017). “Using water hammer characteristics as a fracture treatment diagnostic,” in Paper presented at the SPE Oklahoma City Oil and Gas Symposium, Oklahoma City, Oklahoma, USA, March 2017. doi:10.2118/185087-MS
Jatykov, T., and Bimuratkyzy, K. (2022). Case study: an approach for hydraulic fracturing minifrac G-function analysis in relation to facies distribution in multilayered clastic reservoirs. SPE Prod Oper 37 (2022), 99–106. doi:10.2118/206751-PA
Jordan, C., and Iraj, S. (2017). Hydraulic fracturing system and method. United States. https://www.osti.gov/servlets/purl/1345371.
Li, Y., Wang, J., Yang, H., Zhang, Y., and Zheng, X. (2013). “Fracture characterization using azimuthal AVO, ant-tracking, and curvature,” in 83rd Annual International Meeting, Houston, Texas, USA, September, 2013, 388–392. doi:10.1190/segam2013-0594.1
Minsley Burke, J., Willis Mark, E., Mary, K., Burns Daniel, R., and Nafi Toksöz, M. (2004). “Investigation of a fractured reservoir using P-wave AVOA analysis: a case study of the emilio field with support from synthetic examples,” in Paper presented at the 2004 SEG Annual Meeting, Denver, Colorado, October 2004.
Mondal, S. (2010). Pressure transients in wellbores: water hammer effects and implications for fracture diagnostics. http://hdl.handle.net/2152/ETD-UT-2010-12-2606.
Muhammad, A., and Sun, S. Z. (2020). “Fluid identification and effective fractures prediction by combining AVOF, AVOZ, and AVOZF inversion in fractured carbonate reservoir,” in Paper presented at the SEG International Exposition and Annual Meeting, Virtual, October 2020. doi:10.1190/segam2020-3428075.1
Peng-Fei, Y., Sheng-Qi, Y., Gao, F., Tian, W.-L., and Zeng, W. (2023). Numerical investigation on hydraulic fracture propagation and multi-perforation fracturing for horizontal well in Longmaxi shale reservoir. Theor. Appl. Fract. Mech. 125 (2023), 103921. ISSN 0167-8442. doi:10.1016/j.tafmec.2023.103921
Qian, C., Li, X., Zhang, Q., Shen, W., Guo, W., Lin, W., et al. (2023). Reservoir characteristics of different shale lithofacies and their effects on the gas content of Wufeng-Longmaxi Formation, southern Sichuan Basin, China. Geoenergy Sci. Eng. 225, 211701, 211701. ISSN 2949-8910. doi:10.1016/j.geoen.2023.211701
Qian, C., Zhang, F., Liu, Y., Zhang, Q., Tian, L., and Xie, G. (2020). A multi-parameter fracture inversion method based on thermal neutron detection technology. J. Petroleum Sci. Eng. 188, 2020, 106874. ISSN 0920-4105. doi:10.1016/j.petrol.2019.106874
Qiu, Y., Hu, X., Zhou, F., Li, Z., Li, Y., and Luo, Y. (2022). Water hammer response characteristics of wellbore-fracture system: multi-dimensional analysis in time, frequency and quefrency domain. J. Petroleum Sci. Eng. 213 (2022), 110425. ISSN 0920-4105. doi:10.1016/j.petrol.2022.110425
Recep, B., Erdal, O., and Kazemi, H. (2021). “Modeling and analysis of diagnostic fracture injection tests DFITs,” in Paper presented at the SPE Europec featured at 82nd EAGE Conference and Exhibition, Amsterdam, The Netherlands, October 2021. doi:10.2118/205174-MS
Tu, Z., Hu, X., Zhou, F., Huang, G., Han, S., and Zhou, Q. (2022). A new multi-fracture geometry inversion model based on hydraulic-fracture treatment pressure falloff data. J. Petroleum Sci. Eng. 215 (2022), 110724. ISSN 0920-4105. doi:10.1016/j.petrol.2022.110724
Xiao, G., Yao, Li, Zhang, Y., and Xu, D. (2022). “Fracture reservoir prediction method based on AVO disturbance variance,” in Paper presented at the SEG/AAPG International Meeting for Applied Geoscience and Energy, Houston, Texas, USA, August 2022. doi:10.1190/image2022-3745649.1
Yuan, X., Zhang, Y., Ju, L., Peng, F., Qi, T., Yang, X., et al. (2016). “A method of quickly evaluating the fracture complexity of network fracturing,” in Paper presented at the International Petroleum Technology Conference, Bangkok, Thailand, November 2016. doi:10.2523/IPTC-18613-MS
Keywords: unconventional reservoir, hydraulic fracturing, numerical simulation, fluid flow, fracture propagation
Citation: Zeng B, Wei S, Su Y, Gui J, Feng J, Guo Y and Lyu P (2024) Fracture size inversion method based on water hammer signal for shale reservoir. Front. Energy Res. 11:1336148. doi: 10.3389/fenrg.2023.1336148
Received: 10 November 2023; Accepted: 12 December 2023;
Published: 05 January 2024.
Edited by:
Yishan Liu, Research Institute of Petroleum Exploration and Development (RIPED), ChinaReviewed by:
Lei Chen, SINOPEC Petroleum Exploration and Production Research Institute, ChinaCopyright © 2024 Zeng, Wei, Su, Gui, Feng, Guo and Lyu. This is an open-access article distributed under the terms of the Creative Commons Attribution License (CC BY). The use, distribution or reproduction in other forums is permitted, provided the original author(s) and the copyright owner(s) are credited and that the original publication in this journal is cited, in accordance with accepted academic practice. No use, distribution or reproduction is permitted which does not comply with these terms.
*Correspondence: Yuliang Su, c3V5dWxpYW5nQHVwYy5lZHUuY24=
Disclaimer: All claims expressed in this article are solely those of the authors and do not necessarily represent those of their affiliated organizations, or those of the publisher, the editors and the reviewers. Any product that may be evaluated in this article or claim that may be made by its manufacturer is not guaranteed or endorsed by the publisher.
Research integrity at Frontiers
Learn more about the work of our research integrity team to safeguard the quality of each article we publish.