- Energy Development Research Institute, China Southern Power Grid, Guangzhou, China
Renewable energy generation (REG) has continued to grow strongly and resulted in the lower profitability of conventional generation. Meanwhile, the indeterminacy of REG will also lead to electricity balancing challenges and more volatile and less-predictable physical flows in the power grid. In this case, a capacity market is essential to motivate new investments and, therefore, ensure supply adequacy. Considering the low-carbon transition goal and the requirements of the reliability of the power system, this paper develops a reliability-constrained capacity market framework in which the reliability criterion rather than the capacity supply–demand equilibrium is taken into account. The ramping constraints, devices’ random failures, and REG uncertainties are comprehensively considered in the capacity requirement determination and allocation. First, a comprehensive capacity market mechanism coordinated with multi-objective regulations is proposed to compensate the capacity providers and encourage the renewable energy transition. Then, a novel capacity market model is proposed to clear the market with reliability constraints. Moreover, to reduce the computational burden caused by the explicit consideration of reliability constraints, several techniques are applied including the root-event-based state screening technique and the adaptive Kriging metamodel. A modified IEEE-RTS-79 case is studied to illustrate the benefits of the proposed reliability-constrained capacity market model.
1 Introduction
In recent decades, there has been a global trend toward the deregulation of electricity markets. The primary objective of this deregulation is to stimulate competition among various electricity generators, ultimately enhancing market efficiency and reducing costs. A noteworthy development in major markets worldwide is the increasing prominence of renewable energy generation (REG) (Mitra and Nguyen, 2022). In 2018, 26.2% of global energy consumption was attributed to renewable energies, and it is projected to surge to 45% by 2040. The growth in renewable capacity is particularly driven by intermittent sources, specifically wind and solar photovoltaics. Notably, these sources exhibit a unique characteristic wherein their total cost is predominantly determined by capital costs with marginal costs nearing 0 (Yang et al., 2020). In contrast, conventional generation, particularly thermal power generation, struggles to compete with the cost dynamics of REG sources. Consequently, the load factors and profitability of conventional generators are on a decline. Despite this, the intermittent nature of REG prevents it from entirely replacing the conventional generation (Ssengonzi et al., 2022). The reliability and security of power supply are still dependent on conventional generations.
Due to the deteriorating profit margins, there has been a decline in investor enthusiasm for new conventional generation investments. Concurrently, with the persistent surge in demand for reliable capacity, the system generation adequacy is now under risk. Various capacity mechanisms have been deliberated to ensure the sufficiency of power supply (Petitet et al., 2017; Kirschen and Strbac, 2018). The current regulatory discourse predominantly revolves around capacity markets, in which resources are compensated for their readiness to meet peak electricity demand, with payments determined through auction processes (Khezr and Nepal, 2021). The discussion on the capacity market design has spanned within the academic literature for many years. For example, Cramton and Stoft (2005) elaborated the design principles for ensuring adequate capacity while mitigating market power concerns. Chen et al. (2020) proposed a novel capacity market mechanism coordinated with multi-objective regulations, and Shang et al. (2021) further extended the model to take into consideration the network topology and spot market operation. Addressing the question of compensating existing generations upon the capacity market, Cramton et al. (2013) argued that all generations should receive compensation, aligning with the principles of an energy-only market.
Nowadays, the capacity market is adopted by several major independent system operators (ISOs) in the United States, such as PJM, New York ISO, and ISO-New England, to ensure an adequate medium- and long-term security of generation supply by remunerating generators for their capacity availability (Bushnell et al., 2017; PJM, 2023a; PJM, 2023b). The energy crisis of 2022 has increased the re-thinking of the energy supply security and the need to increase decarbonization, sparking discussions on the need to redesign the EU’s electricity market. The reform of the electricity market was first presented by the European Commission in March 2023. The proposal of the market reform has supported the investments in firm and low-carbon capacity. In order to “ensure long-term security of supply and provide investor certainty,” it argues for the further assessment of capacity mechanisms (i.e., remuneration for power plants to secure long-term supply) to ensure investments in firm renewable and low-carbon capacity (Widuto, 2023). One of the key elements of capacity market design is the determination and allocation of the required capacity. The existing capacity market designs in ISOs consider the determination and allocation separately (Hobbs et al., 2007). First, they determine the required capacity based on the variable resource requirement (VRR) curve that reflects the value of load (Bhagwat et al., 2016). Then, the capacity allocation is achieved through the intersection between the VRR curve and the supply curve, while the supply curve of the generation capacity is based on offered generation capacities.
Although this mechanism could maintain generation capacity adequacy at peak, it could not guarantee the system reliability targets (Fang et al., 2018). System reliability is not only determined by the available capacity but also influenced by the ramping capability of power systems, which is necessary to follow REG fluctuation (Currie et al., 2017). Additionally, as those models usually concern system-wide balancing between demand and supply, they could not be fit for larger regional markets with severe internal peak mismatch and transmission congestion. Moreover, as surging REG integration is reshaping the generation mix and it is difficult to precisely predict the required capacity to meet the reliability criterion, the modeling of REG volatility and uncertainty is simplified in practices.
Some researchers have made efforts to improve the capacity market model. Fang et al. (2021) introduced a novel capacity market model integrating flexibility requirements to address ramping needs arising from load, wind, and solar power fluctuations. Mertens et al. (2021) quantified the capacity credit of energy storage in capacity markets. Cañas-Carretón and Carrión (2020) considered the reserve provision by wind power plants in the capacity market. Sun et al. (2022) reviewed the capacity markets that incorporate the demand response resources. Some capacity expansion models can be modified to search the capacity market equilibrium. For example, Dehghan et al. (2016) and Costa et al. (2021) considered constraints on reliability indexes via Monte Carlo simulation and Benders decomposition with feasibility cuts. Rashidaee et al. (2018) considered the loss of load probability (LOLP) constraint in the generation expansion planning model.
As discussed above, there is a growing acceptance that the reliability criteria should be concerned in capacity market clearing. Several capacity market models with reliability-related constraints or objective functions have been proposed by Lu et al. (2019). However, introducing the reliability-related constraints significantly increases the complexity of optimization modeling since the reliability evaluation is based on the state analysis of numerous system states. Thus, these models usually neglect or simplify ramping constraints, random failures of the generation and transmission devices, and renewable energy uncertainty.
This paper introduces a capacity market framework tailored for power systems characterized by high proportions of REG, aligning seamlessly with the fundamental objectives of the electrical system—affordability, reliability, and sustainability. To extend the existing literature, this paper establishes demand and supply models covering the whole period of the target year and incorporates REG development goals as a key constraint into the market clearing model, enabling it to not only identify marginal capacity costs and ensure capacity supply but also facilitate the low-carbon transformation of the power system. In this manner, the capacity market clearing model could not only identify the marginal capacity cost and ensure the capacity supply but also promote the low-carbon transformation of the power system. The primary contribution of this paper is listed as follows:
• First, a comprehensive capacity market mechanism coordinated with multi-objective regulations is proposed in this paper. The proposed market can satisfy the total capacity requirements and involves additional energy structure constraints which can promote energy transition.
• Second, a novel capacity market model is proposed that seeks the optimal allocation of capacity requirements among the providers while meeting the reliability criterion. Moreover, the uncertainties of REGs, loads, the random outages of generation, and transmission devices are considered to evaluate the reliability.
• Third, to reduce the computational burden caused by the explicit consideration of reliability constraints in the capacity market model, the root-event-based state screening technique and Kriging metamodel are applied for reducing the number of system states and simplifying the system state analysis.
The remainder of this paper is organized as follows. Section 2 introduces the framework of the proposed capacity market with an emphasis on the operational process. Section 3 introduces the modeling of devices’ reliability models and formations of REG and load curves. Section 4 formulates the proposed capacity market model and proposes the techniques for the efficient solution of the model. Case studies and conclusion are provided in Section 5; Section 6, respectively.
2 Design of the capacity market mechanism
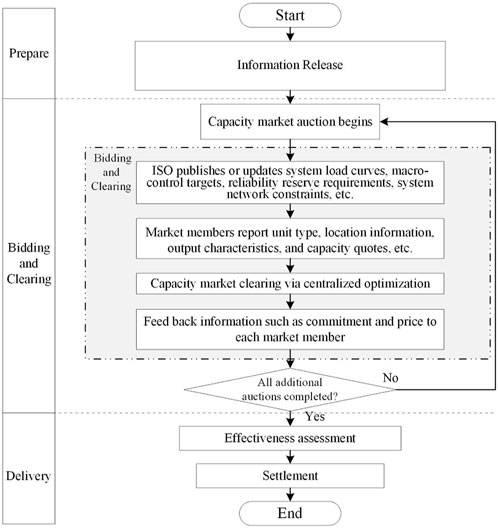
The proposed capacity market involves multi-round auctions. The base residual auction will be conducted several years before the delivery year (target year), followed by several additional capacity auctions as appropriate. Different types of capacity resources can participate in the capacity market, including conventional thermal units, hydropower plants, nuclear units, wind power plants, and PV units, while other resources such as energy storage and demand response can be allowed to participate in the market as required. Each resource bids into the auction at its total cost of investment and operational costs, with the consideration of the expected income in the wholesale energy market. The process of the additional auctions is similar to that of the base residual auction. After the capacity resources in different regions submit their offering curves, the capacity market model is performed to clear the market to determine the commitment of each resource. In addition, the “clearing price” is set by the most expensive resource needed to meet the demand.
The specific process of the capacity market is illustrated in Figure 1, which can be divided into the following main steps:
Step 1. Before the opening of the market, the ISO, or the transmission system operator (TSO), will forecast the system load of the target year. The ISO along with the regulators will also determine the other security- and policy-related constraints that provide the boundaries of the market operation.
Step 2. After the opening of the market, the ISO will release information about system load, energy regulation targets, reliability reserve requirements, system network constraints, etc. Then, the market participants will submit their technical and marketing information to the ISO, including the types and locations of their existing capacity resources and offering curves of the existing and to-be-built capacity resources.
Step 3. According to the information obtained from market participants, combined with the system load curves, energy development constraints, system operation constraints, etc., the market is cleared. The commitment of each capacity resource and the clearing price are simultaneously determined.
Step 4. The ISO feedback on the results of market clearing to each market participant to complete the base residual auction.
Step 5. Before the delivery of capacity, the ISO shall timely organize several additional auctions that are basically the same as Step 2 to Step 4, and the auction results shall be updated and released on a rolling basis.
Step 6. During the capacity delivery period, the ISO shall evaluate the effectiveness of the commitment results within the contract period (single year, several years or longer, etc.) and compensate the capacity resources according to the clearing price afterward.
3 Modeling of demand and supply
3.1 Reliability models of the electricity generation units
It is assumed that each generation unit has two possible states, including the working and failure states. Under such circumstances, the availability and unavailability of a device can be calculated as follows (Hu et al., 2021):
where λ denotes the expected failure rate, which is the frequency with which an engineered system or component fails, expressed in failures per unit of time; µ demotes the expected repair rate, which is the rate with which a repair action is performed and is expressed in terms of the number of repair actions performed per hour; m denotes mean time to failure (MTTF), m = 1/λ; and r denotes the mean time to repair (MTTR), 1/r = µ.
Hence, the available generation capacity of the whole power system can be expressed as the following multi-state system (MSS) model:
where i denotes the index of the generation units, Ni denotes the number of the units, and z is the symbol of z-transform.
The above MSS model describes the mapping function between the specific realization of available generation capacity and the corresponding probability. Taking the first term of Eq. 3 as an example, it denotes the probability of a no-failure scenario is
3.2 Formation of the REG supply curve
The power output of REG, such as wind power and solar PV, varies over time as the meteorological condition changes. Therefore, it is necessary to capture the fluctuation characteristics of renewable generation for evaluating the power system capacity requirements. To determine the extent to which fluctuating renewable generation can ensure grid reliability, many grid planners have embraced a concept called effective load-carrying capability (ELCC). The ELCC of a generator is defined as the amount by which the system’s loads can increase when the generator is added to the system while maintaining the same system reliability.
However, the ELCC of renewable generation is affected by the scenario of the electricity generation mix. For example, the ELCC of renewable generation is usually larger in power systems with sufficient flexible generating units. Hence, the ELCC method is not precise for capacity market models when much of additional generating units should be planned.
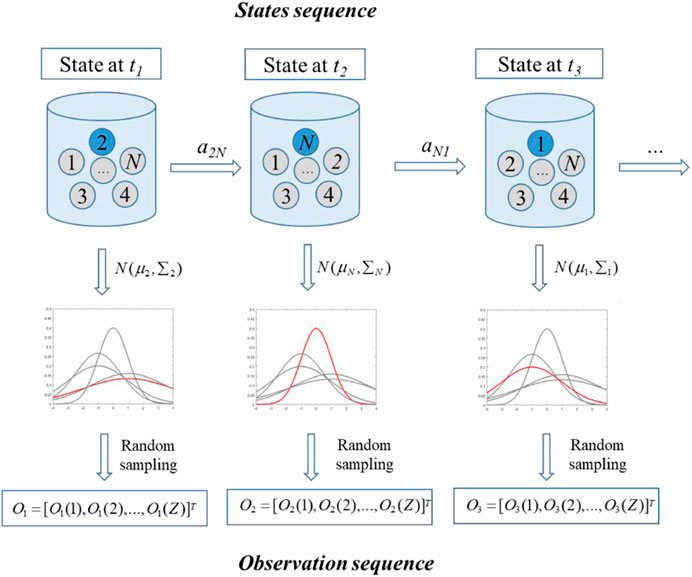
This paper adopts the power time series model to represent the fluctuation characteristics of renewable generation. The Gaussians mixture model–hidden Markov model (GMM–HMM) method is used to mine the statistical characteristics of REG power output from historical output data and then uses a simulation method to obtain output time series with similar patterns. It should be noted that such a method does not pursue point-by-point accuracy, but focuses on the extraction and reconstruction of statistical characteristics.
There are three main steps involved in the GMM–HMM method for generating the REG power output time series, including construction, learning, and prediction (Li et al., 2021).
3.2.1 Step 1—construction of the HMM
In this study, the observation sequence is the time series of REG power, whereas the state sequence is the non-observable factors affecting REG power, such as climate conditions. Figure 2 illustrates the generation of a hypothetical REG power scenario based on the HMM, where the natural number 1, ..., N expresses the state sequence. At time t1, the state variable 2 is selected at random. Under the climatic conditions corresponding to state variable 2, the REG power follows the probability distribution
Consequently, the hidden Markov model is uniquely determined by four parameters,
3.2.2 Step 2—learning of the HMM
REG power is an easily observable variable in the real world. Learning the HMM is the process of calculating the HMM parameters that maximize the probability of the observed variable sequence using historical data of the observed variables. It is symbolized by the maximization of
3.2.3 Step 3—prediction of the HMM
Using the HMM parameters and the Viterbi algorithm, the state sequence of the REG power prediction sequence with the highest probability among all other state sequences is determined. This calculation is known as HMM learning and can be regarded as maximizing
3.3 Modeling of the load demand
Based on the historical data, the load demand can be forecasted. Moreover, the capacity market model accommodates a per-unitized daily peak load model with uncertainty introduced on a weekly basis via normal distributions; that is, for an entire delivery year, 52 normal distributions are developed for modeling the uncertainty related to future load demand.
The coverage of the capacity market can be a regional scope (including many regions and provinces) or the whole country. The forecasting methods for the target annual load curve of the system have been well developed, and only one of the deterministic methods is given as follows:
(1) Based on the historical load of each province (region) in recent years, the typical daily and monthly load characteristic curves of the target year can be obtained through the analysis and forecast.
(2) By analyzing and forecasting the maximum load of each province (region) in the target year, the target annual load curve of each province (region) can be obtained by combining the aforementioned forecasting load characteristic curves.
(3) The target annual load curves of multiple provinces (regions) can be accumulated at different points to obtain the target annual load curves of the regional scope or the whole country. Shang et al. (2021) provided one of the methods used in the process of developing system load curves.
The load level of the system is related to complex factors, such as economic development, and it can be adjusted and corrected on a rolling basis according to the actual situation before the year of capacity delivery, which can be responded to by additional incremental auctions.
For simplicity, the load demand is expressed as the following normal distribution:
where
3.4 Reliability index and the evaluation
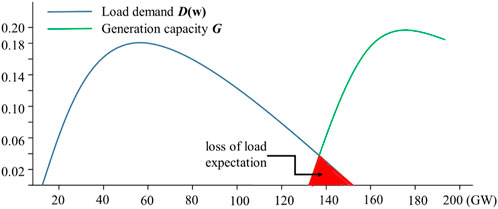
There are different indices that can measure the reliability of power systems, such as loss of load expectation (LOLE) and expected energy not supplied (EENS). The loss of load event occurs when the available generation capacity is below the demand, as shown in Figure 3. Hence, LOLE is represented by the expected number of hours per year that the power system cannot meet its demand, which is expressed in Eq. 5. EENS represents the energy which is expected not to be supplied due to insufficient resources to meet demand needs during a given time period, which can be calculated as the product of LOLE and the averaged load shedding (Yang et al., 2020).
4 Optimization model of the capacity market
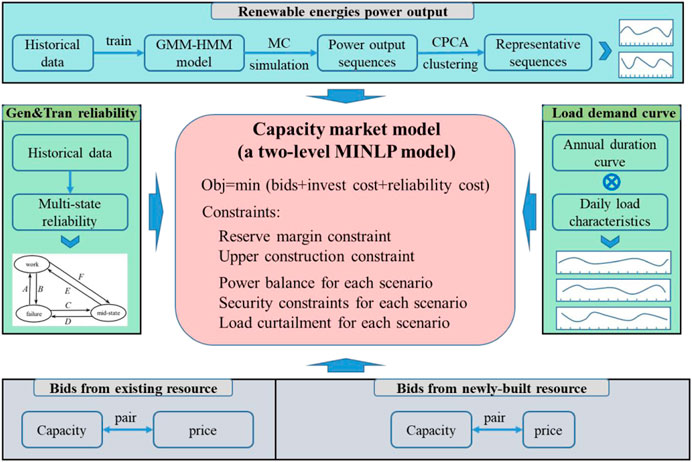
The proposed capacity market model is illustrated in Figure 4. The two types of input parameters are required.
The technical data include the reliability parameters of generation and transmission devices, REG power output time series, and daily load curves. The economic parameters mainly include the offer curves of the existing capacity resources and to-be-built capacity resources which are made up of price-capacity pairs.
4.1 Formulation of the capacity market model
The capacity model is formulated as an optimization problem as follows:
With the following constraints, we obtained
The objective in Eq. 6 represents the sum of the capacity offer and operation costs, where i, j, and k denote the index of existing generation units, the to-be-built conventional generating units, and the to-be-built REG;
Equation 8 limits the power output of generating units. Equation 9 guarantees the capacity adequacy of the system where
The reliability constraint can be formulated based on either LOLE or EENS.
The reliability constraint based on LOLE is expressed as follows:
where
4.2 Reforming of reliability constraints
As we can see from Eq. 12, the LOLE index of each year is dependent on the distributions of available generation capacity and load demand. Load demand distributions are forecasted based on historical data, which are classified into exogenous uncertainty. The distributions of available generation capacity, on the contrary, are affected by the generation expansion decisions. For example, more newly built generation capacity results in larger mean values and variances of available generation capacity. Without the loss of generality,
where
Under such circumstance,
According to the probability distribution function of normal distributions, Eq. 15 is equal to
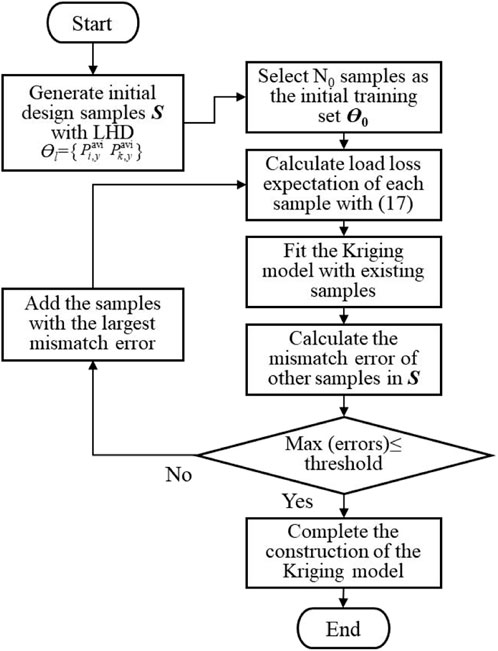
Evidently, Eq. 16 is difficult to be incorporated into the optimization model. Given that, the Kriging model is applied to obtain the approximate function of Eq. 16. The Kriging model is an interpolation method based on statistical theory. It consists of a regression model and a non-parametric stochastic process. For the set of sample points X and the set of objective functions Y, the Kriging model can be expressed as follows:
where f is the basis function matrix and β is the coefficient matrix. Since the choice of the basis function has little effect on the accuracy of the metamodel, the quadratic function is selected as the basis function. The basic function is used to denote the approximated relationship between the value of
The main steps of the aforementioned Kriging model construction are shown in Figure 5.
5 Case studies
5.1 Test system and assumptions
The modified IEEE-RTS-79 is studied in a 12-year planning horizon to show the effectiveness of the proposed model. The capacity market is held 3 years in advance of the first target/delivery year (T1). Target years T2–T10 are the nine successive years followed by T1. The power system topology and reliability parameters can be found in (P.M. Subcommittee, 1979). The details concerning the annual peak load and load growth are reported by Jong-Bae et al. (2000). Other criteria and system-related values are shown in the work of Rashidaee, et al. (2018).
There are six types of generating units considered, and the data are provided in Table 1. It is assumed that there are already 20 generating units, including one oil power unit, three gas power plants, four coal power plants, one nuclear unit, eight wind power plants, and four solar PV units.
In reality, what price a power plant bids into the capacity market varies quite dramatically. A near-retirement power plant could actually bid at a very low position and a new power plant could have a much higher bid. For the sake of convenience, the bid prices of the power plants are set in a unified manner, which can be expressed as follows:
The compensation factors of the nuclear power and REG plants that have near-zero operation costs are set as 0.25, while the compensation factors of other plants are set as 0.5. The random coefficients of all the plants are set between [0.9 and 1.1] to represent the potential uncertainties related to strategic behaviors.
5.2 Simulation results of the base case
In the base case, the operator holds an auction that provides the available capacity for target year T1 with constraints that the proportion of REG exceeds 10%, LOLE is below 2.4 h/y, and EENS is below 70000 MWh/y. The proposed capacity market model is performed to clear the market. The commitment of the power plants is summarized in Table 2.
Here, N-3 contingencies are considered to evaluate the system reliability. There are 18,352 original N-3 contingencies in total. With the root-event-based contingency screening technique, 574 critical contingencies are identified. Therefore, the computation efficiency of the capacity market model is significantly improved. To verify the accuracy of the contingency screening technique, the Monte Carlo simulation-based method is applied to evaluate system reliability given the capacity market clearing results. The value of EENS is calculated as 68,732.08 MWh/y, which is less than 70000 MWh/y. In other words, the capacity market model successfully guarantees the expected reliability criterion for the target year. It mostly confirms the efficiency of the proposed contingency screening technique.
5.3 Sensitivity analysis of REG development goals
In this section, different REG development goals are considered to test its influence on the capacity market clearing. Three scenarios are modeled, including the 10% REG scenario (share of REG in the electricity generation, calculated as in Eq. 8, should be no less than 10%), 20% REG scenario, and 25% REG scenario. Moreover, the auctions are held every year for a decade that covers the target years T1–T10. As shown in Figure 6, a more ambitious REG development goal results in a significantly increased installed capacity of REG plants. In the 10% REG scenario, the accumulative capacity of REG plants during the decade is 3450 MW. It increases to 7200 MW for the 20% REG scenario, which is 109% more than that of the 10% REG scenario. The accumulative capacity further increases to 8650 MW. In response to this change, the share of flexible power plants, mainly referring to gas power plants, also increases. In the 10% and 25% REG scenarios, the shares of gas power plants in the non-REG plants are 38.6% and 56.4%, respectively. The reason behind this is simple: the proposed capacity market model considers the ramping constraints into account, and therefore, the flexible power plants are favored in the commitment, particularly in the case of large-scale REG. On the contrary, the share of nuclear power plants decreases along with the growing REG capacity since the nuclear power plants cannot provide the necessary flexibility to accommodate the fluctuating REG.
Figure 7A depicts the capacity market clearing price and the cost per MWh of the electricity supply. The clearing prices are between 30 and 40$/Wh/day for all scenarios. Generally speaking, the capacity price is relatively lower in the scenario with more REG plants. REG power plants have near-zero operation costs and consequently make higher profits in the energy market. It allows them to bid into the capacity market at lower prices. The integration of cheaper REG plants drives down capacity prices.
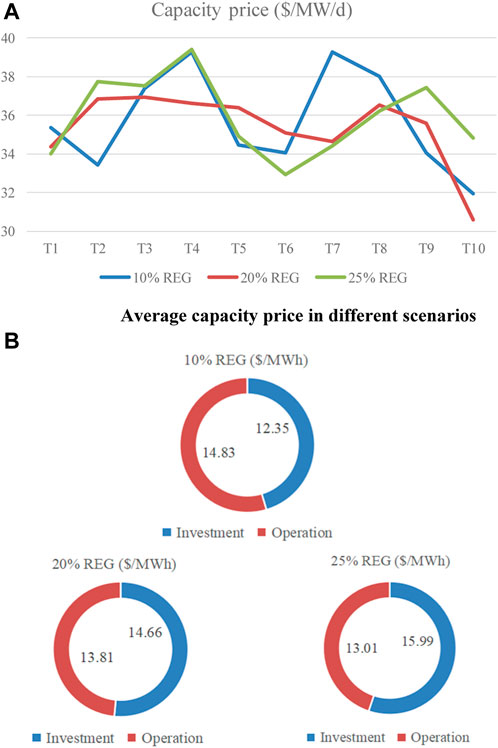
FIGURE 7. (A) Average capacity price in different scenarios. (B) Cost per MWh of electricity in different scenarios.
Figure 7B shows the total cost to provide 1 MWh of electricity in different scenarios. Notably, the investment-related cost and operational cost per MWh of electricity supply are 12.35$ and 14.83$, respectively, in the 10% REG scenario. In the 25% REG scenario, the investment-related cost increases to 15.99$, while the operational cost decreases to 13.01$. REG is not as reliable as the conventional power plants. A larger installed capacity is required with a high proportion of REG. Therefore, the investment-related cost is increased as a result. The lower operational cost in the 25% REG scenario is due to the zero-fuel cost of REG. The total costs per MWh of the electricity supply in the 10% REG scenario, 20% REG scenario, and 25% REG scenario are 27.18$, 28.47$, and 29.00$, respectively. It is concluded that a higher share of REG comes with a price. However, it is very likely to be accepted considering the environmental benefits of REG.
5.4 Sensitivity analysis of reliability requirements
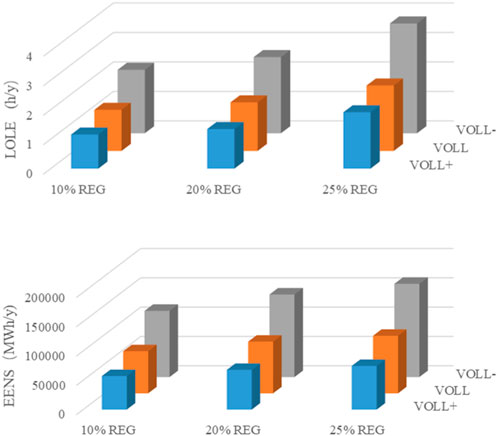
In this section, the reliability indices are no longer regarded as a constraint in the capacity market model. On the contrary, EENS is multiplied by the value of lost load (VOLL) and added to the objective function. In other words, there is no more a strict constraint that LOLE and EENS should not exceed the thresholds. Instead, the capacity market model seeks the equilibrium between the investment costs of power plants and the load-shedding risk. Here, different levels of VOLL are considered. The benchmark of VOLL is set as 17,500$/MWh. A lower level of VOLL (denoted by VOLL−) is set as 0.75 times the benchmark value, while a higher level of VOLL (denoted by VOLL+) is set as 1.25 times the benchmark value.
The reliability indices, including LOLE and EENS, are calculated for different scenarios, which are shown in Figure 8. With the benchmark values of VOLL, the EENS in the 10% REG scenario, 20% REG scenario, and 25% REG scenario is 71,841.4 MWh, 88,163.8 MWh, and 98,235.9 MWh, respectively. The LOLE in the three scenarios is 1.40 h/y, 1.65 h/y, and 2.22 h/y, respectively. It can be concluded that system reliability becomes worse in the scenario with a higher proportion of REG. In the 25% REG scenario, the unreliable REG power output increases the load-shedding risk, and it requires additional cost to reduce the risk compared with the 10% REG scenario. Therefore, the tolerance for the ever-greater risk is witnessed in the 25% REG scenario.
The other observation is that enhancing VOLL can remarkably improve the system reliability. A larger value of VOLL means a higher priority on avoiding load shedding. Increasing the value of VOLL by 25%, the EENS in the 10% REG scenario, 20% REG scenario, and 25% REG scenario becomes 57,247.8 MWh, 67,790.8 MWh, and 74,541.4 MWh, respectively, while the LOLE is 1.16 h/y, 1.34 h/y, and 1.91 h/y, respectively. Generally, there is a 20%–25% reduction of EENS and a 16%–20% reduction of LOLE in VOLL+ cases compared with the benchmark. Likewise, there is an obvious increase in both EENS and LOLE indices in VOLL− cases, where the VOLL is set lower than the benchmark.
6 Conclusion
With the aim of promoting the growth of REG and guaranteeing supply adequacy, this paper proposes a reliability-constrained capacity market model. The impacts of devices’ random failures and REG uncertainties on the system reliability are fully considered. The reliability-constrained capacity market model is formulated as a two-level mixed integer linear programming (MILP) problem. Considering the large number of events that occur, the developed MILP model requires significant computing work to obtain precise results. Hence, a series of techniques are proposed to reduce the computational complexity of the capacity market model.
Simulation results demonstrate the necessity of incorporating reliability constraints into the capacity market model. It can effectively restrict the risk of load shedding. The integration of more REG increases the requirements for flexible generating units, such as gas power plants. Moreover, a higher proportion of REG induces increased capacity-related costs while reducing operating costs.
We consider two future research directions. First, the capacity market model should take into consideration demand response and other resources that can provide alternative generation capacity. Second, the other methods should be investigated to further accelerate the solution of the capacity market model. In this manner, the proposed capacity market model can be applied to large-scale systems.
Data availability statement
The original contributions presented in the study are included in the article/Supplementary Material; further inquiries can be directed to the corresponding author.
Author contributions
CZ: writing–original draft. SN: writing–review and editing.
Funding
The authors declare that no financial support was received for the research, authorship, and/or publication of this article.
Conflict of interest
Authors CZ and SN were employed by the Energy Development Research Institute, China Southern Power Grid.
Publisher’s note
All claims expressed in this article are solely those of the authors and do not necessarily represent those of their affiliated organizations, or those of the publisher, the editors, and the reviewers. Any product that may be evaluated in this article, or claim that may be made by its manufacturer, is not guaranteed or endorsed by the publisher.
References
Bhagwat, P. C., de Vries, L. J., and Hobbs, B. F. (2016). Expert survey on capacity markets in the US: lessons for the EU. Util. Policy 38, 11–17. doi:10.1016/j.jup.2015.11.005
Bushnell, J., Flagg, M., and Mansur, E. (2017). Capacity markets at a crossroads, 278. California, United States: Energy Institute at Hass Working Paper.
Cañas-Carretón, M., and Carrión, M. (2020). Generation capacity expansion considering reserve provision by wind power units. IEEE Trans. Power Syst. 35, 4564–4573. doi:10.1109/tpwrs.2020.2994173
Chen, Z., Shang, N., and Zhang, X. (2020). Design of capacity market mechanism with multi-objective regulation. Power Syst. Technol. 45 (01), 198–207. doi:10.13335/j.1000-3673.pst.2020.0585
Costa, L. C. d., Thomé, F. S., Garcia, J. D., and Pereira, M. V. F. (2021). Reliability-constrained power system expansion planning: a stochastic risk-averse optimization approach. IEEE Trans. Power Syst. 36, 97–106. doi:10.1109/tpwrs.2020.3007974
Cramton, P., Ockenfels, A., and Stoft, S. (2013). Capacity market fundamentals. Econ. Energy & Environ. Policy 2, 27–46. doi:10.5547/2160-5890.2.2.2
Cramton, P., and Stoft, S. (2005). A capacity market that makes sense. Electr. J. 18, 43–54. doi:10.1016/j.tej.2005.07.003
Currie, B., Abbey, C., Ault, G., Ballard, J., Conroy, B., Sims, R., et al. (2017). Flexibility is key in New York: new tools and operational solutions for managing distributed energy resources. IEEE Power Energy Mag. 15, 20–29. doi:10.1109/mpe.2017.2660818
Dehghan, S., Amjady, N., and Conejo, A. J. (2016). Reliability-constrained robust power system expansion planning. IEEE Trans. Power Syst. 31, 2383–2392. doi:10.1109/tpwrs.2015.2464274
Fang, X., Hodge, B. M., and Li, F. (2018). “Capacity market model considering flexible resource requirements,” in 2018 IEEE power & energy society general meeting (PESGM), 1–5.
Fang, X., Hu, Q., Bo, R., and Li, F. (2021). Redesigning capacity market to include flexibility via ramp constraints in high-renewable penetrated system. Int. J. Electr. Power & Energy Syst. 128, 106677. doi:10.1016/j.ijepes.2020.106677
Hobbs, B. F., Hu, M. C., Inon, J. G., Stoft, S. E., and Bhavaraju, M. P. (2007). A dynamic analysis of a demand curve-based capacity market proposal: the PJM reliability pricing model. IEEE Trans. Power Syst. 22, 3–14. doi:10.1109/tpwrs.2006.887954
Hu, B., Pan, C., Shao, C., Xie, K., Niu, T., Li, C., et al. (2021). Decision-dependent uncertainty modeling in power system operational reliability evaluations. IEEE Trans. Power Syst. 36, 5708–5721. doi:10.1109/tpwrs.2021.3081765
Jong-Bae, P., Young-Moon, P., Jong-Ryul, W., and Lee, K. Y. (2000). An improved genetic algorithm for generation expansion planning. IEEE Trans. Power Syst. 15, 916–922. doi:10.1109/59.871713
Khezr, P., and Nepal, R. (2021). On the viability of energy-capacity markets under decreasing marginal costs. Energy Econ. 96, 105157. doi:10.1016/j.eneco.2021.105157
Li, Y., Hu, B., Niu, T., Gao, S., Yan, J., Xie, K., et al. (2021). GMM-HMM-Based medium- and long-term multi-wind farm correlated power output time series generation method. IEEE Access 9, 90255–90267. doi:10.1109/access.2021.3091460
Lu, R., Ding, T., Qin, B., Ma, J., Bo, R., and Dong, Z. (2019). Reliability based min–max regret stochastic optimization model for capacity market with renewable energy and practice in China. IEEE Trans. Sustain. Energy 10, 2065–2074. doi:10.1109/tste.2018.2878224
Mertens, T., Bruninx, K., Duerinck, J., and Delarue, E. (2021). Capacity credit of storage in long-term planning models and capacity markets. Electr. Power Syst. Res. 194, 107070. doi:10.1016/j.epsr.2021.107070
Mitra, J., and Nguyen, N. (2022). Grid-scale virtual energy storage to advance renewable energy penetration. IEEE Trans. Industry Appl. 58, 7952–7965. doi:10.1109/tia.2022.3202515
Nan Shang received her M.S. (2019). “Degrees in electrical engineering from Zhejiang University,” in 2019. She is now with the Energy Development Research Institute, China Southern Power Grid. Her research focuses on the energy system reform, electricity market and power system economic dispatch (Hangzhou, China.
PetitetFinonJanssen, M. D. T. (2017). Capacity adequacy in power markets facing energy transition: a comparison of scarcity pricing and capacity mechanism. Energy Policy 103, 30–46. doi:10.1016/j.enpol.2016.12.032
PJM (2023a). PJM manual 18: PJM capacity market rivision:58. [EB/OL]. [2023-11-15]: https://www.pjm.com/∼/media/documents/manuals/m.18.ashx.
PJM (2023b). PJM manual 21: rules and procedures for determination of generating capability. [EB/OL]. [2023-07-26] https://www.pjm.com/∼/media/documents/manuals/m21.ashx.
Rashidaee, S. A., Amraee, T., and Fotuhi-Firuzabad, M. (2018). A linear model for dynamic generation expansion planning considering loss of load probability. IEEE Trans. Power Syst. 33, 6924–6934. doi:10.1109/tpwrs.2018.2850822
Shang, N., Song, Y., Zhang, X., and Lin, Y. (2021). Capacity market mechanism design considering network optimization and energy transition. CSEE J. Power Energy Syst. doi:10.17775/CSEEJPES.2020.02390
Shang, N., Zhang, X., Song, Y., and Zhang, Y. (2021). Design of capacity market mechanism adapting to clean energy development and spot market operation. Automation Electr. Power Syst. 45 (22), 174–182. doi:10.7500/AEPS20200601005
Ssengonzi, J., Johnson, J. X., and DeCarolis, J. F. (2022). An efficient method to estimate renewable energy capacity credit at increasing regional grid penetration levels. Renew. Sustain. Energy Transition 2, 100033. doi:10.1016/j.rset.2022.100033
Subcommittee, P. M. (1979). IEEE reliability test system. IEEE Trans. Power Apparatus Syst. PAS-98, 2047–2054. doi:10.1109/tpas.1979.319398
Sun, J., Liu, J., Chen, H., He, P., Yuan, H., and Yan, Z. (2022). Experiences and lessons learned from DR resources participating in the US and UK capacity markets: mechanisms, status, dilemmas and recommendations. IEEE Access 10, 83851–83868. doi:10.1109/access.2022.3197187
Widuto, A. (2023). Reforming the EU electricity market [EB/OL]. [2023-03-01] https://www.europarl.europa.eu/RegData/etudes/BRIE/2023/739374/EPRS_BRI(2023)739374_EN.pdf.
Yang, J., Dong, Z. Y., Wen, F., Chen, G., and Qiao, Y. (2020). A decentralized distribution market mechanism considering renewable generation units with zero marginal costs. IEEE Trans. Smart Grid 11, 1724–1736. doi:10.1109/tsg.2019.2942616
Yang, X., Gu, C., Yan, X., and Li, F. (2020). Reliability-based probabilistic network pricing with demand uncertainty. IEEE Trans. Power Syst. 35 (5), 3342–3352. doi:10.1109/tpwrs.2020.2976944
Zheng, C. (2004). Strategy Technical Expert of China Southern Power Grid and is currently the Director of Institute of Energy Strategy and Policy. Energy Development Research Institute. He research interests include energy economics, power market modeling and analysis, power system planning and energy low-carbon transition.
Keywords: renewable energy generation, reliability, capacity market, uncertainties, Kriging metamodel
Citation: Zheng C and Nan S (2024) Reliability-constrained capacity market design with high proportions of renewable energies. Front. Energy Res. 11:1335363. doi: 10.3389/fenrg.2023.1335363
Received: 08 November 2023; Accepted: 28 November 2023;
Published: 10 January 2024.
Edited by:
Sheng Wang, University of Macau, ChinaCopyright © 2024 Zheng and Nan. This is an open-access article distributed under the terms of the Creative Commons Attribution License (CC BY). The use, distribution or reproduction in other forums is permitted, provided the original author(s) and the copyright owner(s) are credited and that the original publication in this journal is cited, in accordance with accepted academic practice. No use, distribution or reproduction is permitted which does not comply with these terms.
*Correspondence: Shang Nan, c2hhbmduYW5AY3NnLmNu
 Chen Zheng
 Shang Nan