
94% of researchers rate our articles as excellent or good
Learn more about the work of our research integrity team to safeguard the quality of each article we publish.
Find out more
ORIGINAL RESEARCH article
Front. Energy Res., 29 December 2023
Sec. Sustainable Energy Systems
Volume 11 - 2023 | https://doi.org/10.3389/fenrg.2023.1335184
This article is part of the Research TopicLow-Carbon Oriented Improvement Strategy for Flexibility and Resiliency of Multi-Energy SystemsView all 24 articles
 Xiaolong Xiao1,2*Jiahao Guo1Jinggang Yang1,2Xing Fang1Mingming Shi1
 Yang Liu3
 Maosen Guo2Zhencheng Yang2Zaijun Wu2
Due to the problems such as fuzzy state assessment grading boundaries, the recognition accuracy is low when using traditional fuzzy techniques to grade the switchgear state. To address this problem, this paper proposes a switchgear state assessment and grading method based on deep belief network (DBN) and improved fuzzy C-means clustering (IFCM). Firstly, the switchgear state information data are processed by normalization method; then the feature parameters are extracted from the switchgear state information data by using DBN, and finally the extracted feature parameters are categorised according to the condition of switchgear equipment through clustering using IFCM. The experimental results show that the accuracy of the method in assessing the switchgear state under small sample conditions reaches 94, which exceeds the accuracy of other switchgear state assessment grading methods currently in use.
Switchgear is a critical component in power systems, playing a vital role in the control, protection, and other aspects of line operations. Safe and dependable operation of the power system is dependent on operational condition of switchgear. (Subramaniam et al., 2021; Montanari et al., 2022). The current periodic maintenance approach involves blind inspection and maintenance without knowing the operational status of the switchgear, often leading to the wastage of maintenance resources. Online monitoring and status evaluation of the switchgear are significant for ensuring its normal operation, reducing maintenance frequency, and further bolstering the dependability of the power grid. (Zhong et al., 2015; Wang et al., 2017).
At present, the status assessment of switchgear primarily relies on signals detected from partial discharges, temperature, humidity, voltage, current, etc. Among them, the analysis of partial discharge signals has become a crucial basis for switchgear status assessment (Yumbe et al., 2013; Janssen et al., 2014). Based on this, scholars from both China and abroad have successively proposed classic switchgear status assessment methods such as the Key Gas Method (KGM) (Razi-Kazemi and Niayesh, 2021), IEC Ratio Method (IRM) (Zhou et al., 2023), and Duval Triangle Method (DTM) (Liang et al., 2009). However, these methods are based on knowledge accumulated over a long period and have inherent limitations, making it difficult to guarantee the accuracy of status assessment. As machine learning continues to advance, intelligent techniques such as the Support Vector Machine (SVM) (Zhong et al., 2018), Bayesian Networks (Ding et al., 2014), and Extreme Learning Machine (ELM) (Chang et al., 2013) have been widely applied to switchgear status assessment and have achieved certain diagnostic effects. However, they also have some shortcomings. SVM performs admirably when applied to problems involving small samples; however, its nature restricts it to binary classification, rendering it suboptimal when applied to complex problems involving multiple classes and data, such as switchgear status assessment. (Kim et al., 2019). Bayesian Networks require the satisfaction of many conditional attributes for use, which is not conducive to practical engineering applications (Chen et al., 2020). ELM has fast training speed, but its robustness is poor (Faiz and Soleimani, 2017; Fang et al., 2023), which cannot meet the requirements for long-term stable diagnosis. In addition, the multi-source data collected on-site often lack data labels, restricting the further development of the above methods in switchgear status assessment.
Given these issues, some unsupervised learning methods have been introduced into switchgear status assessment, such as Fuzzy C-means Clustering (FCM) (Dai et al., 2017; Qiu et al., 2022), which can effectively classify unlabeled samples and provide a good interpretation of DGA data (Dehghani et al., 2020). However, due to the presence of local minima in its membership function, the diagnostic accuracy of this method is affected. In order to tackle this issue, LI Enwen and others introduced a method for evaluating the status of switchgear that utilises Improved Fuzzy C-means Clustering (IFCM). (Wang et al., 2015; de Assis et al., 2019), which expand the conventional membership function by incorporating an exponential form. This method effectively solved the local minima problem present in the traditional membership function, resulting in further improvements in diagnostic accuracy compared to FCM. However, this method has difficulties in ensuring the proportion of low-level signals in the distance calculation, affecting the further improvement of diagnostic accuracy (Hinow and Mevissen, 2011). Additionally, both FCM and IFCM base their classifications on the similarity between fault data, without uncovering the differences between different fault types, making it difficult for their diagnostic results to fulfil the requirements of operational engineering applications.
To address the above issues, this paper proposes a switchgear status assessment method based on Deep Belief Network (DBN) and Improved Fuzzy C-means Clustering (DBN-IFCM). By leveraging the DBN’s ability to extract abstract features from data, this method performs feature extraction on the original fault data. While ensuring the retention of important information from each feature, it avoids the loss of small signal features during direct distance calculation. Additionally, the features extracted are more representative of the essence of each fault than the original data. Using these feature data in place of the original data for clustering further improves the accuracy of switchgear status assessment. By establishing Cluster Validity Indicators (CVI) based on a weighted ensemble, which assess the validity of the clustering results, the proposed evaluation method is ultimately validated using actual detection data from a switchgear. By conducting a comparative analysis of the clustering outcomes produced by various algorithms, the evaluation method’s superiority is confirmed.
The process of dividing a set of physical or abstract objects into multiple clusters comprised of similar objects is known as clustering. This process aims to discover the natural groupings of data samples, ensuring high similarity within each cluster while keeping the similarity between different clusters as low as possible. In contrast to the supervised learning process of classification, clustering operates without the need for pre-defined classes or labelled samples. In order to facilitate data comprehension and analysis, clustering assigns similar data points to the same segment according to predetermined criteria. In the sample space R containing various sample points, there is a data set X = {x1, x2, … , xn} consisting of n data points, where xi∈R. The data set X is then divided into several disjoint data sets Cm through a specific method, which can be represented as:
The conventional Fuzzy C-means (FCM) algorithm integrates fuzzy and clustering theories, recognising that equipment states are not binary and that a fuzzy region of similarity exists between various defect states. Fuzzy comprehensive evaluation is a method used to make a reasonable comprehensive evaluation of things that are influenced by multiple attributes or factors. Through fuzzy comprehensive evaluation, a clear conclusion can be derived, reflecting the cat-egory of an object’s attributes at a certain membership level, following the “maximum membership degree” principle. Based on the basic idea of fuzzy criteria, membership relations are used as the partitioning condition, and the maximum membership degree principle is applied to segment samples, transitioning from “non-membership” to “membership” and breaking the restrictions of absolute partitioning. After introducing membership functions, samples no longer belong directly to a specific category, but instead reflect their degree of membership through their membership degrees to each category. This not only allows for the classification of sample information but also provides a more intuitive reflection of the degree of membership of each sample.
The concept underlying the FCM clustering method is outlined in the algorithm. The clustering sample set X = {x1, x2, … , xn} is partitioned into c classes, 2 < c < n, in the sample space R; x1, x2, … , xn denote the clustering samples; n is the number of samples; and the clustering centre matrix is denoted by V=(v1, v2, … , vc)T. The calculation of the objective function of FCM is represented by formula (2):
Where uki represents membership degree correlation among the points in the sample xi (i = 1,2, … ,N) and the clustering center vk, m0 represents the fuzzy index, with the value range [1.5, 2.5], and dki signifies the Euclidean separation between the sample point and xi and each clustering center vk.
The Lagrange multiplier method is employed to minimise the objective function of the FCM algorithm, and defining it as a Lagrangian function with the constraint conditions, the iterative formulas for the membership degree matrix and clustering centers can be finally obtained.
The update formula for membership degree and clustering centre is as follows:
Where dij signifies the Euclidean separation between the sample point and xi and each clustering center vk. When the clustering objective function satisfies the convergence condition, or the algorithm iterates to the maximum number of times required, the clustering ends.
FCM is an effective clustering method; however, the selection of initial centroids has a substantial influence on the clustering results due to the local search-based updates of the clustering centres and membership functions during the iteration process. The utilisation of arbitrary initial centroids facilitates the objective function’s descent into local optimal values, which substantially compromises the precision of state evaluation. FCM is additionally extremely susceptible to anomalies, noise data, and initialization conditions. The utilisation of the Euclidean distance as a distance metric introduces susceptibility to aberrant influence, thereby impeding the attainment of superior classification outcomes.
Therefore, firstly, the idea of point density is introduced. Starting from the perspective of information granularity, the clustering effectiveness function is constructed using the principle of granularity analysis. This function can evaluate the effectiveness of clustering results based on the cohesion and coupling of information granularity. In this function, the density of points around is used to reflect the density of sample distribution, and to determine the degree of influence of sample points on clustering. By using the effectiveness function to evaluate the clustering results, the best clustering results and the most appropriate number of clustering categories can be selected, thereby improving the deficiency of traditional FCM in randomly selecting initial clustering centers. The density function is defined as follows, with respect to each sample point xi:
Where, e signifies the range limit value of the density, satisfying min (dij)<e < max (dij). Based on empirical judgment, selecting the most dense area in dij yields better results. The larger Zi is, the more sample points there are around sample point xi.
The clustering results are immediately influenced by the centre selection in the conventional FCM algorithm, which requires each iteration update to initialise the clustering centre. It becomes challenging to ascertain the optimal number of clustering categories when the selected number fails to correspond with the characteristics of the data distribution. Calculating the utmost number of clustering categories for the sample set is the initial step in resolving this issue. Subsequently, the point density function is employed to determine the point density of each sample point. The initial clustering centres are determined by the function value size of the first points. The optimal number of clustering categories is then determined by comparing the effectiveness function values of clustering results across all clustering category numbers.
In clustering algorithms, the clustering standard of “highest similarity within classes, highest distinction between classes” has always been upheld. This can also be expressed as the distance within the same category being the smallest, and the distance between different categories being the largest. According to this clustering standard, the clustering centers between categories are merged successively, that is, merging the two categories with the smallest distance and closest to each other. Two clustering centres must be measured in order to determine the distance between two categories. By means of several consolidations, one can acquire an additional classification and a clustering hub. This constitutes the fusion procedure:
1) Determine the separation between any two clustering centres using the Euclidean distance formula.
2) Compare the values and merge the clustering centers that are closer than the set merge threshold;
3) Update the clustering center.
The range of clustering category is
The Deep Belief Network is constructed by layering multiple restricted Boltzmann machines (RBMs), upon which it is built. The Boltzmann machine consists of two entirely connected layers, each of which is a two-layer neural network comprising a visible and concealed layer. In Figure 1, the DBN network architecture is illustrated.
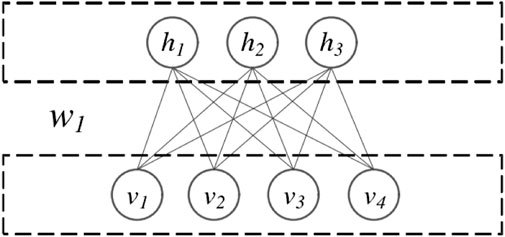
FIGURE 1. DBN network structure.
A complete connection exists between neurons in adjacent layers, but none between neurons in the same layer. This principle is adhered to by every individual neuron. An inherent property of neurons is that their activation conditions are independent of one another; the state of a single neuron will influence other neurons with a specific probability. hj denotes the jth neuron in the hidden layer, which was obtained via the weight matrix from the previous layer RBM. vi signifies the ith visible layer neuron and simultaneously functions as the input to the subsequent RBM. Denoted as follows is the RBM energy function:
Where, ai represents the bias amount of vi in the visible layer, bi represents the bias amount of hi in the visible layer; ωij represents the weight coefficient between the neuron vi in the visible layer and the neuron hj in the hidden layer. And the joint probability distribution function is as follow:
Where, Z is the normalization factor. Consequently, it is possible to express the conditional probabilities of the visible and concealed layers of RBM as:
Where,
Through network training, the model is fitted to the training dataset, so that the output distribution can represent the key features of the samples as much as possible. Therefore, given the training sample X = {x1, x2, … , xn}, the log likelihood function expression of the training dataset is as follows:
The process of network training is illustrated in Figure 2. Unsupervised layer-by-layer training is implemented initially as shown in Figure 2A. The forward propagation technique is employed to efficiently extract state features from the initial sample data in order to diagnose the switchgear equipment. The initial sample data is utilised as the input for the RBM in the first stratum as shown in Figure 2B. The output of each subsequent layer RBM is then utilised as the input for the subsequent layer RBM. By spatially mapping the samples across multiple RBM layers, additional feature information is preserved. The output of the final layer RBM is classified by the BP network, and the weight parameters in the network are subsequently modified via the backward propagation method in multiple iterations as shown in Figure 2C.
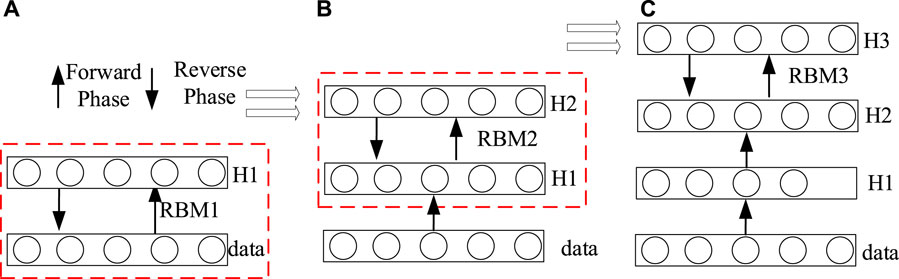
FIGURE 2. Training process of three RBMs in DBN model.
Switchgears in different conditions will inevitably exhibit unique differences in certain characteristic parameters. Some features with significant variations can be directly assessed by humans through visual or auditory means for a preliminary evaluation of the equipment’s health status. However, there is still a substantial amount of feature information in the equipment that cannot be perceived, and the health status judged based on intuitive information is not sufficient, making it difficult to accurately represent the equipment’s condition. Therefore, when using multi-source data for assessment, the selection of characteristic parameters for evaluating the switchgear will greatly affect the results of the equipment state assessment. The state of the switchgear is influenced by multiple characteristic factors, which are interrelated yet diverse, exhibiting different health capabilities under different conditions. When selecting characteristic parameters, it is necessary to ensure that all necessary information is covered while avoiding redundancy and omission of information.
The parameters of the switchgear state mainly come from grid information, cabinet information, power outage test information, live detection information, and online monitoring information. Considering the practical field testing and modeling needs, this paper has selected five types of state quantities as the feature information of the samples based on the existing distribution network equipment state evaluation guidelines, as shown in Table 1.
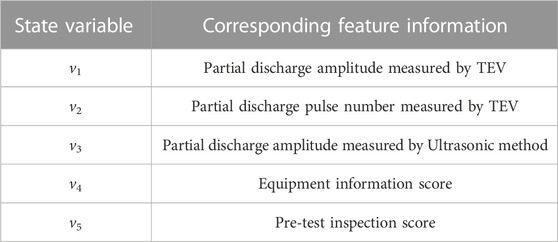
TABLE 1. State quantities and corresponding feature information.
By utilising the existing distribution network equipment state evaluation guidelines and observing the equipment’s health status, it is possible to classify the current health condition of the switchgear into one of five categories: severe, attention, good, or very good. The correspondence between the health status grades and the current operating status of the switchgear is shown in Table 2.
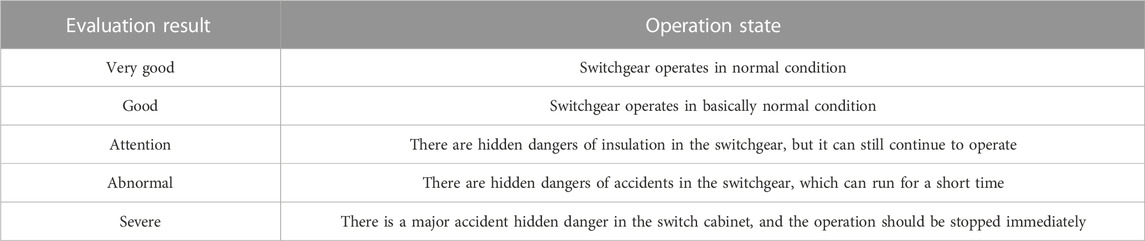
TABLE 2. Switchgear operation state evaluation standards.
Based on the state results and operating status table, and referring to the measured key characteristic parameters of the equipment and routine equipment state analysis, the correspondence between the characteristic parameter values and the equipment state is determined, with reference to relevant technical specifications, as shown in Table 3.
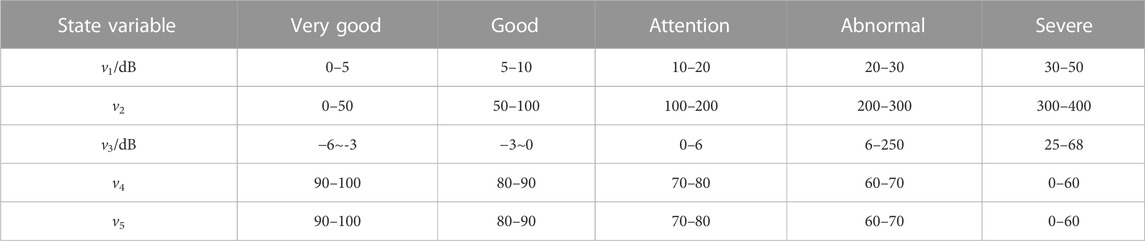
TABLE 3. State quantity evaluation standard range.
Given the significant variations in the numerical ranges of different features, which may lead to the model being overly sensitive to certain features or ignoring others, there is a potential impact on the model’s accuracy and stability. In this paper, the selected features undergo normalization based on their upper and lower limits, converting data of various scales or ranges into a unified standard range. This ensures that all feature values fall between [0, 1], eliminating dimensional differences between data and enabling a fairer comparison and balance of the impact of different features on the model.
The switchgear state analysis process based on DBN feature extraction and improved FCM clustering method is illustrated in Figure 3, with specific steps as follows:
1) Data Preprocessing: Process the collected sample data for data anomalies, divide them into labeled and unlabeled training sets, as well as test sets, and normalize them based on Table 3.
2) DBN Network Training: Use the unlabeled training set for layer-by-layer unsupervised training of the entire DBN network until the number of RBMs equals the preset number of hidden layers. Then, use the labeled samples in conjunction with the BP algorithm to perform classification training on the model after unsupervised training, updating the network’s weight parameters through the backpropagation algorithm.
3) DBN Feature Extracting: Following the completion of training, determine the quantity of nodes to be included in each concealed layer of the DBN and execute feature extraction in accordance with this quantity.
4) Improved FCM Clustering Analysing: Build a multi-source data state detection model, set initial values, and initialize the membership degree matrix; input the extracted features into the improved FCM clustering model; continuously iterate and solve based on the cluster centers and membership degree functions until convergence conditions are met.
5) The belonging State Calculating:Calculate the belonging state of the sample points in the test set based on the above methods, compute the distance to the cluster centers, and determine the sample points’ state of affiliation based on the principle of maximum membership degree.
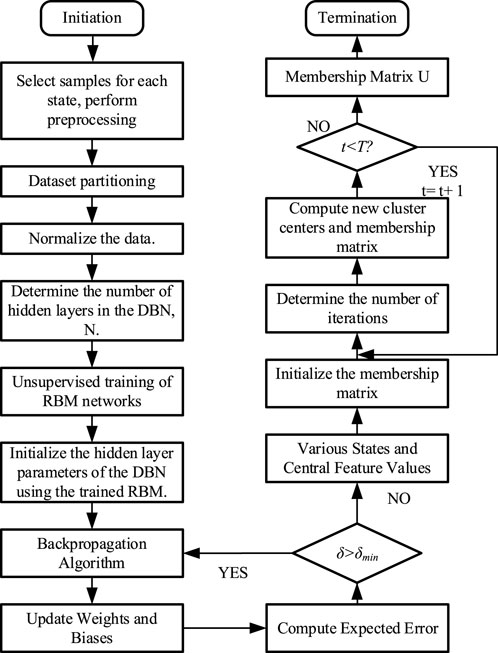
FIGURE 3. Switchgear state analysis process.
To validate the feasibility of the method proposed in this research, we selected a dataset of 44 groups of switchgear live detection data from a 10 kV distribution room. The live detection operation was carried out on 6 May 2022, with an ambient temperature of 25°C and a relative humidity of 53%. The partial discharge detector used was the portable online partial discharge detector produced by Nanjing Zhongda Intelligent Technology Co., Ltd., with the model PDSwitch3.0 and a sampling rate set at 100MSa/s. Switchgear model is HXGN17-12, is a three-phase AC rated voltage 10 kV, rated frequency 50 Hz indoor box-type AC metal-enclosed switchgear. The field experiment is shown in Figure 4.
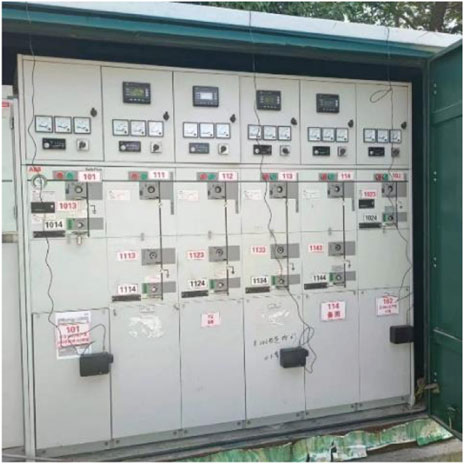
FIGURE 4. Field experiment.
In addition to background noise data, environmental condition data, and operational years of the switchgear, the detection data for each switchgear comprises TEV and ultrasonic data from six detection points on the switchgear. Following the process of denoising and standardising the detection data of the switchgear, a dataset comprising the switchgear’s multi-dimensional features was constructed.
Through data screening, this experiment determined to use 1000 groups of experimental data as the entire experiment’s samples, with 700 training samples (including 200 unlabeled samples and 500 labeled samples) and 300 test samples (all labeled and arranged by different statuses). In these data, the data of TEV amplitude, TEV pulse number, ultrasonic amplitude, equipment information score, and pre-test inspection score obtained from the live test are displayed in Figure 5. To enhance the accuracy of the evaluation results and avoid significant discrepancies between the evaluation results and reality, when the values of different parts of the switchgear differ, the worst value of the important parts of the switchgear is taken as the measurement value of that feature.
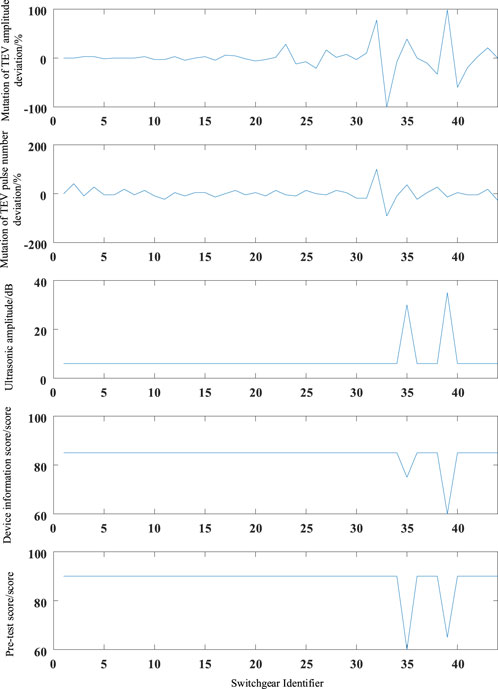
FIGURE 5. Detection data of various parameters for the switchgear in the distribution room.
The number of nodes in each layer of DBN is 5-6-9-10-5, the number of trainings in the unsupervised pre-training phase is 256 and the learning rate is 0.1, the number of trainings in the fine-tuning phase is 64 and the learning rate is 0.05. The specific error curve is shown in Figure 6.
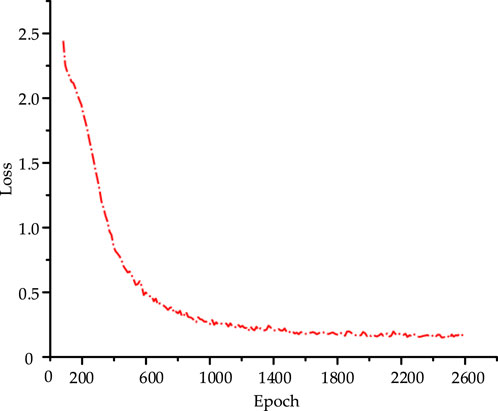
FIGURE 6. Training error curve.
The aggregate training error of the network decreases progressively as the number of training iterations increases, as illustrated in Figure 6. The error drops quickly at the beginning of training, and after the training error reaches 0.2, its rate of decrease gradually slows down. The error meets the requirements after 2000 training iterations. After the training of the DBN was completed, the well-trained DBN network was used to extract features from a test set of 300 samples. Some of the extracted features are shown in Figure 7.
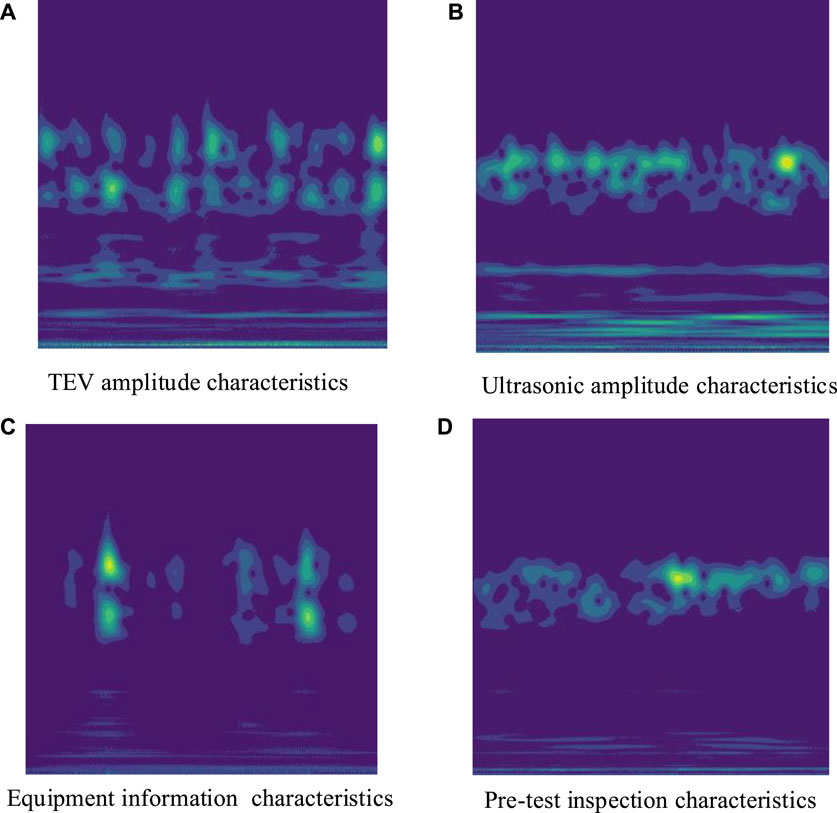
FIGURE 7. TEV, ultrasonic, equipment information and pre-test inspection features extracted by the DBN.
The final features derived by the DBN from a luminance image are displayed in Figure 7. A brightness value that is less than one signifies a value of the matrix near zero, whereas a brightness value that is greater than one signifies a value near one. As shown in Figure 7, the distribution of the same fault across various dimensions is generally consistent, whereas the distributions of distinct faults vary across these dimensions. Different types of faults exhibit distinct distributions, which facilitates the differentiation of switchgear states.
In order to cluster the fault-free data attributes of the daily inspection dataset, the K-means algorithm was implemented. Unknown is the number of clusters utilised in K-means clustering. A subjective artificial setting for the number of clusters devoid of any theoretical foundation is incapable of producing effective clustering outcomes. In order to determine the optimal number of categories, we compute the sum of squared errors and determine the number of clusters in accordance with the actual circumstance. The loss function J (c,u) for the current K value is obtained by summing the squared errors of all clusters:
Where, xi denotes the ith sample, ci signifies the cluster to which xi is assigned, uci signifies the cluster’s centre point, and n signifies the total number of samples.
Commonly used clustering effectiveness analysis often adopts a single internal effectiveness index, which lacks an analysis and research on the characteristics of the switchgear dataset, resulting in certain one-sidedness. Internal effectiveness indexes are sensitive to background noise and are suitable for datasets with clear classifications, evaluating clustering results from aspects such as separability, compactness, and overlapping. However, the switchgear dataset has characteristics like strong adhe-siveness, unclear geometric classification, and vague distribution properties. Using a single internal effectiveness index cannot fully reflect the effectiveness of clustering results. In order to assess the quality of clustering on an unidentified dataset with unknown structure and properties, this study develops the CVI index by weighted integration of four indexes: silhouette coefficient, Davies-Bouldin index, Calinski-Harabasz index, and silhouette coefficient. These indices reflect geometric structural features and take into account the inherent characteristics of the switchgear dataset. The criteria of CVI is defined as:
Where, ωi is the weight of the ith effectiveness index, and fi is the ith effectiveness index. f1 is the silhouette coefficient, an index used to measure the density and dispersion of clustering categories. f2 is the Calinski-Harabasz index, an index used to measure the tightness within categories. Its advantage lies in its simplicity, directness, and fast calculation speed, with a larger value indicating better clustering results. f3 is the Davies-Bouldin Index (DBI), also known as the classification appropriateness index, used to measure the degree of rationality in classification. A smaller DBI value indicates better clustering results. f4 is also the Davies-Bouldin Index.
The switchgear multidimensional feature dataset was classified using the K-means clustering algorithm; the CVI line relationship for various K values is depicted in Figure 8. As shown in Figure 8, the clustering structure effectiveness index indicates that when K = 5, i.e., when the switchgear states are divided into five categories, there is a significant clustering effect.
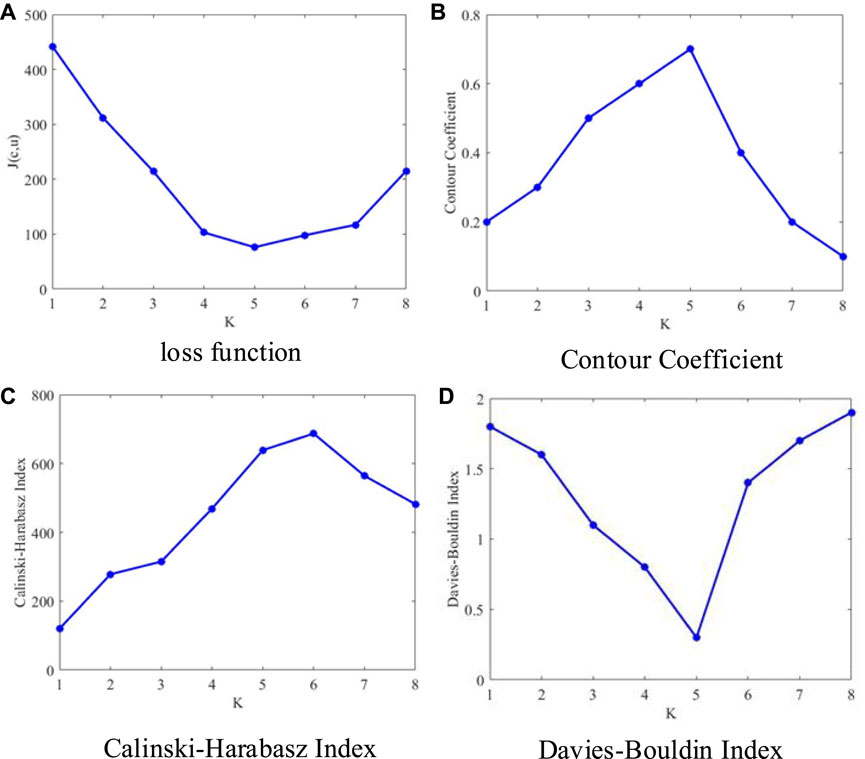
FIGURE 8. Loss function, contour coefficient, calinski-harabasz index and davies-bouldin index under different K values.
At the same time, the clustering results obtained for K = 3, K = 4, and K = 5 were visualized using the t-SNE dimensionality reduction algorithm, as shown in Figure 9. The effect of the clustering procedure proposed in this paper is favourable, as distinct boundaries exist between groupings. Comparing the t-SNE visualizations for K = 3 and K = 4, K = 5 is verified to be the optimal number of categories. When K = 3, it represents that the healthy operating states of the switchgear will be divided into three categories, lacking more detailed classification, making it difficult for maintenance personnel to make good decisions about the switchgear. When K = 4, the number of data labeled “good” is roughly equal to the “general” data, which does not conform to the evaluation results of daily live maintenance, indicating an over-partitioning phenomenon at this time. When K = 5, this scheme clearly and reasonably divides the health status of partial discharge in the live detection of switchgear. The number of switchgears that need immediate inspection and troubleshooting is small, followed by the switchgears that need more attention, while most of the data shows that the switchgears are still operating stably, conforming to the evaluation criteria of general on-site operation and maintenance.
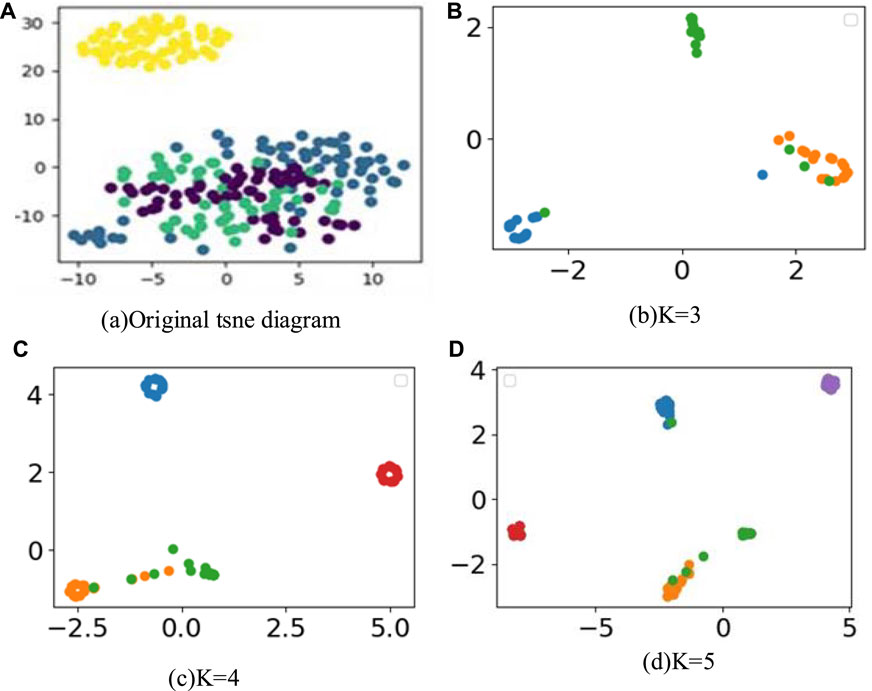
FIGURE 9. Visualization of clustering effect in unclustered as well as different clustering K values.
Using the above fuzzy clustering method, the state of the switchgear in this distribution room was assessed, and the assessment outcomes are illustrated in Figure 10. The abnormality of the state assessment result for switchgear 32 is evident, switchgears 35 and 39 are marked as needing attention, and the assessment results of the other switchgears are all very good. Among them, the TEV amplitude of the live electrical test data of switchgears 35 and 39 was found to be excessively high. Also, the ultra-sonic amplitude of the live electrical test data of switchgear 32 was found to be excessively high. It is evident from the clustering outcomes that the approach suggested in this article aligns with the results of the state evaluation carried out in adherence to the protocols for assessing the condition of distribution network equipment. The health evaluation method suggested in this article has the capability to provide an unbiased reflection of the switchgear’s operational condition. Maintenance strategies for the switchgear’s future operation and upkeep can be devised using the results of the state assessment.
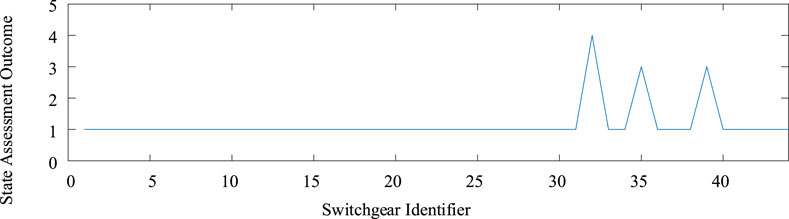
FIGURE 10. State evaluation results of switchgears in the distribution room.
Finally, the state of the switchgear was assessed using the above sample features, and the results were compared with other diagnostic methods, as shown in Table 4. Compared with traditional FCM and IFCM methods, this method has achieved a significant improvement in state assessment accuracy. Compared with traditional FCM and IFCM clustering methods, the accuracy has increased by 36% and 22%, respectively, using the proposed method. Compared with the switchgear state assessment methods of DBN-FCM, DBN-IFCM improves on the membership degree function of FCM, solving the problem of local minima in membership degrees and further enhancing diagnostic performance. Compared with deep learning methods based on DBN and ReLU-DBN, the classification effect of the proposed method is also significantly improved.
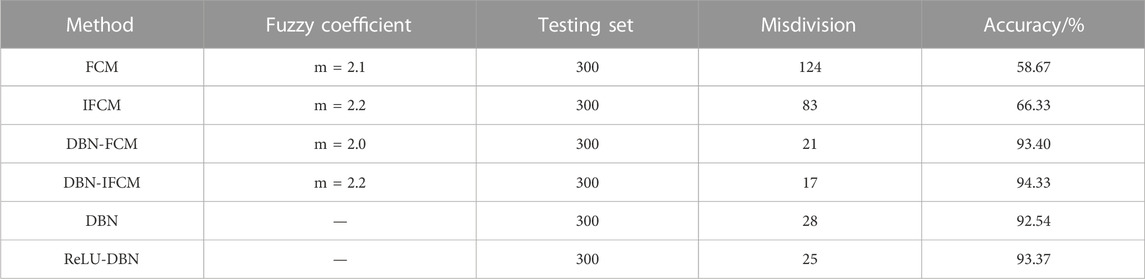
TABLE 4. Assessment accuracy of switchgear with different methods.
From Table 4, it can be seen that the switchgear state assessment method based on deep belief networks and fuzzy clustering proposed in this paper has a good state assessment effect and high assessment accuracy. It solves the problem of lack of depth in feature extraction and insufficient assessment accuracy in traditional state assessment methods, providing a new method for switchgear state assessment and fault diagnosis.
The following discussion focuses on the impact of the signal-to-noise ratio (SNR) on the accuracy of switchgear state assessment. Keeping other parameters constant, we consider scenarios with SNRs of −10dB, -5dB, 0dB, 5dB, and 10 dB. We compare the diagnostic results of four different switchgear state assessment methods under various SNR conditions, as shown in Figure 11.

FIGURE 11. Comparison of relative errors in state assessment at different SNRs.
As shown in Figure 11, at lower SNRs (−10 dB), the diagnostic accuracy and robustness of the switchgear state assessment technique based on DBN are comparatively inferior to those of the other three methods. To address the issue of strong noise interference, this paper utilizes fuzzy clustering, which better interprets the scenarios where the physical boundaries between state gradations are not very clear. Under the condition of an SNR of −10dB, the diagnostic relative error is able to be maintained at 5.65%. The proposed method meets the accuracy requirements for switchgear state assessment under low SNR conditions.
Aiming at the problems of fuzzy boundary delineation and low accuracy of state assessment grading in traditional fuzzy methods for state assessment, the paper proposes a switchgear state assessment framework based on DBN and IFCM (DBN-IFCM). The method uses DBN to extract feature parameters from normalized switchgear condition data, and adopts IFCM c to cluster the extracted feature parameters to appropriately assess switchgear condition. The main conclusions of this paper are as follows:
1) The DBN-IFCM-based switchgear state assessment method is able to accurately classify the state of the switchgear with satisfactory results, and the state assessment classification accuracy rate is up to 94%. Compared with traditional clustering methods such as FCM and IFCM, the accuracy of the proposed method is improved by 36% and 22%, respectively; compared with deep learning methods based on DBN-FCM, DBN and ReLU-DBN, the grading accuracy of the proposed method is improved by 0.9%, 1.8% and 1%, respectively.
2) The switchgear state assessment method based on DBN-IFCM is capable of learning the characteristics of various graded states from a large amount of state data, overcoming the disadvantage of traditional clustering methods that cannot learn autonomously.
3) Compared with other deep neural network switchgear state assessment methods, using fuzzy clustering better explains situations where the physical boundaries between state grades are not very clear. Additionally, this method provides a new perspective for addressing state grading issues when label samples are scarce or label information is difficult to obtain.
The raw data supporting the conclusion of this article will be made available by the authors, without undue reservation.
XX: Conceptualization, Writing–original draft, Software. JG: Data curation, Formal Analysis, Writing–original draft. JY: Investigation, Writing–original draft. XF: Writing–review and editing. MS: Writing–review and editing. YL: Writing–review and editing, Resources. MG: Writing–review and editing. ZY: Writing–review and editing. ZW: Writing–review and editing.
The author(s) declare financial support was received for the research, authorship, and/or publication of this article. This research was funded by the Science and Technology Project of Jiangsu Electric Power Co. Ltd., Grant No. J2021056.
Authors XX, JG, JY, XF, and MS were employed by State Grid Jiangsu Electric Power Company Research Institute. Author YL was employed by State Grid Jiangsu Electric Power Company.
The remaining authors declare that the research was conducted in the absence of any commercial or financial relationships that could be construed as a potential conflict of interest.
The authors declare that this study received funding from the Science and Technology Project of Jiangsu Electric Power Co. Ltd. The funder had the following involvement in the study: The funder was involved in the collection, analysis and interpretation of data, the writing experimental part of the article, and the decision to submit it for publication.
All claims expressed in this article are solely those of the authors and do not necessarily represent those of their affiliated organizations, or those of the publisher, the editors and the reviewers. Any product that may be evaluated in this article, or claim that may be made by its manufacturer, is not guaranteed or endorsed by the publisher.
Chang, W., Li, C., Su, Q., and Ge, Z. (2013). Study on development of partial discharges at the defect caused by a needle damage to a cable joint. Proc. Chin. Soc. Electr. Eng. 33 (7), 192–201. doi:10.13334/j.0258-8013.pcsee.2013.07.026
Chen, P., Ma., T., Xiang, W., Fan, C., Li, C., and Hu, X. (2020). “The switch cabinet status evaluation model based on dynamic evidence theory,” in 2020 2nd International Conference on Power Data Science (ICPDS), Kunming, China, December, 2020, 36–42. doi:10.1109/ICPDS51559.2020.9332519
Dai, J., Song, H., Sheng, G., and Jiang, X. (2017). Dissolved Gas analysis of insulating oil for power transformer fault diagnosis with deep belief network. IEEE Trans. Dielectr. Electr. Insul. 24 (5), 2828–2835. doi:10.1109/TDEI.2017.006727
de Assis, E. M., Costa Lima, G. A., Prestes, A., Marinho, F., and Nagasaki Costa, L. A. (2019). Q-weibull applied to Brazilian hydropower equipment. IEEE Trans. Reliab. 68 (1), 122–132. doi:10.1109/TR.2018.2864550
Dehghani, N. L., Darestani, Y. M., and Shafieezadeh, A. (2020). Optimal life-cycle resilience enhancement of aging power distribution systems: a MINLP-based preventive maintenance planning. IEEE ACCESS 8, 22324–22334. doi:10.1109/ACCESS.2020.2969997
Ding, De., Tang, C., Gao, W., Liu, W., Yao, S., and Zhao, Y. (2014). Frequency attributes and propagation properties of typical partial discharge in GIS. High. Volt. Eng. 40 (10), 3243–3251. doi:10.13336/j.1003-6520.hve.2014.10.042
Faiz, J., and Soleimani, M. (2017). Dissolved Gas analysis evaluation in electric power transformers using conventional methods a review. IEEE Trans. Dielectr. Electr. Insul. 24 (2), 1239–1248. doi:10.1109/TDEI.2017.005959
Fang, M., Huang, R., Lv, T., Liu, C., Ding, X., and Wang, P. (2023). “Research on state assessment method of key equipment in distribution network,” in 2023 8th Asia Conference on Power and Electrical Engineering (ACPEE), Tianjin, China, April, 2023, 2614–2618. doi:10.1109/ACPEE56931.2023.10135928
Hinow, M., and Mevissen, M. (2011). Substation maintenance strategy adaptation for life-cycle cost reduction using genetic algorithm. IEEE Trans. Power Deliv. 26 (1), 197–204. doi:10.1109/TPWRD.2010.2065247
Janssen, A., Makareinis, D., and Solver, C.-E. (2014). International surveys on circuit-breaker reliability data for substation and system studies. IEEE Trans. Power Deliv. 29 (2), 808–814. doi:10.1109/TPWRD.2013.2274750
Kim, Y., Kweon, D., Park, T., Kim, S., and Lim, J. S. (2019). Classification of fault and failure types determined by dissolved Gas analysis for transformers. J. Electr. Eng. Technol. 14, 1665–1674. doi:10.1007/s42835-019-00175-0
Liang, J., Wang, Z., and Liu, X. (2009). State estimation for coupled uncertain stochastic networks with missing measurements and time-varying delays: the discrete-time case. IEEE Trans. Neural Netw. 20 (5), 781–793. doi:10.1109/TNN.2009.2013240
Montanari, G. C., Ghosh, R., Cirioni, L., Galvagno, G., and Mastroeni, S. (2022). Partial discharge monitoring of medium voltage switchgears: self-condition assessment using an embedded bushing sensor. IEEE Trans. Power Deliv. 37 (1), 85–92. doi:10.1109/TPWRD.2021.3053658
Qiu, J., Liang, Y., Cheng, X., Zhao, X., and Ma, L. (2022). “State assessment of key equipment of microgrid based on multi-source data fusion method,” in 2022 10th Joint International Information Technology and Artificial Intelligence Conference (ITAIC), Chongqing, China, June, 2022, 710–714. doi:10.1109/ITAIC54216.2022.9836941
Razi-Kazemi, A. A., and Niayesh, K. (2021). Condition monitoring of high voltage circuit breakers: past to future. IEEE Trans. Power Deliv. 36 (2), 740–750. doi:10.1109/TPWRD.2020.2991234
Subramaniam, A., Sahoo, A., Manohar, S. S., Raman, S. J., and Panda, S. K. (2021). Switchgear condition assessment and lifecycle management: standards, failure statistics, condition assessment, partial discharge analysis, maintenance approaches, and future trends. IEEE Electr. Insul. Mag. 37 (3), 27–41. doi:10.1109/MEI.2021.9399911
Wang, C., Hou, Y., Qin, Z., Peng, C., and Zhou, H. (2015). Dynamic coordinated condition-based maintenance for multiple components with external conditions. IEEE Trans. Power Deliv. 30 (5), 2362–2370. doi:10.1109/TPWRD.2015.2442291
Wang, Y. B., Chang, D. G., Fan, Y. H., Zhang, G. J., Zhan, J. Y., Shao, X. J., et al. (2017). Acoustic localization of partial discharge sources in power transformers using a particle-swarm-optimization-route-searching algorithm. IEEE Trans. Dielectr. Electr. Insul. 24 (6), 3647–3656. doi:10.1109/TDEI.2017.006857
Yumbe, Y., Hasegawa, T., and Furukawa, N. (2013). Optimization method for inspection scheduling of power distribution facilities. IEEE Trans. Power Deliv. 28 (3), 1558–1565. doi:10.1109/TPWRD.2013.2253806
Zhong, J., Li, W., Billinton, R., and Yu, J. (2015). Incorporating a condition monitoring based aging failure model of a circuit breaker in substation reliability assessment. IEEE Trans. Power Syst. 30 (6), 3407–3415. doi:10.1109/TPWRS.2014.2387334
Zhong, J., Li, W., Wang, C., and Yu, J. (2018). A RankBoost-Based data-driven method to determine maintenance priority of circuit breakers. IEEE Trans. Power Deliv. 33 (3), 1044–1053. doi:10.1109/TPWRD.2017.2748146
Keywords: deep belief networks, partial discharge, improved fuzzy c-means clustering, multisource data fusion, switchgear state assessment
Citation: Xiao X, Guo J, Yang J, Fang X, Shi M, Liu Y, Guo M, Yang Z and Wu Z (2023) A novel switchgear state assessment framework based on improved fuzzy C-means clustering method with deep belief network. Front. Energy Res. 11:1335184. doi: 10.3389/fenrg.2023.1335184
Received: 08 November 2023; Accepted: 13 December 2023;
Published: 29 December 2023.
Edited by:
Rufeng Zhang, Northeast Electric Power University, ChinaReviewed by:
Junjun Xu, Nanjing University of Posts and Telecommunications, ChinaCopyright © 2023 Xiao, Guo, Yang, Fang, Shi, Liu, Guo, Yang and Wu. This is an open-access article distributed under the terms of the Creative Commons Attribution License (CC BY). The use, distribution or reproduction in other forums is permitted, provided the original author(s) and the copyright owner(s) are credited and that the original publication in this journal is cited, in accordance with accepted academic practice. No use, distribution or reproduction is permitted which does not comply with these terms.
*Correspondence: Xiaolong Xiao, eGlhb3hpYW9sb25nQHNldS5lZHUuY24=
Disclaimer: All claims expressed in this article are solely those of the authors and do not necessarily represent those of their affiliated organizations, or those of the publisher, the editors and the reviewers. Any product that may be evaluated in this article or claim that may be made by its manufacturer is not guaranteed or endorsed by the publisher.
Research integrity at Frontiers
Learn more about the work of our research integrity team to safeguard the quality of each article we publish.