 Chunhe Jia1
 Xiangyu Chen
 Botao Huang
- 1Baishan Power Supply Co., State Grid Jilin Electric Power Co., Ltd., Baishan, China
- 2Northeast Electric Power University, Jilin, China
- 3Changchun University of Technology, Changchun, China
The application of SOP instead of traditional tie line switches in distribution networks can im-prove the controllability, flexibility, and renewable energy accommodation of the distribution grids. Compared with traditional tie line switches, SOP have high costs and large land occupation. When power transfer is not considered, the location and capacity of SOP can be optimized through planning algorithms to reduce the overall costs. However, the main function of tie line switches is power transfer. If SOP as alternative devices do not meet this requirement, their ex-tensive application will be restricted. Therefore, this paper designs the direct current volt-age-power smooth switching control strategy, phase angle pre-synchronization control strategy, and voltage support control strategy based on the parallel structure of SOP and tie line switches to ensure stable operation during the power transfer process, through this complete control strategy, smooth switching can be achieved to keep the DC voltage stable during the switching process, effectively suppress the impulse current and maximize the utilization of SOP capacity Simulations on the SIMULINK plat-form verify the feasibility of the control strategies.
1 Introduction
In recent years, in order to realize the adjustment of energy structure, great efforts have been made to vigorously develop new energy sources such as wind power and photovoltaics, which has become a national energy development strategy (Yan et al., 2022). It is predicted that by 2030, the installed capacity of new energy power generation will account for more than 50% of the total installed capacity of power generation, which will lead to large-scale grid connection of new energy power generation in distribution networks. At the same time, new types of loads such as electric vehicles and energy storage power stations have also begun to connect to the grid. The grid connection of these new types of distributed power sources and loads will bring great challenges to the safe and stable operation of distribution networks (Chengshan et al., 2022).
First of all, there are problems on the power source side. Photovoltaic power generation fluctuates greatly under the influence of weather, and wind power generation is also unstable under the influence of wind speed. Their large-scale access will cause great fluctuations in system power. The fluctuation on the power source side affects adjacent lines through the power exchange between feeders, causing voltage and frequency to surge greatly, posing a threat to system stability (Long et al., 2016). On the other hand, electric vehicles, energy storage power stations and other new types of loads highlight the uncertainty on the load side. Large-scale access of new loads makes the load curve present new stochastic characteristics, increasing the difficulty of load forecasting. Due to the concentrated access of new loads, unbalanced load distribution is formed between different feeders (Qi et al., 2017).
The overlay of uncertainties on both the power source side and load side leads to more frequent and violent power exchange between feeders. This also brings two major problems. First, as the frequency of power exchange increases, the switching frequency of interlocking switches will also increase, greatly reducing the service life of interlocking switches. Second, when interlocking switches transmit large power, huge inrush currents will be generated without buffering measures, endangering the safety of interlocking switches and even the entire power system. In the past few years, thanks to the continuous development of power electronics technology, intelligent soft switches can be applied in distribution networks. As a new type of intelligent terminal equipment, the intelligent soft switch has the unique function of achieving flexible closed-loop interconnection between feeders, and has attracted much attention. Compared with the traditional interlocking switch which can only be fixed open or closed, the intelligent soft switch can gradually adjust the power sharing between feeders and achieve more flexible network reconfiguration for peak clipping and valley filling, easing the pressure on a single feeder. This is very important in dealing with the challenges brought by large-scale new energy access. However, if intelligent soft switches are used to meet the large-capacity power transfer between feeders, the capacity requirements will be high, and the investment and operating costs will also be large, making it difficult to replace interlocking switches in a short time. Considering the advantage of interlocking switches in carrying large-capacity power transmission, the two should be used as complementary technologies to give full play to their respective technical strengths (Cao et al., 2016). One feasible idea is to use intelligent soft switches and interlocking switches in parallel in the distribution network, with the latter meeting the demand for large-capacity power transfer, and the former achieving flexible interconnection between feeders. This not only makes full use of the technical advantages of both, but also facilitates the large-scale application of intelligent soft switches.
In order to use the SOP in parallel with the interlocking switch for auxiliary loop closing or flexible interconnection, a complete control strategy is needed to ensure normal operation of the device. Document (Chengshan et al., 2016)takes SOP as the research object, interconnects two AC systems using SOP, models and analyzes it in the dq coordinate system, and completes the power exchange between the two systems with dual closed-loop control strategy. Document (Qunhai et al., 2018)proposes a composite control of SOP, with the converters on both sides of the SOP participating in the control of the DC bus voltage, which can realize independent adjustment of active power and reactive power compensation simultaneously. Document (Cong et al., 2020)proposes a DC voltage control strategy based on improved linear expansion state observer, which improves the dynamic response and anti-disturbance ability of DC voltage compared with the traditional linear expansion state observer. Document (Guorong et al., 2019)proposes a steady-state model with AC voltage amplitude and phase as control objectives, active and reactive power as controlled objectives, and uses the control of fundamental amplitude and phase to indirectly control the grid-side current, i.e., indirect current control method. Document (Guorong et al., 2020)proposes a flexible multi-state switch smooth switching control method for grid connection and disconnection, which can reduce voltage and current shocks compared with traditional hard switching. However, this method only considers AC grid faults on the PQ side converter.
Nowadays, there are many other control strategies for SOP, such as predictive integral resonant control, which combines model predictive control and PIR control to solve the problem of periodic interference caused by dead zone effect and current sampling error in the system, the output voltage control of the boost converter is designed based on the repetition scheme of delayed positive feedback plus feedforward path, and a fractional delay variable frequency repetition control for torque control is proposed by combining the phase Angle repetition controller and the beat free current control. Based on the above analysis, most literature focuses on improving the control strategy of SOP under separate operation mode, which is not enough to support the control of the parallel structure of SOP and tie switch. Therefore, based on the parallel structure of SOP and interlocking switch, this paper designs a series of control strategies to enable the parallel structure to have smooth switching between control strategies and voltage support capability under power failure conditions.
2 Topological structure and mathematical model of SOP
2.1 The topological structure of SOP
SOP is a back-to-back topology composed of two voltage source converters (VSCs), VSC1 and VSC2, which consist of high-power fully controllable power electronic devices IGBTs, connected in parallel through a DC capacitor C.
SOP is often used to replace tie switches to connect two feeders. When tie switches in the distribution network are replaced by SOP, accurate power control and flexible power exchange can be achieved through appropriate control strategies.
2.2 The mathematical model of SOP
The AC-side mathematical model of the SOP converter is time-varying AC quantities in the abc coordinate system. If controlled in this state, it will affect the state tracking speed and error of the control system, and the control design is complex. To simplify the control system and ensure fast and precise control, the time-varying AC quantities can be transformed into DC components in the synchronously rotating dq coordinate system, realizing decoupling between variables. The specific steps are divided into two parts: First, the abc coordinate system is transformed into the two-phase stationary αβ coordinate system through Clark transformation. Second, the coordinate system is transformed into the dq coordinate system through Park transformation (Husam and Spyros, 2022).
According to the transformation matrix, the mathematical model of the SOP system can be transformed into the dq coordinate system:
2.3 The fundamental control strategies of SOP
2.3.1 Current inner loop control
Due to the flexibility of the SOP device, which enables bidirectional power ex-change capabilities, the VSCs on both sides can switch operation modes, transitioning between rectification and inversion. Therefore, a dual closed-loop control strategy is selected to control the system (Xiaodong et al., 2021; Chengwei et al., 2022).
First, the inner loop needs a decoupled design for PQ (Dejan and Predrag, 2021). Expanding the mathematical model of VSC1 in the dq coordinate system yields (Chengwei et al., 2020):
At this point, it can be seen that initially the d-axis and q-axis are coupled to each other. However, in the mathematical model, the terms V1d and V1q can be designed. Therefore, the coupling terms and grid disturbance terms can be added to V1d and V1q respectively to counteract:
At this point, from Equation 6 it can be seen that the obtained new model achieves decoupled control of PQ, which enables separated control of active and reactive power output.
2.3.2 Active power control
For the inner loop control strategy to function properly, it requires reference inputs for the d-axis and q-axis. The role of the outer loop control strategy is to convert the input power or DC voltage references into current references. Based on the control method, it can be divided into constant power control and constant DC voltage control.
The SOP can implement inter-port power flow control. The outer power control loop determines the AC and circulating current references for the inner loop based on the active power p* and reactive power q* references of the converter output. The control block diagram is shown in Figure 1.
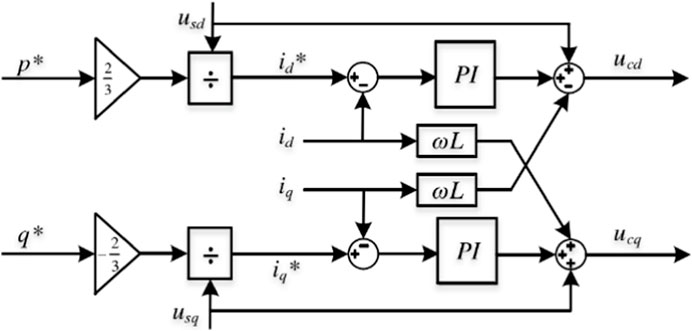
FIGURE 1. Constant power control block diagram.
2.3.3 DC voltage control
For normal operation of the SOP, the DC voltage needs to be kept constant. Therefore, during actual operation, one side of the SOP always needs to maintain constant DC voltage control. Also, in case of a fault, this control strategy needs to be im-mediately transferred to the non-fault side. The control block diagram is shown in Figure 2.
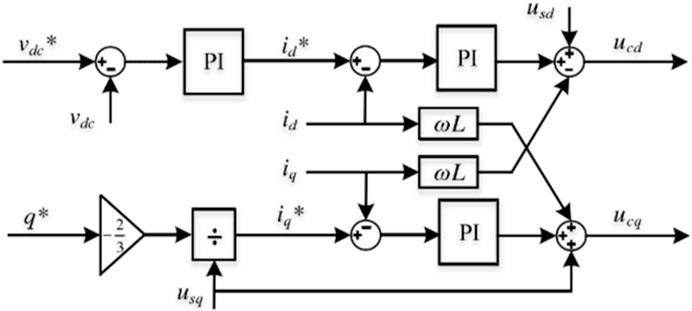
FIGURE 2. Constant DC voltage control block diagram.
3 Analysis of inrush current during loop closing
As shown in Figure 3, r represents the rectification side of the SOP system, and i represents the inversion side.
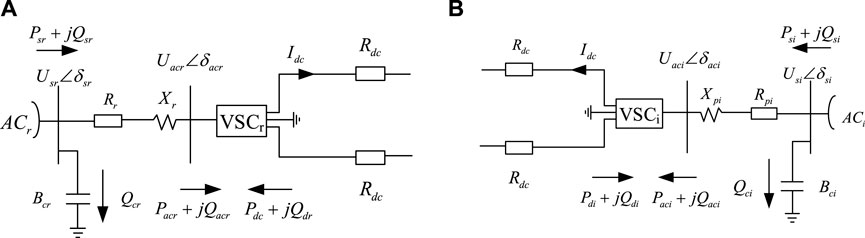
FIGURE 3. (A) Rectifier side; (B) inverter side.
Based on different control systems, the SOP converter node can operate with PV node characteristics, such as rectification side constant power control - inverter side constant voltage control; it can also operate with PQ node characteristics, such as rectification side constant power control—inverter side constant reactive power control. Regardless of which node characteristic state it operates in, the power characteristics of the converter station, while satisfying the power flow equation constraints, will also be constrained by the value range of its own state variables, which can be expressed mathematically as:
Here, the state variable x mainly includes the bus voltages and their angles, active and reactive powers at both ends of the SOP, and DC current or DC voltage, as shown in Figure 4.
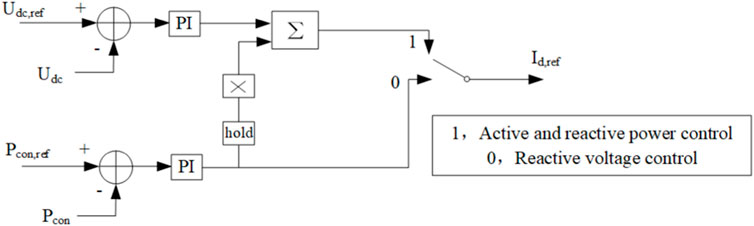
FIGURE 4. Smooth transition control block diagram between DC voltage control and power control.
The power injected from the AC system into the SOP system, i.e., the power flow equation for the common node between the AC network and the SOP system is:
Based on this power flow equation, the power injected into the SOP converter can be obtained as:
Based on the assumption that converter active power losses are neglected, the following equation exists at the AC-DC interface of the SOP system:
For the DC line, the following power balance relationship can be established:
Simplifying gives
The formula for the loop closure impact current of the tie switch can be derived as:
It can be seen from Equation 9 that under the premise that the parameters are determined, the value on the numerator is constant. So as long as it is proved that the voltage difference between the two sides when SOP is present is less than that when SOP is not present, the conclusion can be obtained.
4 Improved control strategy for SOP
The power supply transfer involves three main improved control strategies: 1) Smooth transition control strategy of DC voltage-power control. 2) Phase angle pre-synchronization control strategy. 3) Voltage support control strategy.
When the monitored voltage per unit value at the load drops below 0.9, since one side of the SOP must be ensured to have DC voltage control and be operating normally, first it is determined whether the voltage drop node corresponds to the DC voltage control side. If voltage drop is detected on the DC voltage control side, then the normally operating active power control side is switched to DC voltage control. Otherwise, no switching is required. Then, a series of voltage support controls are activated, followed by smooth phase pre-synchronization control. Finally, the tie switch is closed, and the SOP output is set to 0. The specific control process is shown in Figure 5.

FIGURE 5. Overall control flow chart.
4.1 Smooth switching control strategy between DC voltage control and power control
DC voltage control side converter is the key to ensure the stable operation of SOP. When the power grid fails on the DC voltage control side, it must be switched to the non-fault side. However, in this switching process, the direct switch inevitably causes a sudden change in the current of the q axis and the d axis, thus affecting the stability of the DC voltage, which is not desirable. In order to solve this problem, the smooth switching control strategy is adopted in this paper. The smooth switching control policy records the current reference value output by the active power control module at the switching moment. This reference value is the sum of the output current reference value of the DC voltage control module after resetting the PI controller. In this process, a weight ratio is assigned to the reference value recorded instantaneously, and gradually decreases from 1 to 0, which realizes the smooth switching of control strategies. In this way, the sudden change of q and d axis current caused by the switching process is successfully reduced, and the stability of DC voltage is improved.
4.2 Phase angle pre-synchronization control strategy
After the distribution line circuit breaker is tripped and before the tie switch is closed, the SOP needs to provide voltage and frequency support to the blackout area. To stabilize the frequency and adjust the voltage phase of the SOP port on the fault feeder side, a smooth voltage phase pre-synchronization control is set. Taking the VSC1 side as an example to introduce this control strategy, when this side is operating normally, the selector chooses position 1, and the PLL outputs the phase θ1 normally. When voltage sag occurs, the selector chooses position 0. At this time, the input of the PI controller is the difference between the angle obtained by the PLL on the voltage sag side and the angle of the PLL on the normal operation side. By summing the PI controller output with the original output angle, the phase can be adjusted. The specific control block diagram is shown in Figure 6.

FIGURE 6. Phase angle pre-synchronization control strategy block diagram.
4.3 Voltage support control strategy
The specific control block diagram of the voltage support control strategy is shown in Figure 7. Under the voltage support control, the capacity of the SOP should be used as much as possible to restore the voltage, and then the active power is provided to the load to the maximum extent within the capacity range of the SOP. After activating the voltage support control, the SOP starts transmitting power from 0 until its capacity limit. During this process, the voltage at the voltage sag node is monitored continuously. According to the monitoring results, there can be two cases. First, the first case is introduced where the voltage value at the node still does not reach 0.9 p.u. until the SOP capacity limit. The premise of this case is that the planned SOP capacity is small and the maximum reactive power output will not lead to overvoltage. At this time, the power reference value can be obtained from Equation 16.
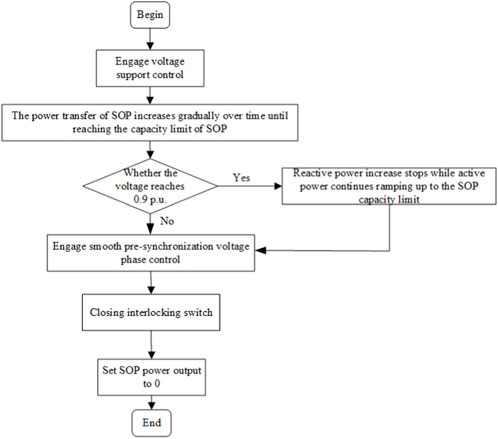
FIGURE 7. Voltage support control strategy flowchart.
In the equation: QSOP.max is the reactive power capacity upper limit specified for the SOP, tF is the fault time, tZ is the time used for power supply transfer, C is a time constant that varies with changes in tZ, T is the unit time.
Case 1 assumes a small planned SOP capacity, where the output at maximum reactive power capacity of the SOP will not exceed 0.9 p.u. However, exceeding 0.9 p.u. may actually occur in practice. In such cases where the voltage level already meets the requirements, active power can be transmitted as much as possible. The power reference value at this time can be obtained from Equation 8.
In the equation: tstop is the time when the voltage per unit reaches 0.9, i.e., the time when reactive power stops increasing.
5 Numerical example analysis
To verify the correctness of the power supply transfer strategy and control strategy mentioned in this paper, a model was built using the SIMULINK simulation platform according to Figure 8. In the 33-node distribution system shown in Figure 8, the SOP device with auxiliary hybrid DC circuit is connected in parallel with the tie switch be-tween node 18 and node 33. In the simulation, voltage sag is set at node 18. According to the extent of voltage drop, it corresponds to case 1 and case 2 of the voltage support control strategy, respectively.
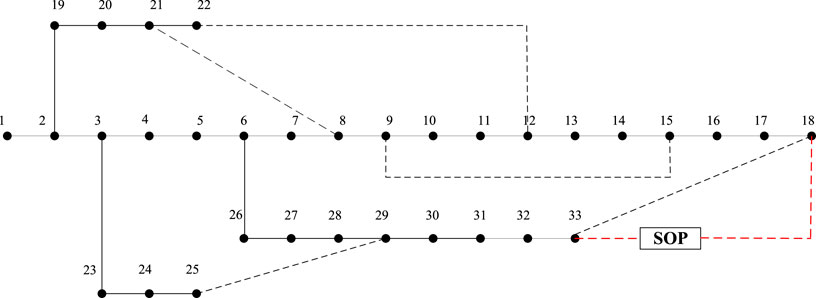
FIGURE 8. IEEE 33-node test system diagram.
5.1 Smooth switching control strategy
5.1.1 Smooth transition control between DC voltage control and power control
Under the initial system conditions, VSC1 side is under active power-reactive power control, and VSC2 side is under DC voltage-reactive power control for normal system operation. It is set that voltage sag occurs on the VSC2 side at 1s. The system determines that the VSC2 side loses DC voltage control capability, and the normally operating VSC1 side needs to be switched to DC voltage-reactive power control to ensure normal operation of the intelligent soft switch. When the fault occurs, direct switching control strategy and smooth switching control strategy are used to switch the system control strategy, respectively. The specific DC voltage waveforms are shown in Figure 9.
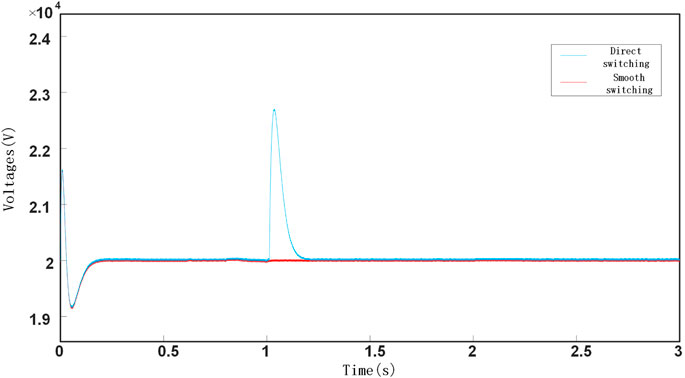
FIGURE 9. DC voltage waveform.
It can be seen that when using the direct switching control strategy, the DC voltage fluctuates greatly and only returns to normal after 0.2s (Figure 10). When using the smooth switching control strategy proposed in this paper, the DC voltage only has slight fluctuations within 0.1s, and the maximum fluctuation does not exceed 0.05%. Therefore, the method proposed in this paper can achieve smooth switching of the control strategies between the VSC1 and VSC2 sides.
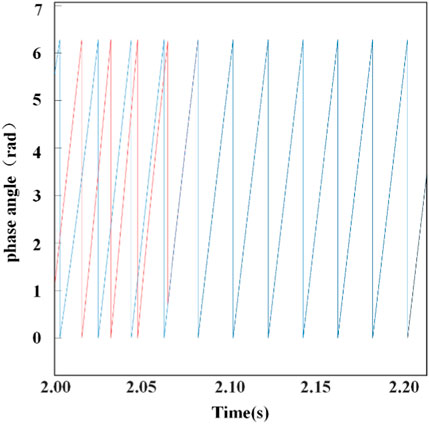
FIGURE 10. Phase angle across the tie switch.
5.1.2 Smooth voltage phase pre-synchronization control
After the voltage sag, the system voltage phase starts to deviate, and the degree of deviation depends on the severity of the fault. Before closing, it will detect whether the phase deviation at both ends is less than the preset value, as shown in Figure 11. At 2s, it is detected that the phase deviation on both sides is greater than the preset value, and the voltage phase smooth pre-synchronization control is started to adjust the phase deviation to be less than the preset value within 5 cycles, after which a signal is issued to close the tie switch.
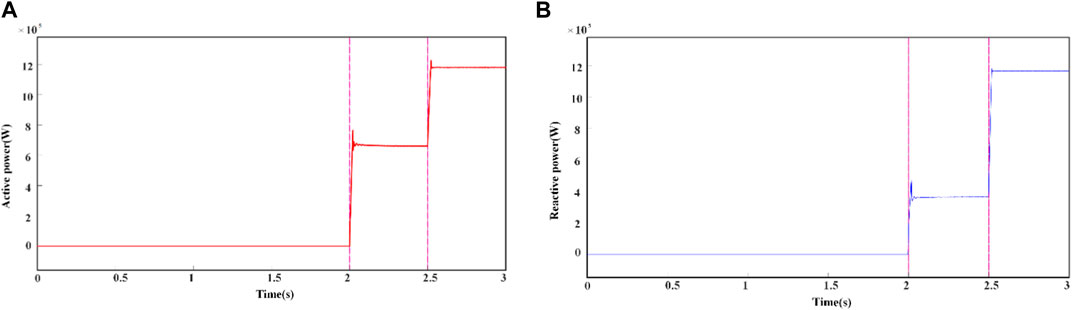
FIGURE 11. (A) Transmission of active power through tie switch; (B) transmission of reactive power through tie switch.
5.2 Voltage support control strategy
Under the initial system state, VSC1 side is under active power-reactive power control, and VSC2 side is under DC voltage-reactive power control for normal system operation. At 1s, the system detects voltage sag on the VSC2 side. The SOP starts to transfer power from VSC1 side to VSC2 side. Based on the voltage value during the voltage recovery process, there can be two cases:
5.2.1 Voltage did not reach 0.9 per unit during restoration process
At 1s, the control system detects the voltage sag. The active power and reactive power start to increase, as shown in Figure 12. In the time period from 1s to 1.5s, the active power and reactive power gradually increase at a certain ratio until their capacity upper limit. At 2s, due to the closing of the contact switch, the power transmitted by SOP is affected and fluctuates to a certain extent. At 2.5 s, SOP exits operation and the transmitted power returns to zero.
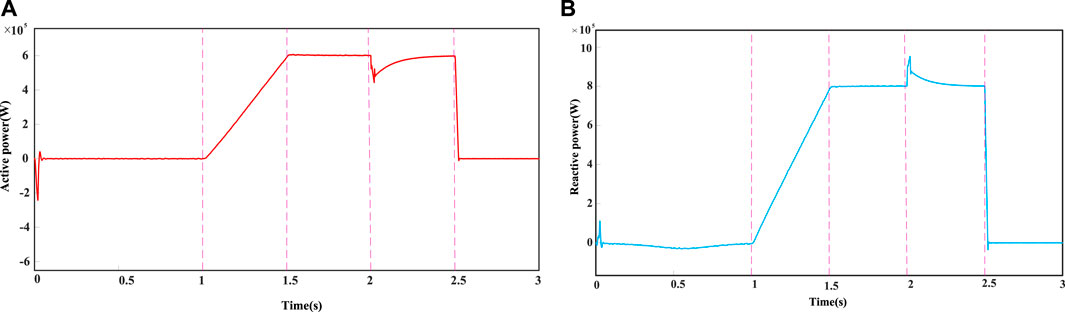
FIGURE 12. (A) Transmission of active power through SOP; (B) transmission of reactive power through SOP.
As can be seen from Figure 13, until the power transfer is completed at 1.5 s, the per unit value of the load voltage still does not reach 0.9, which proves that even if the re-active power is fully delivered, the load voltage cannot be raised to normal levels. Ac-cording to the principle of using the limited SOP capacity for voltage recovery, in this case, the reactive power will naturally not be reduced to increase the active power. Therefore, the control strategy does not change between 1s and 1.5 s.
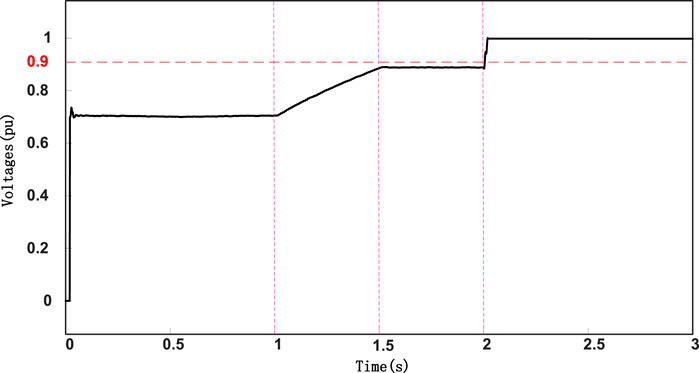
FIGURE 13. Voltage waveform at the load.
At 2s, the SOP operation is completed and the tie switch is closed. As can be seen from the figure, at the moment of tie switch closure, the remaining part of the power is transferred. The amount of power transferred is smaller than before the SOP operation. At 2.5 s, the SOP exits operation, and the part of power originally transferred by the SOP is again transferred through the tie switch, thereby achieving staged power transfer.
5.2.2 Voltage reached 0.9 per unit during restoration process
As shown in Figure 14, at 1.27 s, the per unit value of the voltage reaches 0.9, and the voltage is raised to normal levels. According to the principle that the SOP capacity is prioritized for recovery, when the voltage reaches normal levels, the remaining capacity will be used to transfer active power. As shown in Figure 15, the reactive power stops increasing at this point, while the active power grows faster until the SOP capacity upper limit.
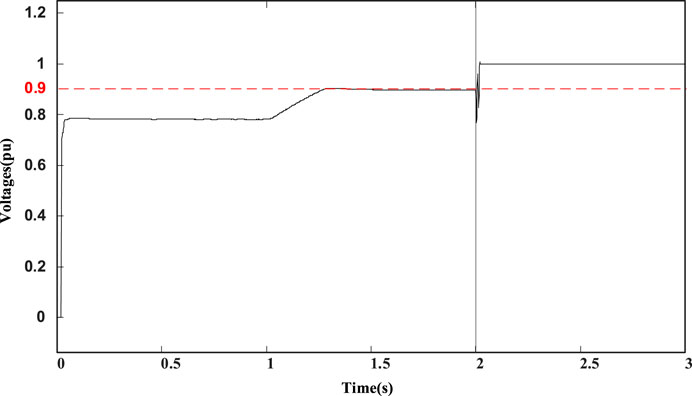
FIGURE 14. Voltage waveform at the load.
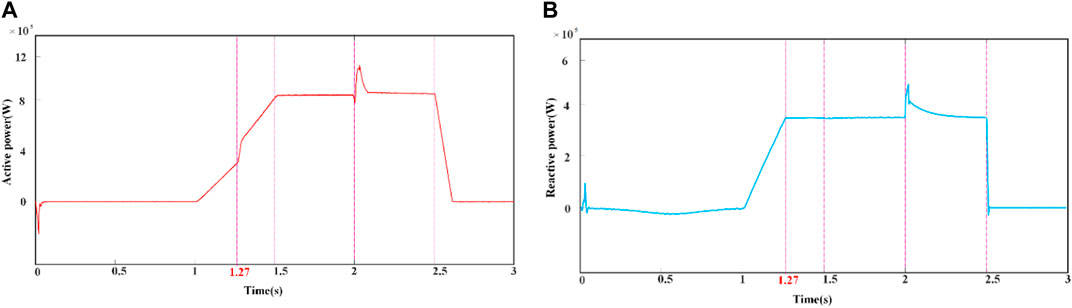
FIGURE 15. (A) Transmission of active power through SOP; (B) transmission of reactive power through SOP.
6 Conclusion
A complete control strategy is designed for the parallel structure of SOP and tie switch. The simulation results show that on one hand, this control strategy can first achieve smooth switching between different control strategies, which is especially reflected in the switching between DC voltage control and power control. The impact on the DC current during the switching process is significantly suppressed. In addition, it is also reflected in the phase calibration before closing the loop, which can adjust the phases on both sides to the required range within 5 cycles. On the other hand, under this control strategy, based on the principle that the transmitted power is primarily used to support the voltage, the SOP capacity can be utilized as much as possible to reduce the impact during loop closing. In summary, the proposed control strategy achieves smooth transition between different control modes and coordinated operation of SOP and tie switch to maximize SOP capacity while minimizing impact during loop closing. In conclusion, the proposed control strategy can firstly achieve smooth switching when switching between different control modes. During the switching process, DC voltage remains stable, and SOP delivers power stably to track reference values. Secondly, part of power is transferred first through SOP, and then the other part is transferred through the tie, which can effectively suppress impulse current and extend service life. Finally, the control strategy can maximize the utilization of SOP capacity and transfer as much active power as possible under the premise of ensuring that the voltage meets the requirements. The simulation verifies its effectiveness.
Data availability statement
The original contributions presented in the study are included in the article/Supplementary material, further inquiries can be directed to the corresponding author.
Author contributions
CJ: Conceptualization, Investigation, Software, Writing–review and editing. XC: Data curation, Writing–original draft. CY: Methodology, Writing–review and editing. ZL: Supervision, Writing–review and editing. CW: Formal Analysis, Writing–review and editing. HL: Project administration, Writing–review and editing. SZ: Funding acquisition, Validation, Writing–review and editing. BH: Resources, Visualization, Writing–review and editing.
Funding
The author(s) declare financial support was received for the research, authorship, and/or publication of this article. This paper is supported by the State Grid Jilin Baishan Power Supply Company project, the project number is SGGLBS00KJJS2300911.
Acknowledgments
Here, I would like to thank the State Grid Jilin Baishan Power Supply Company for its support of this article, and also thank all the people who contributed to this article.
Conflict of interest
Authors CJ, CY, ZL, and CW were employed by State Grid Jilin Electric Power Co., Ltd.
The remaining authors declare that the research was conducted in the absence of any commercial or financial relationships that could be construed as a potential conflict of interest.
Publisher’s note
All claims expressed in this article are solely those of the authors and do not necessarily represent those of their affiliated organizations, or those of the publisher, the editors and the reviewers. Any product that may be evaluated in this article, or claim that may be made by its manufacturer, is not guaranteed or endorsed by the publisher.
References
Cao, W., Wu, J., Jenkins, N., Wang, C., and Green, T. (2016). Operating principle of Soft Open Points for electrical distribution network operation. Appl. Energy 164, 245–257. doi:10.1016/j.apenergy.2015.12.005
Chengshan, W., Guanyu, S., Peng, L., Hao, Y., Jinli, Z., and Jianzhong, W. (2016). SOP based flexible interconnection technologies for smart distribution networks and outlook. Automation Electr. Power Syst. 40 (22), 168–175.
Chengshan, W., Jie, J., Haoran, J., Hao, Y., Jianzhong, W., and Peng, L. (2022). SOP technologies and applications in distribution networks. SOP Technol. Appl. Distribution Netw. 46 (04), 1–14.
Chengwei, L., Jin, Y., Eduardo, V.-F., Liang, M., and Min, L. (2022). Multi-terminal phase-changing soft open point SDP modeling for imbalance mitigation in active distribution networks. Int. J. Electr. Power Energy Syst. 142 (PA), 108228. doi:10.1016/j.ijepes.2022.108228
Chengwei, L., Jin, Y., Tianrui, L., and Eduardo, V. F. (2020). New phase-changing soft open point and impacts on optimising unbalanced power distribution networks. IET Generation, Transm. Distribution 14 (23), 5685–5696. doi:10.1049/iet-gtd.2019.1660
Cong, S., Guorong, Z., Bo, P., Runsheng, X., Likai, H., and Xiaotong, D. (2020). Flexible multi-state power router DC voltage control strategies with disturbance rejection capability. High. Volt. Eng. 46 (04), 1198–1205. doi:10.13336/j.1003-6520.hve.20200430011
Dejan, R. I., and Predrag, C. S. (2021). An extended control strategy for weakly meshed distribution networks with soft open points and distributed generation. IEEE ACCESS 9, 137886–137901. doi:10.1109/access.2021.3116982
Guorong, Z., Xiaofang, M., Bo, P., Yong, Y., Yi, L., and Chaoliang, W. (2019). Research on voltage fluctuation control based on three-port flexible multi-state switch. Power Syst. Prot. Control 47 (23), 57–64. doi:10.19783/j.cnki.pspc.190040
Guorong, Z., Yiming, Z., Bo, P., Yong, Y., Chaoliang, W., and Feng, X. (2020). Switching technology between different operating modes based on three-port flexible multi-state switch. Electr. Meas. Instrum. 57 (11), 1–8. doi:10.19753/j.issn1001-1390.2020.11.001
Husam, A. R., and Spyros, S.-K. (2022). DC soft open points for resilient and reconfigurable DC distribution networks. Energies 15 (16), 5967. doi:10.3390/en15165967
Long, C., Wu, J., Thomas, L., and Jenkins, N. (2016). Optimal operation of soft open points in medium voltage electrical distribution networks with distributed generation. Appl. Energy 184, 427–437. doi:10.1016/j.apenergy.2016.10.031
Qi, Q., Wu, J., and Long, C. (2017). Multi-objective operation optimization of an electrical distribution network with soft open point. Appl. Energy 208, 734–744. doi:10.1016/j.apenergy.2017.09.075
Qunhai, H., Menghan, S., Lixin, W., Tongzhen, W., and Peng, W. (2018). Composite control strategies for flexible multi-state power routers. Automation Electr. Power Syst. 42 (07), 166–170.
Xiaodong, Y., Chongbo, X., Youbing, Z., Wei, Y., Jinyu, W., and Shijie, C. (2021). Real-time coordinated scheduling for ADNs with soft open points and charging stations. IEEE Trans. POWER Syst. 36 (6), 5486–5499. doi:10.1109/tpwrs.2021.3070036
Yan, L., Xia, C., Weiwei, L., Songtao, Y., Shukai, X., Tianliu, W., et al. (2022). Research on flexible distribution network interconnection structure and control technology based on parallel connection of SOP and tie switches. Proc. Chin. Soc. Electr. Eng. 42 (13), 4749–4760. doi:10.13334/j.0258-8013.pcsee.210479
Keywords: step transfer, SOP, tie switch, parallel connection, power transfer
Citation: Jia C, Chen X, Yan C, Li Z, Wang C, Li H, Zhang S and Huang B (2023) Control strategies for active distribution networks based on soft open point. Front. Energy Res. 11:1334014. doi: 10.3389/fenrg.2023.1334014
Received: 06 November 2023; Accepted: 21 November 2023;
Published: 14 December 2023.
Edited by:
Zening Li, Taiyuan University of Technology, ChinaReviewed by:
Congbo Wang, China Electric Power Research Institute (CEPRI), ChinaZhiwei Yang, State Grid Corporation of China (SGCC), China
Copyright © 2023 Jia, Chen, Yan, Li, Wang, Li, Zhang and Huang. This is an open-access article distributed under the terms of the Creative Commons Attribution License (CC BY). The use, distribution or reproduction in other forums is permitted, provided the original author(s) and the copyright owner(s) are credited and that the original publication in this journal is cited, in accordance with accepted academic practice. No use, distribution or reproduction is permitted which does not comply with these terms.
*Correspondence: Xiangyu Chen, Y2hlbnhpYW5neXUwOTA4QGFsaXl1bi5jb20=