 Tianran Ma
 Lintong Jiang
 Yanbao Liu2*
 Chaobin Guo
 Weijun Shen
- 1School of Mechanics and Civil Engineering, China University of Mining and Technology, Xuzhou, China
- 2State Key Laboratory of Gas Disaster Detecting, Preventing and Emergency Controlling, Chongqing, China
- 3The Danish Hydrocarbon Research and Technology Centre, Technical University of Denmark, Lyngby, Denmark
- 4SinoProbe Laboratory, Chinese Academy of Geological Sciences, Beijing, China
- 5Technology Innovation Center for Carbon Sequestration and Geological Energy Storage, Ministry of Natural Resource, Beijing, China
- 6Institute of Mechanics, Chinese Academy of Sciences, Beijing, China
- 7Geological Survey of Hebei Province, Shijiazhuang, China
Introduction: This study explores the potential of enhancing shale oil recovery and reducing CO2 emissions through CO2 injection in fractured shale reservoirs. The importance of this approach lies in its dual benefit: improving oil extraction efficiency and addressing environmental concerns associated with CO2 emissions.
Method: We employed a discrete fracture-matrix model to simulate CO2 flooding in fractured shale reservoirs, utilizing both discontinuous Galerkin (DG) and continuous Galerkin (CG) finite element methods. The DG-CG FEM’s accuracy was validated against the McWhorter problem, ensuring the reliability of the simulation results. Our model also considered various factors, including reservoir heterogeneity, fracture permeability, CO2 injection volume, and gas injection patterns, to analyze their impact on shale oil recovery.
Result: Our simulations revealed that fractured reservoirs significantly enhance shale oil production efficiency compared to homogeneous reservoirs, with an approximate 48.9% increase in production. A notable increase in shale oil production, by 15.8%, was observed when fracture permeability was increased by two orders of magnitude. Additionally, a fourfold increase in CO2 injection rate resulted in a 31.5% rise in shale oil production. Implementing a step-by-step reduction in injection volume while maintaining the total CO2 injection constant proved to be more effective than constant-rate injections.
Discussion: The study demonstrates the effectiveness of CO2 flooding in fractured shale reservoirs for enhancing shale oil recovery.
1 Introduction
The effective exploitation of unconventional oil and gas is of great strategic significance to alleviate the contradiction between oil and gas supply and demand, promoting the low-carbon transformation of energy structure (JIN et al., 2021a). In China, shale oil resources are abundant and exhibit extensive geographical distribution. Nonetheless, notable challenges persist, notably concerning the low recovery and limited production experienced by individual wells (JIN et al., 2021b). The shale oil development goal of China is to achieve a production output of 6.5 million metric tons by 2025, with increasing shale oil recovery rate serving as a crucial support for realizing the objective (Yang and Huang, 2019). Since supercritical CO2 can rapidly penetrate into the microporosity of reservoir rocks, CO2 injection for enhanced recovery has been applied industrially in the field of oil and gas development (LU et al., 2021; MA et al., 2017). Not only does CO2 injection enhance the oil and gas recovery rate, but it also facilitates CO2 geological storage, mitigates the global greenhouse effect, and aids China in reaching its “carbon peak, carbon neutral” goals. Therefore, the development of CO2 injection shale oil technology has a broad application prospect and strategic significance.
At present, CO2 enhanced oil recovery from shale mainly focuses on two aspects: shale core flooding test and numerical simulation of gas injection enhanced recovery (MEI et al., 2018; JIA et al., 2019; FAN et al., 2022; Li et al., 2022; Wan et al., 2022; Huang et al., 2023). In terms of experimental research, core-scale CO2 shale oil replacement tests have been carried out (ALHARTHY et al., 2018; ELWEGAA et al., 2019; FAKHER and IMQAM, 2020; LANG et al., 2021) and the results show that CO2 injection can improve shale oil recovery. Moreover, the efficiency of this replacement process is influenced by factors such as the duration of CO2 exposure, shale permeability, porosity, and the maturity of organic matter. Chen et al. (Cheng et al., 2014), Zhu et al. (ZHU et al., 2018) and Yu et al. (YU et al., 2021) adopted numerical simulations to show that volumetric fracturing penetrates the internal fractures of the reservoir, and then injecting CO2 effectively improve the recovery rate. If CO2 is directly injected into the reservoir with low permeability, the recovery rate of shale oil is reduced. The existing studies focus on the impact of secondary fractures generated by fracturing on gas injection and oil recovery, while ignoring the impact of primary fractures widely present inside the reservoir.
Fractures in reservoirs profoundly affect fluid flow paths and mass transport. The models describing fluid flow in fractured rock are generally categorized into equivalent continuous models, discrete fracture network models, and discrete fracture-matrix models (GLÄSER et al., 2017; BERRE et al., 2019). Among them, the equivalent continuum model is subdivided into single-pore medium model, dual-pore medium model, and multi-pore medium model (BERRE et al., 2019). The assumptions of the single-pore medium model are based on the effective medium theory, which ignores the properties of the fracture network and calculates the effective permeability of the fracture network based on the shape, size, pore size and orientation distribution of the fracture as well as the matrix permeability. The dual-pores medium model and the multi-pore medium model mathematically describe the pores and fracture, and the fluid-mass balance equations are established within the fracture and matrix systems respectively. At any point in space, hydraulic parameters (permeability, porosity, etc.) have single or multiple values. Fracture-matrix interactions are represented by fluid exchange terms that incorporate microscale effects at the macroscale and do not geometrically characterize the fracture. Therefore, it is possible to carry out relevant studies directly using the method of simulating the flow in porous media (WANG et al., 2000; LIU and ZHANG, 2008; Yang et al., 2008). Currently, the common oil and gas numerical simulation software ECLIPSE, TOUGH2 and CMG are using equivalent continuous models (PRUESS et al., 1999; GUIDE, 2002; LAW et al., 2002; LAW et al., 2003; GeoQuest, 2010). Although this method is computationally efficient, it is more difficult to geometrically realize discrete fractures in porous media and their effects on local fluid paths. In the discrete fracture network and discrete fracture matrix models, the matrix and the fracture are retained as separate geometrical objects, and the fracture region is explicitly created within the overall framework. The discrete-fracture model ignores the permeability of the matrix and considers only the fluid behavior in the fracture network. In the discrete fracture matrix model, diffusion, desorption, or two-phase seepage of the fluid within the matrix is ab considered. Meanwhile, the model downscales to deal with fractures and explicitly constructs low-dimensional fractures. The discrete fracture matrix model allows the effect of fractures on the flow topology to be explicitly modeled compared to the dual-porosity and dual-permeability model in an equivalent continuous medium (KHOEI et al., 2016a; CHEN et al., 2017; ZHANG et al., 2017; MENG et al., 2018; CUSINI et al., 2021).
Based on the discrete fracture matrix model, this paper establishes a two-phase fluid flow model for CO2 enhanced shale oil recovery. The model incorporates the two-phase seepage governing equations for CO2 and shale oil, accounting for their behavior in both the porous regions and low-dimensional discrete fracture within the reservoir, including the fluid-mass transfer between the fractures and the pores. We apply this established model to a randomly fractured shale reservoir for numerical simulation purposes. Through this application, we analyze the effects of reservoir inhomogeneity, fracture permeability, CO2 injection volume, and the injection scheme on the field, as well as on the efficiency and volume of shale oil extraction.
2 Mathematical model
The discrete fracture matrix model utilizes explicit low-dimensional interfaces to equivalently replace the high-dimensional regions occupied by fractures. The matrix and low-dimensional fractures are retained as separate geometric objects, and the discrete fracture network is explicitly modeled within the overall framework, as shown in Figure 1. The two-dimensional computational domain
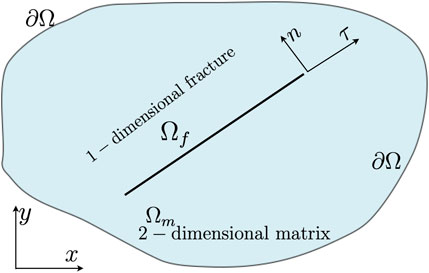
FIGURE 1. Geometric diagram of discrete fracture model.
2.1 Governing equations for two-phase flow
The basic assumptions of the mathematical model are as follows: 1) the fluid process is isothermal; 2) CO2 and shale oil are immiscible fluids; 3) the velocities of the free-state fluids in the matrix and the fracture satisfy Darcy’s law; 4) the mass exchange of CO2 and shale oil in the matrix and fracture satisfies the linear mass-transfer equations; and 5) the differential capillary pressure effect between the matrix and the fracture is neglected. Based on the above assumptions, the governing equations for the two-phase fluids of CO2 and shale oil in the reservoir matrix
The two-phase flow in the reservoir fracture
where superscript
The weak forms of the discontinuous Galerkin method for Equations 1, 2 are shown below (MA et al., 2021a; MA et al., 2021b):
The weak form of the continuous Galerkin method in Equations 3, 4 is shown below (MA et al., 2021b):
where
2.2 Relative permeability and capillary pressure
The same relative permeability and capillary pressure models are selected for the matrix and fractures in shale reservoirs with the following expressions (MA et al., 2021a):
In the above equation:
2.3 Initial and boundary conditions
The initial conditions in the matrix and fractures of the shale reservoir are set as follows:
where
The production well is set up as Dirichlet boundary conditions with constant pore pressures and saturation, which are expressed as follows:
The injection well is set as a constant flow boundary:
where
The difference in initial values of the variables between the production well and the shale reservoir increases the nonlinear characteristics of the two-phase flow equations. To further improve the convergence and stability of the model, the method of adding penalty function is introduced in this study to set Dirichlet boundary conditions (MA et al., 2021a), then equations Eq. 15 and Eq. 16 are rewritten as:
3 Model implementation
We use ADFNE software to generate the coordinate information of random fractures. Subsequently, we utilize COMSOL Livelink in conjunction with MATLAB to import this random fracture information into the COMSOL Multiphysics software, allowing us to generate the corresponding geometric model. Following this, we incorporate the two-phase flow equations (6) to (9) for both pores and fractures into the built-in PDE weak form and low-dimensional PDE weak form modules of the COMSOL Multiphysics finite element software, respectively. We also set the model boundary and initial conditions. In the time domain, we choose to discretize the equations using the q-order backward difference method. For solving the nonlinear algebraic system, we selecte the MUMPS direct solver based on LU decomposition, applying the damped Newton method. To achieve higher computational accuracy, we set the relative tolerance to 0.001. The algorithm employs an adaptive approach for time discretization, in contrast to the pre-established time step method which selects time steps randomly. By default, this method initiates with the first step being 0.1% of the total end time.
4 Model validation
In this section, the model and its numerical results are validated through the McWhorter problem, in which the capillary effects of immiscible and incompressible two-phase flow in porous media are considered. The geometry, boundary and initial conditions of the model are shown in Figure 2. The length of the model is 2.6 m. At the initial moment, the simulated region is fully saturated by the non-wetting phase fluid and the reservoir pressure is
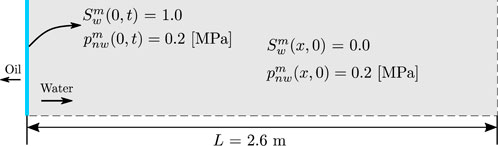
FIGURE 2. Geometric model, boundary conditions and initial conditions for the McWhorter problem. The subscripts w and nw refer to the wetting phase and non-wetting phase, respectively.
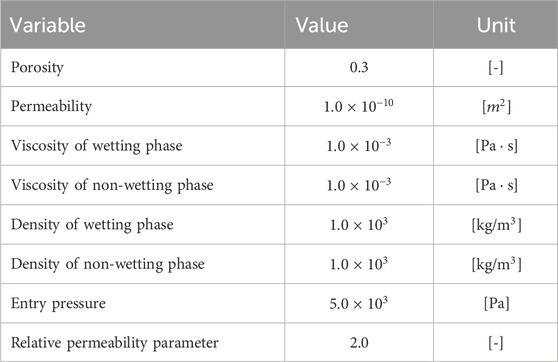
TABLE 1. Parameter settings in McWhorter problems.
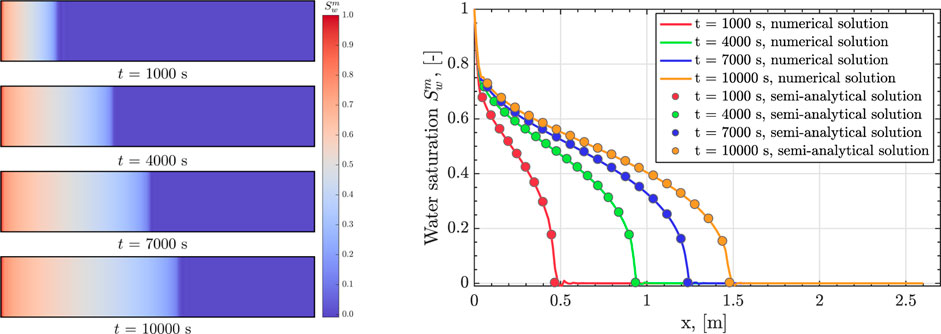
FIGURE 3. The left panel illustrates the spatial distribution of water saturation at various time steps, whereas the right panel presents the line distribution of water saturation from numerical (lines) and semi-analytical (dots) solution.
5 Model setup
Given the challenge of directly obtaining the distribution characteristics and attribute information of fractures within the reservoir, we employ the ADFNE program to generate two sets of two-dimensional random fractures (Alghalandis, 2017), with fracture lengths following an exponential distribution. The fractures are oriented at 45° and 135° to the horizontal direction, and the minimum and maximum values of the fracture lengths are 1 m and 5 m, respectively. The model is shown in Figure 4, and the 10 m
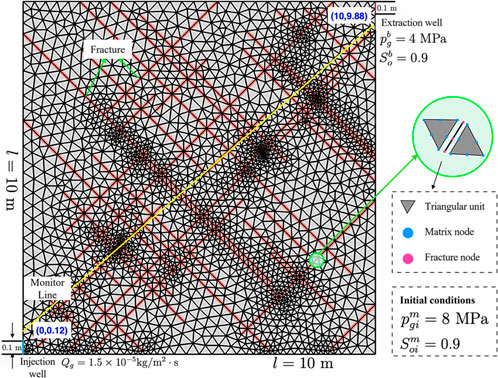
FIGURE 4. Geometric model, boundary conditions and initial conditions of a fractured shale reservoir.
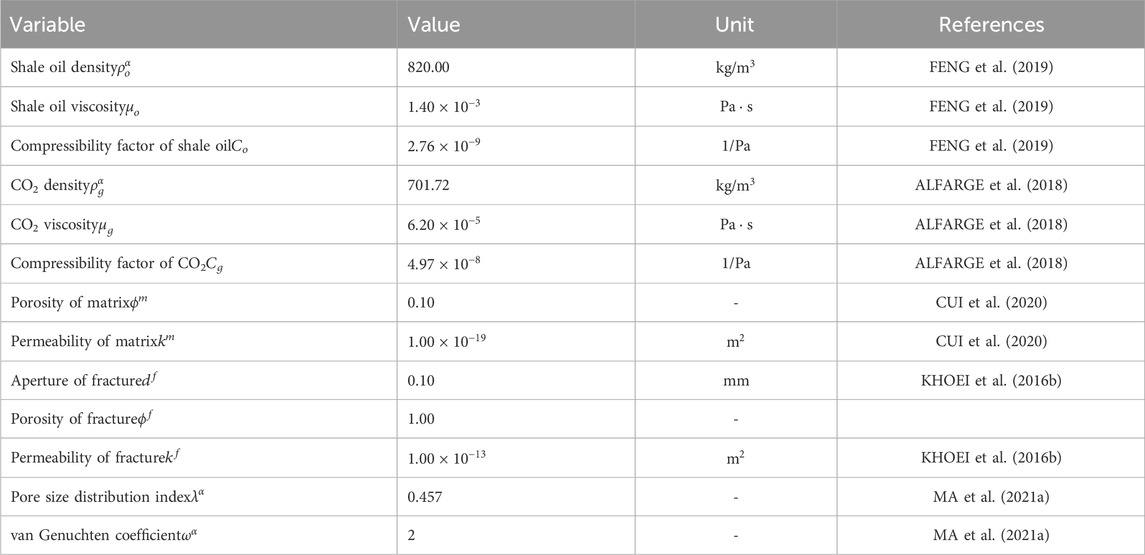
TABLE 2. Simulation parameters for CO2 enhanced shale oil in a fractured reservoir.
6 Simulation results
Figures 5, 6 represent the spatial distribution of pore pressure (
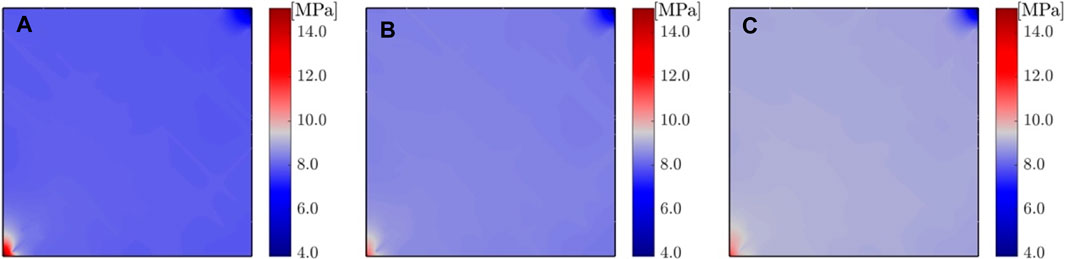
FIGURE 5. Pore pressure distribution at t = 50th, 300th and 600th day for CO2 injection into fractured reservoirs.
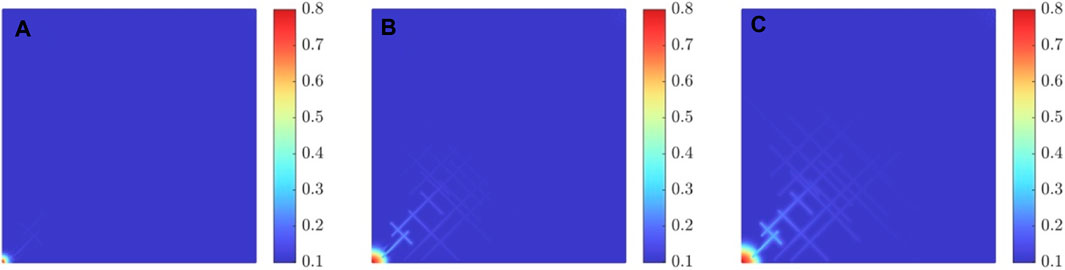
FIGURE 6. Saturation distribution at t = 50th, 300th and 600th day for CO2 injection into fractured reservoirs.
7 Sensitivity analysis
7.1 Effects of heterogeneity in shale reservoirs
In shale oil reservoirs, a considerable number of weak structural surfaces, such as laminae and natural fractures, are developed (JIN et al., 2021a; JIN et al., 2021b). Although fractures account for a small portion of the volume of the underlying shale oil reservoir, the fractures contribute to the heterogeneity of reservoir, profoundly affecting fluid transport and shale oil extraction efficiency (LEI et al., 2021). To accurately understand the impact of shale oil reservoirs heterogeneity properties on internal fluid transport, we investigate the effects of CO2 injection into fractured and homogeneous reservoirs. Figures 7, 8 shows the distribution of reservoir pore pressure and CO2 saturation along the monitoring line at different time steps (t = 50th, 300th and 600th day) during CO2 injection into both the fractured and homogeneous reservoirs. The fractures enhance the overall permeability of the shale oil reservoir, increasing the mobility of both CO2 and shale oil. As a result, the CO2 saturation within the fractured reservoir at the same location is significantly higher than that in the homogeneous reservoir. Due to the lower permeability of matrix in the homogeneous reservoir, CO2 tends to accumulate near the well, leading to slightly higher CO2 saturation in its vicinity than at the wellhead of the fractured reservoir. The pore pressure near the injection well in the homogeneous reservoir is about 14.5 MPa at 600 days into the injection; however, in the fractured reservoir, the pore pressure near the injection well is about 20.1 MPa, due to the injection of a larger volume of CO2.
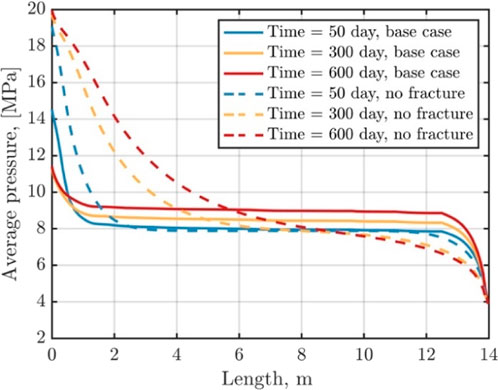
FIGURE 7. Distribution of pore pressure along the monitoring line at different time steps.
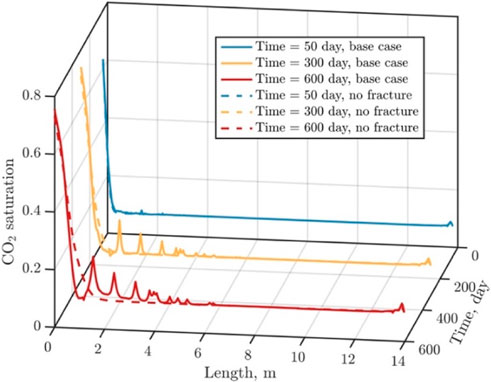
FIGURE 8. Distribution of CO2 saturation at different moments along the monitoring line.
Figure 9 illustrates the shale oil extraction rate and cumulative production resulting from CO2 injection into both fractured and homogeneous reservoirs. At the outset of gas injection and production, the production rate of shale oil surges rapidly due to the significant pressure difference between the gas extraction well and the reservoir. During the process of production, the production rate of shale oil follows a general trend of increasing initially and then decreasing. On the 50th day of gas injection, the production rate of shale oil in the fractured reservoir experiences a rebound, attributable to the injection of a larger quantity of CO2. By the 600th day of gas injection, the production rates of shale oil in the homogeneous and fractured reservoirs are approximately 0.09 kg/d and 0.17 kg/d, respectively, while the cumulative production amounts to approximately 60.8 kg and 90.4 kg, respectively. Throughout the entirety of the simulation process, the presence of natural fractures contributes to a 48.9% increase in the cumulative production of shale oil.
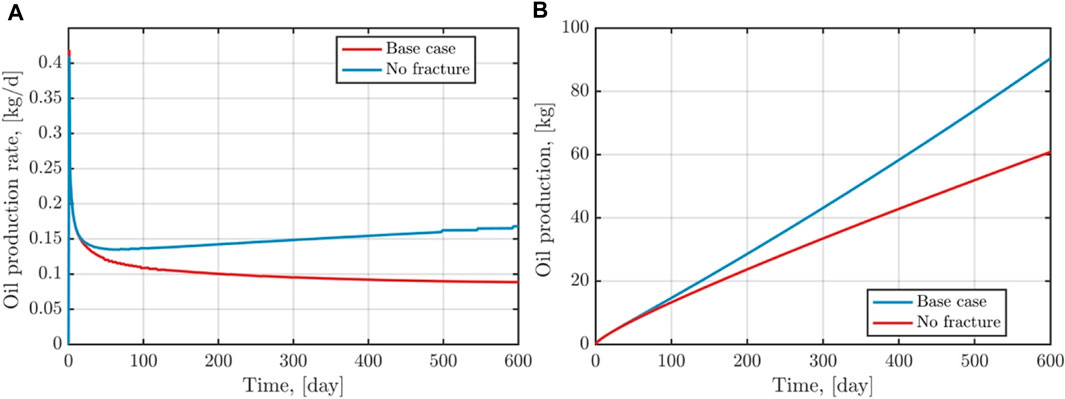
FIGURE 9. The evolutions of shale oil production rate and cumulative production for CO2 injection into both fractured and homogeneous reservoirs.
7.2 Effect of fracture permeability
Fracture permeability is typically one of the key factors influencing the efficiency of CO2 enhanced shale oil recovery (ALFARGE et al., 2018; FENG et al., 2019). Here, we focus on analyzing the effect of fracture permeability on the behavior of fluid flow, as well as on shale oil recovery efficiency and production volume. Figures 10, 11 show the distribution of CO2 saturation and pore pressure on the 600th day under different fracture permeability conditions (
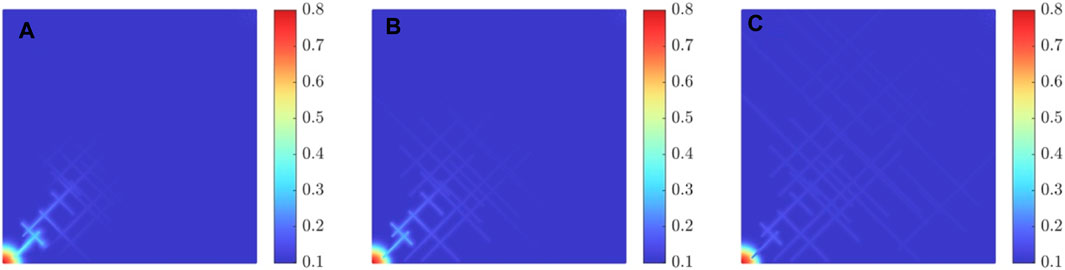
FIGURE 10. Distribution of CO2 saturation at t = 600th day with different fracture permeabilities.
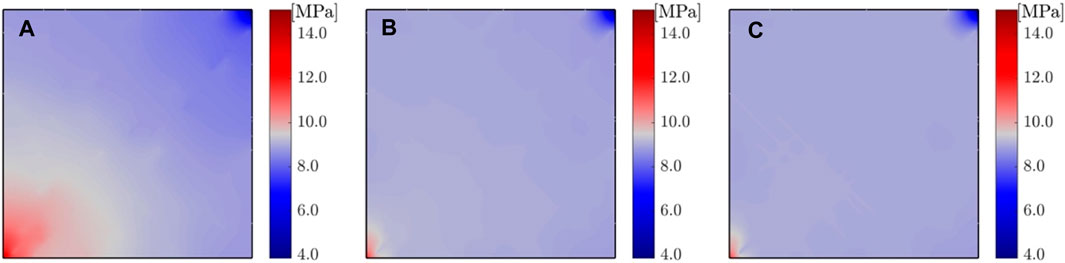
FIGURE 11. Distribution of pore pressure at t = 600th day with different fracture permeabilities.
Figures 12, 13 demonstrate the distribution of CO2 saturation and pore pressure along the monitoring line, as well as the shale oil production rate and total production volume under different fracture permeability conditions. As fracture permeability increases, CO2 is more readily able to penetrate into the interior of the reservoir, leading to an increase in both CO2 saturation and reservoir pressure near the gas injection wells. A higher fracture permeability facilitates the flow of shale oil, enhancing the production rate and the total volume of shale oil produced. When the fracture permeability increases from
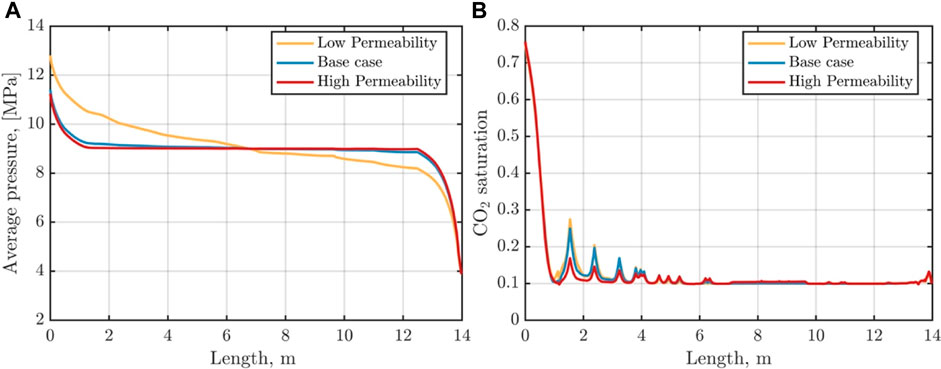
FIGURE 12. Distribution of pore pressure and CO2 saturation along the monitoring line at t = 600th day with different fracture permeabilities.
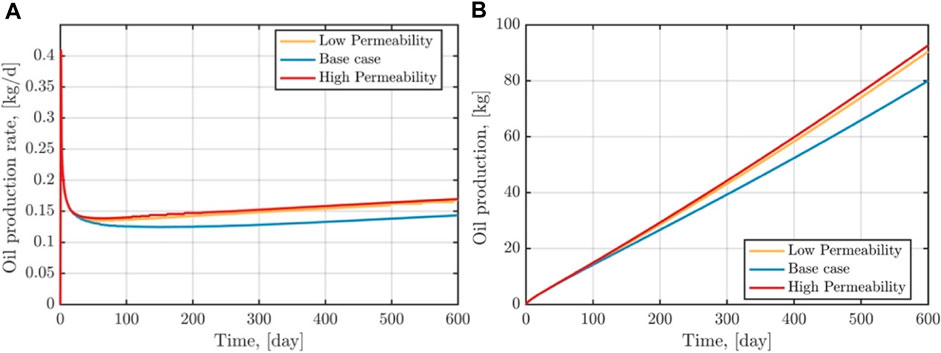
FIGURE 13. Shale oil production rate and total production with different fracture permeabilities.
7.3 Effect of CO2 injection rate
Figures 14, 15 show the distribution of pore pressure and CO2 saturation along the monitoring line, as well as the shale oil extraction rate and total amount of production, under the conditions of CO2 injection rate (
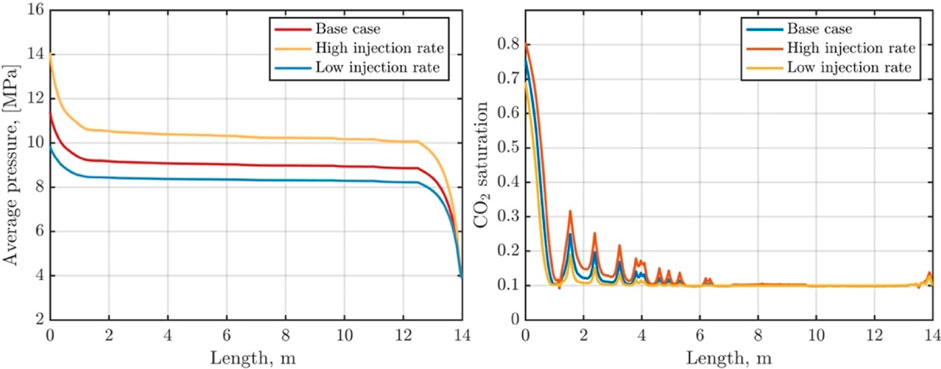
FIGURE 14. Distribution of pore pressure and CO2 saturation along the monitoring line under different CO2 injection rate conditions.
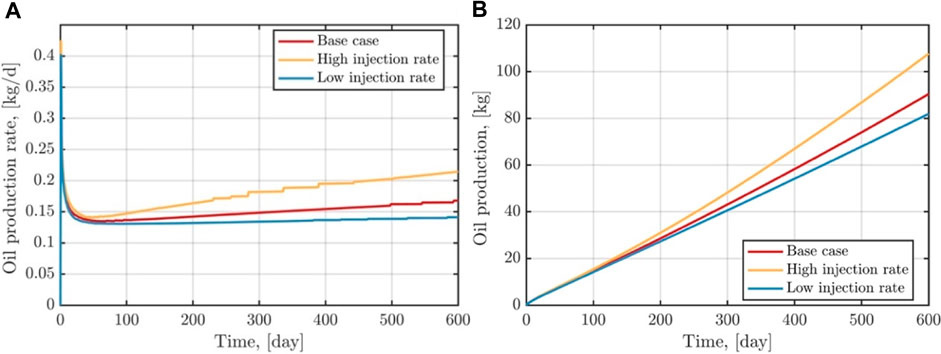
FIGURE 15. Shale oil extraction rate and total production under different CO2 injection rates.
7.4 Effect of different gas injection schemes
To examine the impact of various gas injection strategies, three distinct cases are designed, as depicted in Figure 16. In case 1, the CO2 injection rate undergoes a stepwise reduction, starting from

FIGURE 16. Evolution of shale oil production in different gas injection cases.
The spatial distribution of CO2 saturation at t = 600 days for different gas injection schemes is illustrated in Figure 17. After 600 days of gas injection and extraction, the CO2 distribution within the shale reservoir is generally similar across all three injection schemes. Figures 18, 19 highlight variations in pore pressure, extraction rate, and total production near the injection and production wells under different gas injection scenarios. The pore pressures near the injection wellheads for case 1 and 3 quickly peak at 13.5 MPa and 11.5 MPa, respectively, at the onset of gas injection and extraction. Thereafter, the pore pressure decreases under the influence of the production wells. In Case 2, the pore pressure gradually increases to 10.2 MPa. Across all three injection cases, the pore pressure near the production wells follows a pattern of rapid decline followed by a rebound. In the middle stage of extraction, case 1 exhibits the highest pore pressure and extraction rate near the injection wells, while Case 2 has the lowest. The total production in Case 1 surpasses that of the other two cases, indicating that the choice of gas injection influences shale oil production, even when the same amount of CO2 is injected. Therefore, optimizing the gas injection scheme presents tangible economic benefits for enhancing production capacity.
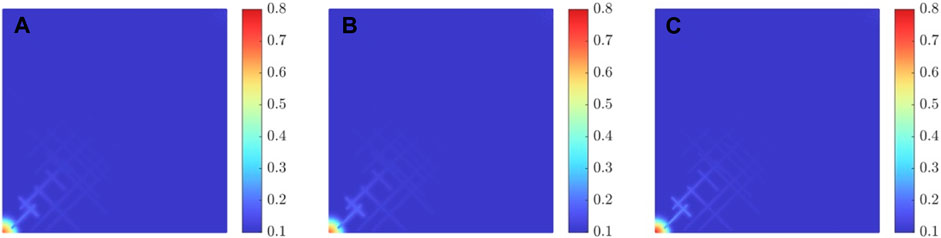
FIGURE 17. Distribution of CO2 saturation at t = 600th day in different gas injection cases.
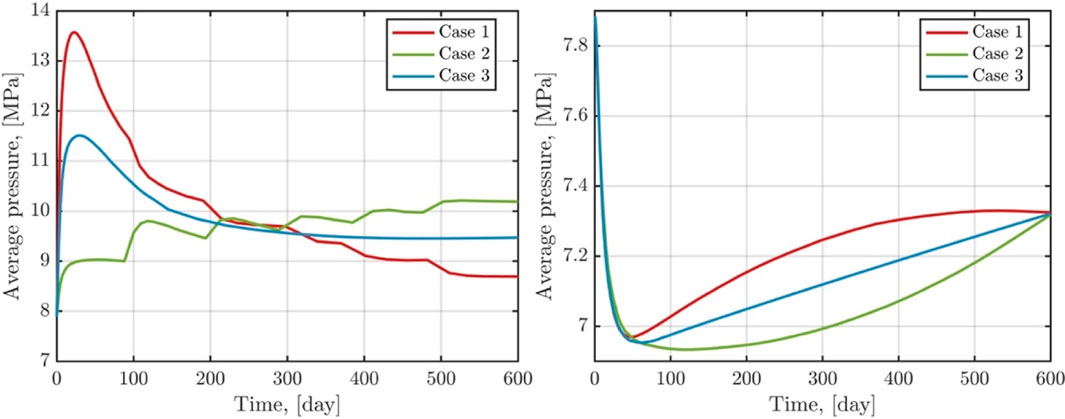
FIGURE 18. Evolution of pore pressure near injection and production wells in different gas injection cases.
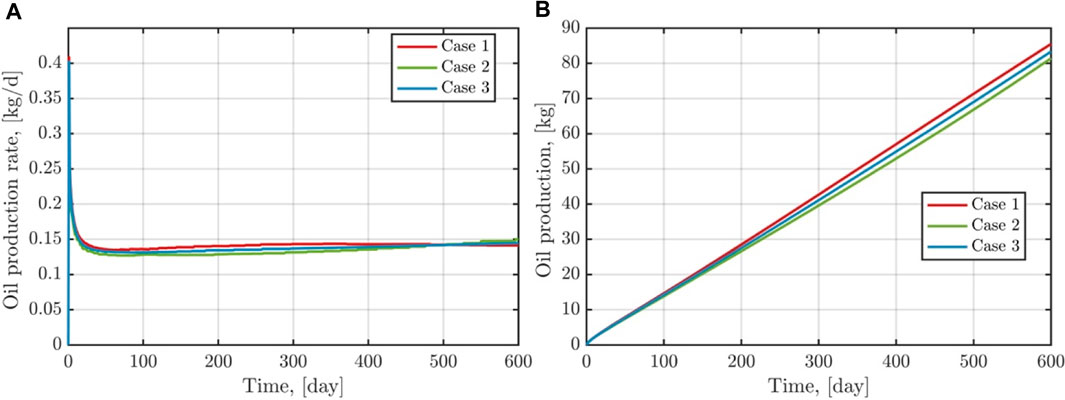
FIGURE 19. Evolution of shale oil recovery rates and total production in different gas injection cases.
8 Conclusion
In this paper, we conducted a comprehensive analysis of the fluid dynamics and production characteristics of shale oil in response to CO2 injection. We presented the discrete fracture matrix model, incorporating both discontinuous and continuous Galerkin finite element methods. The main conclusions are drawn as follows:
(1) Fractures in shale oil reservoirs play a crucial role in boosting both the efficiency of shale oil production and the production volumes. When compared to homogeneous reservoirs, fractured reservoirs exhibit an approximate 48.9% increase in cumulative shale oil production. Enhancing the permeability of fractures contributes to improved fluid flow capacity within the reservoir, subsequently fostering an increase in both the shale oil extraction rate and production volume. However, it is important to note that solely increasing the fracture permeability has a limited effect on augmenting the reservoir’s shale oil production capacity.
(2) A higher CO2 injection rate enhances both the replacement efficiency and shale oil production. As the CO2 injection rate increases from
(3) Higher CO2 injection rates and a stepwise reduction in CO2 injection result in higher reservoir pore pressures, increasing the possibility of damage or even destruction of the rock near the well. New fractures created could cause CO2 leakage, which affects the overall gas injection effect and leads to environmental problems.
Data availability statement
The raw data supporting the conclusion of this article will be made available by the authors, without undue reservation.
Author contributions
TM: Conceptualization, Funding acquisition, Methodology, Visualization, Writing–original draft. LJ: Formal Analysis, Visualization, Writing–original draft. YL: Funding acquisition, Writing–review and editing, Writing–original draft. CG: Funding acquisition, Methodology, Writing–review and editing. WS: Investigation, Writing–review and editing. YX: Methodology, Writing–review and editing.
Funding
The author(s) declare financial support was received for the research, authorship, and/or publication of this article. This study is supported by the National Natural Science Foundation of China (No. 12202483, 12172362, 42002255 and 42372286), the Natural Science Foundation of Chongqing (cstc2021jcyj-msxmX0564), the Opening Fund from the State Key Laboratory of Gas Disaster Detecting, Preventing and Emergency Controlling (Grant No. 2021SKLKF04), PetroChina Innovation Foundation (No. 2021DQ02-0204), and China Postdoctoral Science Foundation (2022M713374), the Chinese Academy of Geological Sciences through Chinese Geological Survey Projects (DD20221819) and the Fund from SinoProbe Laboratory (SinoProbe Lab 202210).
Conflict of interest
The authors declare that the research was conducted in the absence of any commercial or financial relationships that could be construed as a potential conflict of interest.
Publisher’s note
All claims expressed in this article are solely those of the authors and do not necessarily represent those of their affiliated organizations, or those of the publisher, the editors and the reviewers. Any product that may be evaluated in this article, or claim that may be made by its manufacturer, is not guaranteed or endorsed by the publisher.
References
Alfarge, D., Wei, M., and Bai, B. (2018). Data analysis for CO2-EOR in shale-oil reservoirs based on a laboratory database. J. Petroleum Sci. Eng. 162, 697–711. doi:10.1016/j.petrol.2017.10.087
Alghalandis, Y. F. (2017). ADFNE: open-source software for discrete fracture network engineering, two- and three-dimensional applications. Comput. Geosciences 102, 1–11. doi:10.1016/j.cageo.2017.02.002
Alharthy, N., Teklu, T., Kazemi, H., Graves, R., Hawthorne, S., Braunberger, J., et al. (2018). Enhanced oil recovery in liquid–rich shale reservoirs: laboratory to field. SPE Reserv. Eval. Eng. 21 (01), 137–159. doi:10.2118/175034-pa
Berre, I., Doster, F., and Keilegavlen, E. (2019). Flow in fractured porous media: a review of conceptual models and discretization approaches. Transp. Porous Media 130 (1), 215–236. doi:10.1007/s11242-018-1171-6
Brenner, K., Hennicker, J., Masson, R., and Samier, P. (2018). Hybrid-dimensional modelling of two-phase flow through fractured porous media with enhanced matrix fracture transmission conditions. J. Comput. Phys. 357, 100–124. doi:10.1016/j.jcp.2017.12.003
Cheng, CHEN, Balhoff, M., and Mohanty, K. K. Effect of reservoir heterogeneity on primary recovery and CO2 huff ‘n’puff recovery in shale-oil reservoirs[J]. SPE Reserv. Eval. Eng., 2014, 17(03): 404–413. doi:10.2118/164553-pa
Chen, S., Yang, T., Ranjith, P., and Wei, C. (2017). Mechanism of the two-phase flow model for water and gas based on adsorption and desorption in fractured coal and rock. Rock Mech. Rock Eng. 50 (3), 571–586. doi:10.1007/s00603-016-1119-5
Cui, G., Tan, Y., Chen, T., Feng, X. T., Elsworth, D., Pan, Z., et al. (2020). Multidomain two-phase flow model to study the impacts of hydraulic fracturing on shale gas production. Energy and Fuels 34 (4), 4273–4288. doi:10.1021/acs.energyfuels.0c00062
Cusini, M., White, J. A., Castelletto, N., and Settgast, R. R. (2021). Simulation of coupled multiphase flow and geomechanics in porous media with embedded discrete fractures. Int. J. Numer. Anal. Methods Geomechanics 45 (5), 563–584. doi:10.1002/nag.3168
Elwegaa, K., Emadi, H., Soliman, M., Gamadi, T., and Elsharafi, M. (2019). Improving oil recovery from shale oil reservoirs using cyclic cold carbon dioxide injection–An experimental study. Fuel 254, 115586. doi:10.1016/j.fuel.2019.05.169
Fakher, S., and Imqam, A. (2020). Application of carbon dioxide injection in shale oil reservoirs for increasing oil recovery and carbon dioxide storage. Fuel 265, 116944. doi:10.1016/j.fuel.2019.116944
Fan, L., Chen, J., Zhu, J., Nie, X., Li, L. I. B., and Shi, Z. (2022). Experimental study on enhanced shale oil recovery and remaining oil distribution by CO2 flooding with nuclear magnetic resonance technology. Energy and Fuels 36 (4), 1973–1985. doi:10.1021/acs.energyfuels.1c02982
Feng, Q., Xu, S., Wang, S., Li, Y., Gao, F., and Xu, Y. (2019). Apparent permeability model for shale oil with multiple mechanisms. J. Petroleum Sci. Eng. 175, 814–827. doi:10.1016/j.petrol.2019.01.038
GeoQuest, S. (2010). ECLIPSE reservoir simulator, Manual and technical description. USA, ECLIPSE Technical Description.
Gläser, D., Helmig, R., Flemisch, B., and Class, H. (2017). A discrete fracture model for two-phase flow in fractured porous media. Adv. Water Resour. 110, 335–348. doi:10.1016/j.advwatres.2017.10.031
Guide, S. (2002). Advanced process and thermal reservoir simulator. Alberta Canada: Computer Modelling Group Ltd.
Huang, XING, Tian, Z., Zuo, X., Xiang, L. I., Yang, W., and Lu, J. (2023). The microscopic pore crude oil production characteristics and influencing factors by DME-assisted CO2 injection in shale oil reservoirs. Fuel 331, 125843. doi:10.1016/j.fuel.2022.125843
Jia, B., Tsau, J. S., and Barati, R. (2019). A review of the current progress of CO2 injection EOR and carbon storage in shale oil reservoirs. Fuel 236, 404–427. doi:10.1016/j.fuel.2018.08.103
Jin, Z., Wang, G., Liu, G., et al. (2021a). Research progress and key scientific issues of continental shale oil in China. Acta Pet. Sin. 42 (7), 821–835. doi:10.7623/syxb202107001
Jin, Z., Zhu, R., Liang, X., and Shen, Y. (2021b). Several issues worthy of attention in current lacustrine shale oil exploration and development. Petroleum Explor. Dev. 48 (6), 1471–1484. doi:10.1016/s1876-3804(21)60303-8
Khoei, A. R., Hosseini, N., and Mohammadnejad, T. (2016b). Numerical modeling of two-phase fluid flow in deformable fractured porous media using the extended finite element method and an equivalent continuum model. Adv. water Resour. 94, 510–528. doi:10.1016/j.advwatres.2016.02.017
Khoei, A., Hosseini, N., and Mohammadnejad, T. (2016a). Numerical modeling of two-phase fluid flow in deformable fractured porous media using the extended finite element method and an equivalent continuum model. Adv. Water Resour. 94, 510–528. doi:10.1016/j.advwatres.2016.02.017
Lang, D., Lun, Z., Lyu, C., Wang, H., Zhao, Q., and Sheng, H. (2021). Nuclear magnetic resonance experimental study of CO2 injection to enhance shale oil recovery. Petroleum Explor. Dev. 48 (3), 702–712. doi:10.1016/s1876-3804(21)60056-3
Law, H. S., Meer, L. G. H. V. D., and Gunter, W. D. (2003). Comparison of numerical simulators for greenhouse gas storage in coal beds, part ii: flue gas injection, 563–568.
Law, D., Meer, L. G. H. V. D., and Gunter, W. D. (2002). Numerical simulator comparison study for enhanced coalbed methane recovery processes, part i: pure carbon dioxide injection. SPE Gas. Technol. Symp. doi:10.2118/75669-MS
Lei, Q., Weng, D., Xiong, S., et al. (2021). Progress and development directions of shale oil reservoir simulation technology of China National Petroleum Corporation. Petroleum Explor. Dev. 48 (5), 1035–1042. doi:10.1016/S1876-3804(21)60102-7
Li, S., Zhang, S., Xing, H., and Zou, Y. (2022). CO2–brine–rock interactions altering the mineralogical, physical, and mechanical properties of carbonate-rich shale oil reservoirs. Energy 256, 124608. doi:10.1016/j.energy.2022.124608
Liu, Z., and Zhang, Q. (2008). A review on the state of art of the saturated seepage-stress coupling models in rock mass. Adv. Mech. 38 (5), 585–600. doi:10.6052/1000-0992-2008-5-J2007-054
Lu, Y., Zhou, J., Xian, X., et al. (2021). Research progress and prospect of the integrated supercritical CO2 enhanced shale gas recovery and geological sequestration. Nat. Gas. Ind. 41 (06), 60–73. doi:10.3787/j.issn.1000-0976.2021.06.007
Ma, T., Rutqvist, J., Oldenburg, C. M., and Liu, W. (2017). Coupled thermal–hydrological–mechanical modeling of CO2-enhanced coalbed methane recovery. Int. J. Coal Geol. 179, 81–91. doi:10.1016/j.coal.2017.05.013
Ma, T., Shen, W., Liu, W., et al. (2021a). Discontinuous Galerkin FEM method for the coupling of compressible two-phase flow and poromechanics. Chin. J. Theor. Appl. Mech. 53 (8), 2235–2245. doi:10.6052/0459-1879-21-177
Ma, T., Zhang, K., Shen, W., Guo, C., and Xu, H. (2021b). Discontinuous and continuous Galerkin methods for compressible single-phase and two-phase flow in fractured porous media. Adv. Water Resour. 156, 104039. doi:10.1016/j.advwatres.2021.104039
Mei, H., He, L., Zhang, M., et al. (2018). Status and feasibility analysis on improved shale-oil recovery by gas injection. Reserv. Eval. Dev. 8 (6), 77–82.
Meng, S., Li, Y., Wang, L., Wang, K., and Pan, Z. (2018). A mathematical model for gas and water production from overlapping fractured coalbed methane and tight gas reservoirs. J. Petroleum Sci. Eng. 171, 959–973. doi:10.1016/j.petrol.2018.08.036
Pruess, K., Oldenburg, C., and Moridis, G. (1999). TOUGH2 user’s guide version 2. China, Lawrence Berkeley National Laboratory.
Wan, T. A. O., Zhang, J., and Jing, Z. (2022). Experimental evaluation of enhanced shale oil recovery in pore scale by CO2 in Jimusar reservoir. J. Petroleum Sci. Eng. 208, 109730. doi:10.1016/j.petrol.2021.109730
Wang, Y., Xu, Z., and Su, B. (2000). Full coupling analysis of seepage and stress elastic-plastic in complex fractured rock mass. Chin. J. Rock Mech. Eng. 019 (2), 177–181. doi:10.3321/j.issn:1000-6915.2000.02.011
Yang, L. I. U., Li, S., and Liu, X. (2008). A coupled model of seepage stress in dual media based on continuum discrete element. Chin. J. Rock Mech. Eng. 030 (005), 951–959.
Yang, Y., and Huang, D. (2019). Geological characteristics and new understandings of exploration and development of Jurassic lacustrine shale oil and gas in the Sichuan Basin. Nat. Gas. Ind. 39 (06), 22–33. doi:10.3787/j.issn.1000-0976.2019.06.003
Yu, H., Xu, H., Fu, W., Lu, X., Chen, Z., Qi, S., et al. (2021). Extraction of shale oil with supercritical CO2: effects of number of fractures and injection pressure. Fuel 285, 118977. doi:10.1016/j.fuel.2020.118977
Zhang, Q., Huang, C., Yao, J., Wang, Y., and Li, Y. (2017). Two-phase numerical simulation of discrete fracture model based on multiscale mixed finite element method. Chin. Sci. Bull. 62 (13), 1392–1401. doi:10.1360/n972016-00584
Keywords: CO2 geological storage, shale oil, fractured reservoir, discrete fracture-matrix model, two-phase flow
Citation: Ma T, Jiang L, Liu Y, Guo C, Shen W and Xu Y (2024) Numerical simulation of CO2-enhanced oil recovery in fractured shale reservoirs using discontinuous and continuous Galerkin finite element methods. Front. Energy Res. 11:1330290. doi: 10.3389/fenrg.2023.1330290
Received: 30 October 2023; Accepted: 21 December 2023;
Published: 11 January 2024.
Edited by:
Jiehao Wang, Chevron, United StatesReviewed by:
Guanglei Cui, Northeastern University, ChinaLiyuan Liu, University of Science and Technology Beijing, China
Copyright © 2024 Ma, Jiang, Liu, Guo, Shen and Xu. This is an open-access article distributed under the terms of the Creative Commons Attribution License (CC BY). The use, distribution or reproduction in other forums is permitted, provided the original author(s) and the copyright owner(s) are credited and that the original publication in this journal is cited, in accordance with accepted academic practice. No use, distribution or reproduction is permitted which does not comply with these terms.
*Correspondence: Yanbao Liu, eWFuYmFvX2xpdUAxNjMuY29t