 Yingchun Feng1
 Jianrun Chen
95% of researchers rate our articles as excellent or good
Learn more about the work of our research integrity team to safeguard the quality of each article we publish.
Find out more
ORIGINAL RESEARCH article
Front. Energy Res. , 29 November 2023
Sec. Process and Energy Systems Engineering
Volume 11 - 2023 | https://doi.org/10.3389/fenrg.2023.1326613
This article is part of the Research Topic Advanced Technologies for Planning and Operation of Prosumer Energy Systems, volume III View all 32 articles
To maximize the expected profits and manage the risks of renewable energy system under electricity market environment, scenario-based- stochastic optimization model can be established to generate energy bidding strategies, in which the probabilistic scenarios of risk parameters are usually obtained by using statistical or machine learning methods. This paper proposes a practical multivariate statistical method for risk parameter scenario generation, which is used by a wind energy system faced with uncertain electricity prices and wind power productions, and it considers the correlation between dependent risk parameters by using historical data directly. The probabilities of scenarios containing correlated risk parameters are calculated by using multivariate histograms, in which the asymmetric correlation between different parameters existing in the historical data are preserved. Additionally, in order to make the stochastic optimization problem with large numbers of scenarios tractable, a multivariate scenario reduction method is used to trim down the scenario number. By solving the stochastic optimization problem, optimal day-ahead bidding curves for the wind energy system are generated, and Douglas–Peucker algorithm is used to fit the bidding curves according to market requirements. Case studies based on real world data in electricity markets are performed to prove the effectiveness of the proposed risk parameter scenario generation method and energy bidding strategies. Finally, conclusions and practical suggestions on future research works are provided.
During the last two decades, the increasing penetration of wind power in the electric grid has reduced carbon emissions significantly (Roga et al., 2022). However, the intermittence and unpredictability of wind resources also posed challenge to wind energy systems (AlAshery et al., 2020). Additionally, instead of selling wind power through power purchasing agreements (PPAs) at a fixed price, an increasing number of wind energy systems have committed themselves in the competitive electricity market to earn profits. In this circumstance, wind energy systems need to not only handle the uncertainties of their generations, but also face the volatility of the electricity prices in the electricity markets.
To handle the uncertainties in electricity markets and maximize the profits for wind energy systems, several solutions have been proposed in the literature. Energy storage and demand response technologies have been used to help wind energy systems handle the uncertainties. A coordinated use of wind power and hydro-pump storage was performed to mitigate the wind power imbalances in the electricity market (De la Nieta et al., 2016). He et al. (2017) exploited the complementary characteristics of wind energy and battery storage, and developed optimal bidding strategies in joint energy and regulation markets. The wind energy system could smooth its power variations by establishing various demand response (DR) agreements with DR aggregators (Wu et al., 2015). Another solution is using financial tools given by Hedman and Sheble, 2006, and it was demonstrated that purchasing options was a financially competitive way to hedge the risks for wind energy systems.
Additionally, instead of using deterministic optimization models for decision makers, robust optimization, stochastic optimization, information gap decision theory (IGDT) can be used to handle the uncertainties of the risk or random parameters, such as electricity prices and renewable power generations (Baringo and Conejo, 2016; Li et al., 2016; Deng et al., 2023; Wei et al., 2023). When it is difficult to characterize the risk parameters by using discrete probability distributions, a good choice is to use robust optimization because it assumes that the risk parameters belong to deterministic uncertainty sets. In the electricity market, since the historical data of electricity prices and power generations are usually available, the risk parameters can be modeled by using probabilistic models effectively. Thus, stochastic programming has been widely used by renewable energy systems to maximize their expected profits in the electricity markets (Xiao et al., 2022). Moreover, stochastic programming can be used to further improve the performance of robust and IGDT-based decision-making problems considering risk management (Daneshvar et al., 2020; Khodadadi et al., 2022).
The scenario generation of risk parameter is an important part of stochastic programming, and its accuracy affects the performance of the optimization results significantly. Kaut and Wallace, (2007) presented several widely used scenario generation methods. In the scenario generation process, the correlations between risk parameters are usually characterized by using a variance-covariance matrix (VCM) if they need to be considered, the scenarios of each univariate variable were first generated separately by using time series models or artificial neural networks, and then the VCM is used to model the correlations between different risk parameters (Morales et al., 2010). Based on the VCN approach, a hybrid scenario generation method for dependent spot electricity prices has also been developed by using time series models and outlier detection method (Xiao and Qiao, 2021). However, Vagropoulos et al. (2016) addressed that although the VCM is suitable for elliptical distributions, such as the normal or Student’s t-distribution, it might not work well if there are asymmetric correlations between variables, because the VCM can only measure the linear dependence between variables. The asymmetric correlations between variables can be found in the area of finance. It was shown that the correlations between equity markets in different countries tend to increase in the bear market but decrease in the bull market (Kaut, 2014). Therefore, Vagropoulos et al. (2016) presented a heuristic algorithm for generating dependent scenarios from a given copula, which is a full description of the correlation between marginal probability distributions of multiple risk parameters, which is shown to have better performance than the VCM-based method. Additionally, Krishna and Abhyankar, (2023) employed regular vine copula to model the temporal dependence structure of the wind power forecast error, which has also achieved desired performance. However, it was assumed that the target copula was known, but obtaining the actual copula in practice is as complicated as estimating multidimensional distribution functions (Vagropoulos et al., 2016). To solve the aforementioned problems, this paper proposes a multivariate scenario generation method that can consider the asymmetric correlations between risk parameters by using their historical data directly, and the probabilities of correlated risk parameters are calculated by using multivariate histograms.
In order to characterize the risk parameters accurately, the number of generated scenarios may be very large, which can make the stochastic optimization problem intractable. To solve this problem, Longin and Solnik. (2001) provided an algorithm to reduce the number of scenarios while keeping the information of risk parameters in the original scenario set as intact as possible. However, the scenario reduction algorithm in (Longin and Solnik, 2001) was used for univariate stochastic processes, while the scenario generation method proposed in this paper focuses on multivariate stochastic processes. Therefore, in this paper, a multivariate scenario reduction method is developed based on the univariate one. Additionally, after the stochastic optimization problem is solved, the Douglas–Peucker algorithm is used to fit the bidding curves according to the actual requirements of the electricity market.
The contributions of the conducted research work in this paper are summarized as follows.
1) A practical multivariate statistical method of generating scenarios is proposed for renewable energy management in electricity markets, which is developed based on univariate Seasonal Autoregressive Integrated Moving Average (SARIMA) models and multi-dimensional histograms of historical data. This method is capable of improving the expected profits in electricity markets and capturing the asymmetric correlations of different risk parameters without complicated model estimation or strict joint distribution assumptions.
2) The applicability of the proposed scenario-based stochastic optimization model is improved by jointly employing Douglas–Peucker algorithm and multivariate scenario reduction approach. The Douglas–Peucker algorithm is used to simplify the power bidding curves for satisfying the electricity market requirements, and a multivariate forward reduction approach is adopted to trim down the number of generated scenarios for reducing the computational cost of solving the problem.
The paper is organized as follows. Section 2 presents the short-term electricity market framework and the optimization model for generating the renewable energy management strategy. Section 3 presents the proposed multivariate statistical method. Section 4 provides case studies to validate the proposed statistical method and energy management strategy. Section 5 concludes the paper.
A pool-based electricity market in the United States consisting of a day-ahead and a real-time energy market is considered in this paper, which is also the typical market framework for most provincial or regional spot electricity markets in China and Europe. Figure 1 shows the time frame of a two-settlement electricity market used by the participants in the Southwest Power Pool (SPP) market of United States (Heitsch and Romisch, 2003).

FIGURE 1. Time frame of the two-settlement SPP market.
Suppliers including wind energy systems submit energy bidding curves into the day-ahead market for each hour of the next operating day. After the day-ahead market is closed, the market operator aggregates the bidding curves of the wind farm to determine the hourly day-head electricity price and the cleared energy volume for each producer. The power deviations of the wind farm are settled at the real-time price in the real-time energy market on the operating day. According to the policy of Electricity Market, the day-ahead bidding curve should be a non-decreasing curve and the number of its price/quantity pairs should not exceed the maximum number specified by SPP.
In this paper, the wind energy system is considered as a price-taker in the two-settlement electricity market facing three risk parameters, including day-ahead energy price, real-time energy price, and wind power generation. It is assumed that the bidding strategy of wind energy producer cannot affect the electricity market clearing results obviously. In this circumstance, the risk parameter would be more suitable to be forecasted by using historical data. The bidding problem of the wind energy system in the short-term electricity market is modeled by using the stochastic optimization technique as follows, in which the risk parameters are represented by using scenarios.
Subject to:
where
In practice, when a stochastic model contains multiple risk parameters, it is complex to generate scenarios by sampling the estimated joint distribution of these variables. To avoid this problem, this paper proposes a practical multivariate scenario generation method for the stochastic optimization involving correlated risk parameters, which is easier to be understood and implemented. By using the proposed method, the univariate scenarios of each risk parameter are obtained by using univariate SARIMA models, while the probabilities of the multivariate scenarios containing correlated risk parameters are calculated based on the histograms.
According to the univariate SARIMA model, a univariate stochastic process
where
The details on the parameter estimation and adjustment of the univariate SARIMA models are given in (Rockafellar and Uryasev, 2000). In this paper, the scenarios of the three risk parameters in the stochastic bidding model of the wind energy system, i.e., day-ahead energy price, real-time energy price, and wind power generation, are obtained separately by using the univariate SARIMA model (11).
Denote the scenario w containing the three risk parameters in each time period t as
Since the historical data of the risk parameters contain the intact information of their correlations, multidimensional histograms of the risk parameters are built to capture this kind of information. Then, the probabilities of different scenarios can be calculated using the frequencies of data in the grids.
The multivariate histograms are built by dividing the multidimensional historical data of each variable into bins with equal width. The bin width for the data of the kth variable is commonly determined as follows (Box et al., 2008).
where
Once the multivariate histogram is built, the frequency of the historical data in each grid of the histogram can be obtained. Then the probability of a scenario l,
where
The proposed method is a practical general framework for generating scenarios based on univariate statistical model, and its main advantage is not requiring complex modeling of joint probability distribution for multiple risk parameters, which makes it easy to be implemented. However, the disadvantage is that, the proposed statistical method might be not so accurate as the complicated one based on joint probability distribution function estimation, and the modeling capability of some complicated statistical models cannot be fully utilized.
The commonly used method of generating scenarios for a multivariate stochastic process containing correlated parameters is using the VCM to adjust the scenarios generated by the univariate scenario generation method and historical data. The details of the VCM-based multivariate scenario generation method are given in Morales et al. (2010). The VCM-based scenario generation method is suitable for elliptical distributions, such as the normal distribution or the Student’s t-distribution. However, this method may not work well if the correlations between stochastic parameter are asymmetric due to the statistical assumption.
The procedures of the VCM-based multivariate scenario generation method and the proposed multivariate scenario generation method are depicted in the flowcharts in Figure 2. For the VCM-based scenario generation method, the standard normal errors are cross-correlated. As a result, the correlations between variables are considered in the scenario value calculation process, while the probabilities of all the scenarios are equal. However, for the proposed scenario generation method, the probabilities are recalculated by using the multivariate histograms.

FIGURE 2. Flowcharts of (A) the VCM-based multivariate scenario generation method and (B) the proposed multivariate scenario generation method.
To characterize the risk parameters accurately, the scenario set generated by using the proposed method is usually very large. This may render the stochastic optimization problem intractable. To solve this problem, an appropriate scenario reduction algorithm needs to be designed to reduce the number of scenarios and the reduced scenario set should retain the information contained in the original scenario set as intact as possible.
In Longin and Solnik (2001), a univariate scenario reduction algorithm based on the concept of probability distance was proposed. The probability distance quantifies the closeness of two different scenario sets. However, the algorithm in Longin and Solnik (2001) cannot be used directly for multivariate scenario reduction. In this paper, a multivariate scenario reduction algorithm is developed based on the univariate one in Longin and Solnik (2001).
The most commonly used probability distance for scenario reduction is the Monge-Kantorovich distance, which is obtained by solving the Monge–Kantorovich mass transportation problem for two probability distributions, and details on this problem are provided in Longin and Solnik (2001). For the single-stage stochastic programming problem of the wind energy system in this paper, the Monge-Kantorovich distance
where
Based on Eq. 11, several heuristic algorithms can be utilized for generating reduced scenario sets that are close enough to the original set. Specifically, two different heuristic algorithms can be developed, namely, the backward reduction and the forward selection, depending on whether the subset
In this paper, the forward scenario reduction algorithm is used, and for the proposed multivariate scenario reduction algorithm, the cost function in Eq. 11 is calculated as follows:
where
In the proposed stochastic model, since only three parameters are considering by the wind energy system, it is fine to use Eq. 11 to reduce the scenarios. However, for a complex scenario considering more risk parameters, Eq. 11 might not work well. In this circumstance, other scenario reduction methods, such as the one using objective function as cost function or the method based on generative adversarial network, might have better performance (Morales et al., 2009; Dong et al., 2022).
Based on the proposed multivariate scenario generation method, the optimization model can be solved to obtain the optimal day-ahead bid capacity for each day-ahead energy price scenario w in each time period t. Then, the optimal day-ahead bidding curves can be obtained. However, if the number of day-ahead energy price scenarios in the time period t is larger than the maximum number of price/quantity pairs specified by electricity market operator, the generated bidding curve will not satisfy the market requirements. To solve this problem, the Douglas–Peucker algorithm is used to fit the curves in this paper (Dupačová et al., 2003).
The function of the algorithm is to find a simplified curve with fewer points when a curve composed of line segments is given. The algorithm is implemented based on a specified maximum distance between the original points and the simplified curve, which consists of a subset of the points that defined the original curve. In Dupačová et al. (2003), the implement procedures of this algorithm are described in detail, and the required segment number of the wind power bidding curve is set as the termination criteria for the adopted algorithm (Saalfeld, 1999).
Case studies for a wind energy system participating in the short-term electricity market are carried out to demonstrate the effectiveness of the proposed multivariate statistical method and energy management strategy. The installed capacity of the wind farm is 30 MW, and the historical wind energy data can be obtained from the official website of National Renewable Energy Laboratory (NERL). The historical data of electricity prices are obtained on the website of Southwest Power Pool (SPP) market of the United States. In Sections 4.1–4.3, the historical data from 1 January to 31 December 2015 are utilized to generate the scenarios for the risk parameters on 1 January 2016, which is operating day when the wind power is delivered. In Section 4.3, actual profits from 1 January to 31 August 2016 are calculated to compare the proposed scenario generation method with the VCM-based one with the same univariate scenario generation results. The optimization problem is solved by using Gurobi 6.5 in MATLAB. The computer used for simulation studies has a 3.16-GHz, 4-core CPU and an 8-GB RAM.
The scenario generation results of wind power productions and energy prices are given in this part, and this process is implemented by using MATLAB econometrics toolbox. The wind energy system is considered as a price-taker in the optimization model, therefore, the wind power productions are independent with day-ahead or real-time energy prices. Two thousand scenarios of wind power production are obtained by using a univariate SARIMA model, and the scenario number is reduced to 5 by using the univariate forward scenario reduction method given in Longin and Solnik (2001). The scenario generation and reduced results for 1 day are shown in Figure 3 and the probabilities of reduced wind power scenarios in the first hour are given in Table 1.
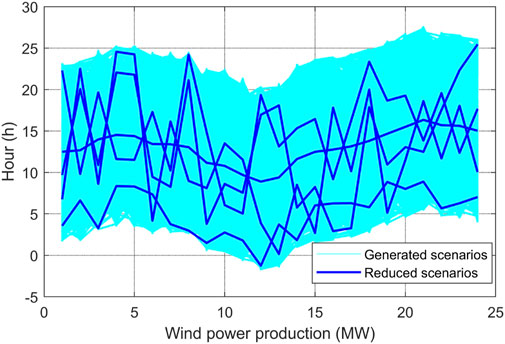
FIGURE 3. Scenario generation and reduction results for wind power production.
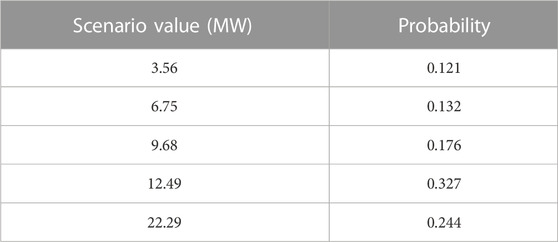
TABLE 1. Reduced scenarios of wind power production for the first hour.
A total of 2,000 scenarios for day-ahead and real-time energy prices are first generated based on univariate SARIMA models separately. It should be noted that, the scenario number is so large that most trajectories of the scenarios overlap with each other. In this circumstance, the specific trajectories of original generated wind power scenarios cannot be observed and only the boundary of the generated scenarios can be seen in Figure 3. By contrast, when the scenario number is finally reduced to be 5, the trajectories of the reduced scenarios in deep blue are much easier to be judged. In order to consider the correlation between day-ahead and real-time energy prices, a multivariate histogram is built by based on historical data by using (13), and the probabilities of scenarios containing these two variables are calculated by using (14). The multivariate histogram is given in Figure 4, and the scenarios for the correlated parameters are given in Figure 5.
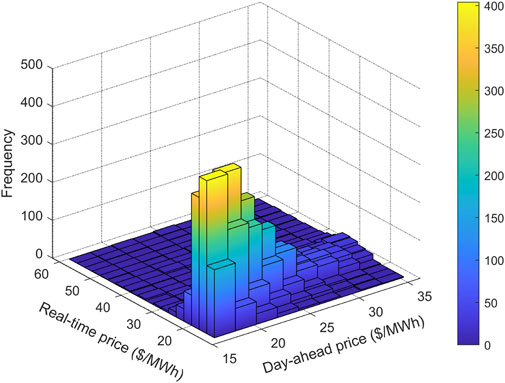
FIGURE 4. Multivariate histogram built by using historical data.
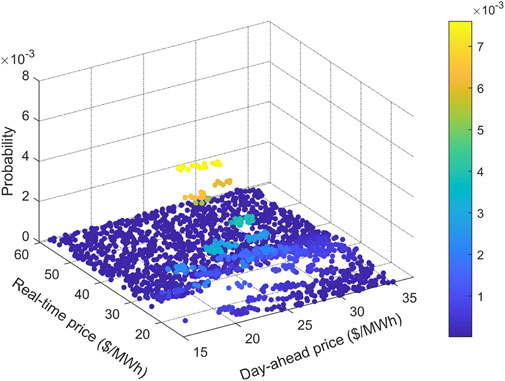
FIGURE 5. Scenario generation results of day-ahead and real-time energy prices for the 18th hour on 1 January 2016.
The historical data of hourly day-ahead and real-time energy prices from 1 January to 30 December 2016 are given in Figure 6, and it is shown that, when the day-ahead or real time energy prices are in different intervals, the correlations between these two variables are different. For instance, when the real-time energy price is very high, its correlation with the day-ahead energy price seems to be weak. In this case, the conditional correlation between day-ahead and real-time energy prices needs to be analyzed in detail, and the Pearson correlation coefficient of day-ahead and real-time prices
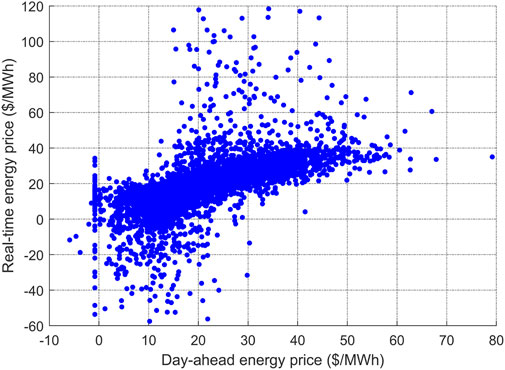
FIGURE 6. Historical data of day-ahead and real-time energy prices.
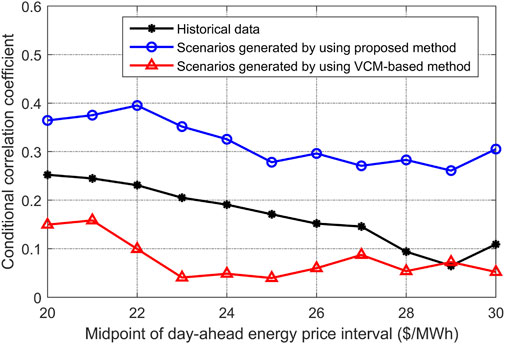
FIGURE 7. Conditional
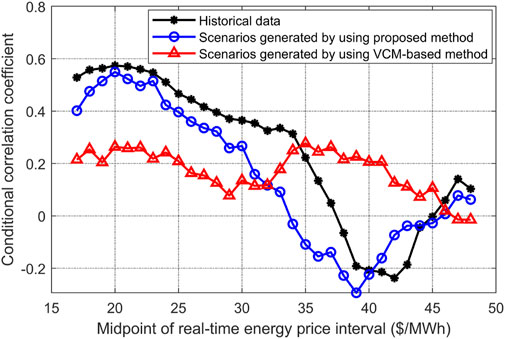
FIGURE 8. Conditional
In Figures 7, 8, the interval length and the increment are set to be 10 and 1, respectively, and the values on the X-axis are the midpoints of energy price intervals. For instance, the first value on X-axis of Figure 7 is 20, which is the midpoint of this day-ahead price interval. Therefore, if the interval length is 10, the corresponding day-ahead price interval would be within the range of [15, 25], and the conditional
As is shown in Figures 7, 8, for the historical day-ahead energy prices in different intervals, the maximum and minimum conditional
In Figure 7, since the
In this section, the data of electricity price from 1 January to 31 December 2015 are utilized to generate day-ahead bidding curves for the wind energy system, and the actual profits from 1 January to August 31 in 2016 are calculated to test the performance of the proposed method. The number of reduced scenarios for wind power is 5, and the number of reduced scenarios for day-ahead and real-time energy prices is 25. Therefore, there are 125 scenarios for the optimization problem during each time period t.
First, the day-ahead bidding curves are generated based on the results of the optimization model for wind energy systems, which has been fitted by using Douglas-Peucker algorithm according to market requirements. Day-ahead bidding curves for several hours on 1 January 2016 are given in Figure 9, and the number of price/quantity pairs for these bidding curves does not exceed 10, which is the maximum number specified by SPP. The bidding curves in different time periods are not the same due to the time-varying electricity prices and wind power productions. Moreover, it is shown that all the bidding curves are non-decreasing, which indicates a large power quantity tends to be sold at a higher price. This kind of property for the bidding curve is determined by constraints (4) and (5) in the proposed stochastic optimization model.
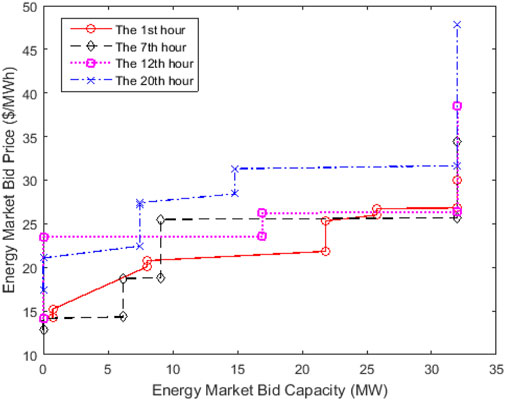
FIGURE 9. Day-ahead bidding curves for typical hours.
Based on the generated bidding curves, the actual wind power bid capacities are obtained, and the actual profits of 8 months are calculated. Then the actual profits obtained by using the proposed scenario generation method are compared with the profits obtained by using the VCM-based scenario generation method. The actual profits and profit improvement are given in Figures 10, 11 separately.
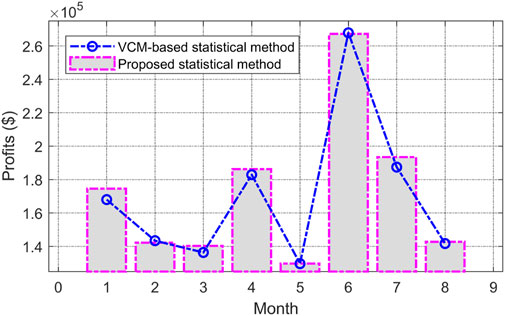
FIGURE 10. Actual profits obtained by using two kinds of scenario generation methods.
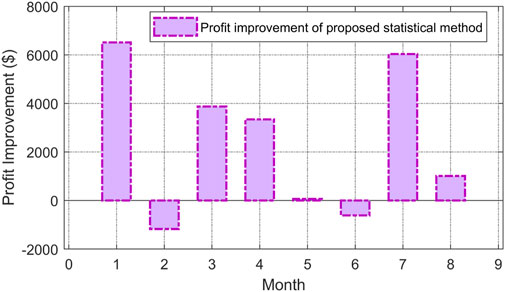
FIGURE 11. Profit improvement by the proposed scenario generation method.
The total profits of the wind energy system by using the VCM-based scenario generation and the proposed scenario generation method are $1,357,468.4 and $1,376,496.3, respectively. Therefore, the wind energy system’s profits can be increased by approximate 1.4% when using the proposed scenario generation method. However, among the 8 months in 2016, there are still 2 months in which the proposed method does not perform better than the VCM-based one, this is because there are uncertainties in the real-time that cannot be handled by using the scenario generation method. These abnormal energy prices are usually caused by some unexpected factors in the real-time market, such as lightning, component failures (Yin, 2011). However, the information of these unexpected factors is not available for the market participants on the day before the operating day, when the market participants need to submit the bidding curves.
This paper proposes a practical multivariate scenario generation method considering the correlation between dependent risk parameters in the short-term electricity market for a wind energy system. In this method, the probabilities of correlated parameters are calculated by using multivariate histograms, and the asymmetric correlation between variables existing in the historical data can be preserved.
Case studies are performed to prove the effectiveness of the proposed scenario generation method. First, the correlation between day-ahead and real-time energy prices are analyzed, and it is shown that the conditional correlation coefficient of day-ahead and real-time prices varies significantly when the real-time prices are in different intervals. Simulation results show that the proposed scenario generation method can preserve this kind of asymmetric correlation more effectively than the VCM-based scenario generation method. In order to reduce the number of scenarios, a multivariate scenario reduction method is developed to trim down the scenario number. By solving the stochastic optimization model, day-ahead wind power bidding curves are generated, and Douglas–Peucker algorithm is used to fit the bidding curves according to electricity market requirements. Based on the generated bidding curves, the actual profits are calculated and the results indicate the proposed statistical method and scenario-based stochastic optimization model can make the wind energy system earn more profits.
In the future research, the scenario-based stochastic optimization for other types of decision makers, such as virtual power plant and prosumer aggregator with flexible resources, would be further investigated. In this case, other statistical models, such as Generalized Autoregressive Conditional Heteroskedasticity model and machining learning, can be adopted to implement and analyze the proposed scenario generation framework under more complicated conditions with other risk parameters, such as electric demands, solar power productions, reserve prices, etc (Batlle and Barqun, 2004; Hu and Li, 2022).
The original contributions presented in the study are included in the article/Supplementary Material, further inquiries can be directed to the corresponding author.
YF: Conceptualization, Data curation, Formal Analysis, Funding acquisition, Investigation, Project administration, Resources, Validation, Writing–original draft, Writing–review and editing. JF: Data curation, Formal Analysis, Resources, Writing–original draft. BG: Data curation, Formal Analysis, Project administration, Validation, Writing–original draft. YJ: Investigation, Methodology, Project administration, Writing–review and editing. JC: Data curation, Formal Analysis, Investigation, Methodology, Validation, Writing–original draft, Writing–review and editing. RZ: Conceptualization, Data curation, Methodology, Software, Writing–review and editing. MC: Conceptualization, Formal Analysis, Software, Writing–review and editing.
The author(s) declare that no financial support was received for the research, authorship, and/or publication of this article.
The authors would like to thank the support from the project “Research on the Operation Elements and Risk Management System of Electricity Market for Power Supply Guarantee” and the Business Research Project of State Grid Jiangsu Electric Power Co., Ltd., in 2023.
Authors YF, JF, BG, and YJ were employed by State Grid Jiangsu Electric Power Co., Ltd.
The remaining authors declare that the research was conducted in the absence of any commercial or financial relationships that could be construed as a potential conflict of interest.
All claims expressed in this article are solely those of the authors and do not necessarily represent those of their affiliated organizations, or those of the publisher, the editors and the reviewers. Any product that may be evaluated in this article, or claim that may be made by its manufacturer, is not guaranteed or endorsed by the publisher.
AlAshery, M. K., Xiao, D., and Qiao, W. (2020). Second-order stochastic dominance constraints for risk management of a wind power producer's optimal bidding strategy. IEEE Trans. Sustain. Energy 11 (3), 1404–1413. doi:10.1109/tste.2019.2927119
Baringo, L., and Conejo, A. J. (2016). Offering strategy of wind-power producer: a multi-stage risk-constrained approach. IEEE Trans. Power Syst. 31 (2), 1420–1429. doi:10.1109/tpwrs.2015.2411332
Batlle, C., and Barquın, J. (2004). Fuel prices scenario generation based on a multivariate GARCH model for risk analysis in a wholesale electricity market. Int. J. Electr. power & energy Syst. 26 (4), 273–280. doi:10.1016/j.ijepes.2003.10.007
Box, G. E. P., Jenkins, G. M., and Reinsel, G. C. (2008). Time series Analysis: forecasting and control. Hoboken, New Jersey, USA: John Wiley & Sons.
Daneshvar, M., Mohammadi-Ivatloo, B., Zare, K., Asadi, S., and Anvari-Moghaddam, A. (2020). A novel operational model for interconnected microgrids participation in transactive energy market: a hybrid IGDT/stochastic approach. IEEE Trans. Industrial Inf. 17 (6), 4025–4035. doi:10.1109/tii.2020.3012446
De la Nieta, A. A. S., Contreras, J., and Catalão, J. P. S. (2016). Optimal single wind hydro-pump storage bidding in day-ahead markets including bilateral contracts. IEEE Trans. Sustain. Energy 7 (3), 1284–1294. doi:10.1109/tste.2016.2544704
Deng, S., Xiao, D., Liang, Z., Chen, J., Huang, Y., and Chen, H. (2023). Information gap decision theory-based optimization of joint decision making for power producers participating in carbon and electricity markets. Energy Rep. 9, 74–81. doi:10.1016/j.egyr.2023.08.052
Dong, W., Chen, X., and Yang, Q. (2022). Data-driven scenario generation of renewable energy production based on controllable generative adversarial networks with interpretability. Appl. Energy 308, 118387. doi:10.1016/j.apenergy.2021.118387
Dupačová, J., Gröwe-Kuska, N., and Römisch, W. (2003). Scenario reduction in stochastic programming. Math. program. 95 (3), 493–511. doi:10.1007/s10107-002-0331-0
He, G., Chen, Q., Kang, C., Xia, Q., and Poolla, K. (2017). Cooperation of wind power and battery storage to provide frequency regulation in power markets. IEEE Trans. Power Syst. 32 (5), 3559–3568. doi:10.1109/tpwrs.2016.2644642
Hedman, K. W., and Sheble, G. B. (2006). “Comparing hedging methods for wind power: using pumped storage hydro units vs. Options purchasing,” in 9th Int. Conf. Probab. Methods Appl. Power Syst., Stockholm, Sweden, June, 2006, 1–6.
Heitsch, H., and Römisch, W. (2003). Scenario reduction algorithms in stochastic programming. Comput. Optim. Appl. 24, 187–206. doi:10.1023/a:1021805924152
Hu, J., and Li, H. (2022). A transfer learning-based scenario generation method for stochastic optimal scheduling of microgrid with newly-built wind farm. Renew. Energy 185, 1139–1151. doi:10.1016/j.renene.2021.12.110
Kaut, M. (2014). A copula-based heuristic for scenario generation. Comput. Manag. Sci. 11 (4), 503–516. doi:10.1007/s10287-013-0184-4
Kaut, M., and Wallace, S. W. (2007). Evaluation of scenario-generation methods for stochastic programming. Pac. J. Optim. 3 (2), 257–271. doi:10.18452/8296
Khodadadi, A., Söder, L., and Amelin, M. (2022). Stochastic adaptive robust approach for day-ahead energy market bidding strategies in hydro dominated sequential electricity markets. Sustain. Energy, Grids Netw. 32, 100827. doi:10.1016/j.segan.2022.100827
Krishna, A. B., and Abhyankar, A. R. (2023). Time-coupled day-ahead wind power scenario generation: a combined regular vine copula and variance reduction method. Energy 265, 126173. doi:10.1016/j.energy.2022.126173
Li, J., Wan, C., and Xu, Z. (2016). “Robust offering strategy for a wind power producer under uncertainties,” in 2016 IEEE Int. Conf. Smart Grid Commun., Sydney, Australia, November, 2016, 752–757.
Longin, F., and Solnik, B. (2001). Extreme correlation of international equity markets. J. Finance 56 (2), 649–676. doi:10.1111/0022-1082.00340
Morales, J. M., Mnguez, R., and Conejo, A. J. (2010). A methodology to generate statistically dependent wind speed scenarios. Appl. Energy 87 (3), 843–855. doi:10.1016/j.apenergy.2009.09.022
Morales, J. M., Pineda, S., Conejo, A. J., and Carrion, M. (2009). Scenario reduction for futures market trading in electricity markets. IEEE Trans. Power Syst. 24 (2), 878–888. doi:10.1109/tpwrs.2009.2016072
Rockafellar, R. T., and Uryasev, S. (2000). Optimization of conditional value-at-risk. J. Risk. 2 (3), 21–41. doi:10.21314/jor.2000.038
Roga, S., Bardhan, S., Kumar, Y., and Dubey, S. K. (2022). Recent technology and challenges of wind energy generation: a review. Sustain. Energy Technol. Assessments 52, 102239. doi:10.1016/j.seta.2022.102239
Saalfeld, A. (1999). Topologically consistent line simplification with the Douglas–Peucker algorithm. Cartogr. Geogr. Inf. Sci. 26 (1), 7–18. doi:10.1559/152304099782424901
Scott, D. W. (1992). Multivariate density estimation: theory practice and visualization. USA, NY, New York: Wiley.
Vagropoulos, S. I., Kardakos, E. G., Simoglou, C. K., Bakirtzis, A. G., and Catalao, J. P. (2016). ANN-based scenario generation methodology for stochastic variables of electric power systems. Electr. Power Syst. Res. 134, 9–18. doi:10.1016/j.epsr.2015.12.020
Wei, C., Wang, Y., Shen, Z., Xiao, D., Bai, X., and Chen, H. (2023). AUQ–ADMM algorithm-based peer-to-peer trading strategy in large-scale interconnected microgrid systems considering carbon trading. IEEE Syst. J., 1–12. doi:10.1109/JSYST.2023.3290775
Wu, H., Shahidehpour, M., Alabdulwahab, A., and Abusorrah, A. (2015). Demand response exchange in the stochastic day-ahead scheduling with variable renewable generation. IEEE Trans. Sustain. Energy 6 (2), 516–525. doi:10.1109/tste.2015.2390639
Xiao, D., Chen, H., Wei, C., and Bai, X. (2022). Statistical measure for risk-seeking stochastic wind power offering strategies in electricity markets. J. Mod. Power Syst. Clean Energy 10 (5), 1437–1442. doi:10.35833/mpce.2021.000218
Xiao, D., and Qiao, W. (2021). Hybrid scenario generation method for stochastic virtual bidding in electricity market. CSEE J. Power Energy Syst. 7 (6), 1312–1321. doi:10.17775/CSEEJPES.2021.00890
Yin, W. (2011). Gurobi mex: a MATLAB interface for Gurobi. Available: http://www.convexoptimization.com/wikimization/index.php/.
Keywords: terms--correlated parameters, electricity market, multivariate statistical method, stochastic optimization, wind power bidding
Citation: Feng Y, Fan J, Gao B, Jiang Y, Chen J, Zhang R and Chen M (2023) A multivariate statistical method for risk parameter scenario generation and renewable energy bidding in electricity markets. Front. Energy Res. 11:1326613. doi: 10.3389/fenrg.2023.1326613
Received: 23 October 2023; Accepted: 15 November 2023;
Published: 29 November 2023.
Edited by:
Hugo Morais, University of Lisbon, PortugalReviewed by:
Yuanshi Zhang, Southeast University, ChinaCopyright © 2023 Feng, Fan, Gao, Jiang, Chen, Zhang and Chen. This is an open-access article distributed under the terms of the Creative Commons Attribution License (CC BY). The use, distribution or reproduction in other forums is permitted, provided the original author(s) and the copyright owner(s) are credited and that the original publication in this journal is cited, in accordance with accepted academic practice. No use, distribution or reproduction is permitted which does not comply with these terms.
*Correspondence: Jianrun Chen, ZXBqcmNoZW5AbWFpbC5zY3V0LmVkdS5jbg==
Disclaimer: All claims expressed in this article are solely those of the authors and do not necessarily represent those of their affiliated organizations, or those of the publisher, the editors and the reviewers. Any product that may be evaluated in this article or claim that may be made by its manufacturer is not guaranteed or endorsed by the publisher.
Research integrity at Frontiers
Learn more about the work of our research integrity team to safeguard the quality of each article we publish.