 Zijun Liu1
 Honglei Jia
- 1New Smart City High-Quality Power Supply Joint Laboratory of China Southern Power Grid (Shenzhen Power Supply Co., Ltd.), Shenzhen, Guangdong Province, China
- 2College of Electrical and Information Engineering, Hunan University, Changsha, China
With the integration of large-scale nonlinear loads and distributed power sources into the grid, composite power quality disturbances (PQDs) events are becoming increasingly common, which significantly degrade the quality of power supply. Therefore, this paper focuses on studying the accurate classification of composite PQDs to mitigate the risk of power quality deterioration. However, traditional classification methods perform barely satisfactory in terms of accuracy and robustness in the classification of PQDs. To address these issues, this paper proposes a method for recognizing composite PQDs based on relative position matrix (RPM). Initially, utilizing the RPM method, the initial one-dimensional PQD time series data is transformed into two-dimensional image data while preserving its high-frequency characteristics. This process results in the creation of an informative and feature-rich image training set. Subsequently, an end-to-end framework for PQDs classification was developed. The framework utilizes convolutional neural networks to automatically extract multi-scale spatial and temporal features from image data. This design aims to automate the classification of composite PQDs, eliminating the need for labor-intensive manual signal processing and feature extraction. This integration ensures a more accurate and robust classification. Finally, the proposed method is tested on a case involving 30 types of PQDs at varying noise levels and compared with existing power quality disturbance classification methods, and results show that the proposed method has better performance than the previously established methods.
1 Introduction
Power quality issues encompass voltage and current waveform distortions, instability, and other anomalies in the electrical system, all of which have adverse effects on the normal operation of the power system and the performance of electrical equipment (Xu et al., 2019; Sahu et al., 2020). In the context of the evolving energy landscape, the widespread integration of distributed resources, and the extensive utilization of power electronic devices, power quality issues have gained increasing prominence. These issues may lead to power equipment damage, increased energy consumption, electromagnetic interference, and even power outages. The impact of power quality issues is particularly significant in sensitive equipment and critical areas, such as specialized equipment and precision manufacturing (Li et al., 2016; Zhang, 2023). As a result, the swift and precise identification and classification of power quality disturbances (PQDs) have become essential prerequisites to ensure the safe and stable operation of modern power systems and to drive the transition towards low-carbon energy sources (Huang et al., 2021; Cao et al., 2023).
Traditional signal detection for PQDs typically involves two independent fundamental steps: the extraction of features from the disturbance signal and the classification of the disturbance signal (Wang and Chen, 2019).
The feature extraction of disturbance signals aims to process and analyze the original PQDs signals to obtain low-dimensional feature vectors that reflect signal characteristics. Common feature extraction methods include Short-time Fourier transform (STFT), Wavelet transform (WT), s-transform, Hilbert-Huang transform (HHT), and others. These methods decompose and reconstruct continuous PQDS signals to obtain corresponding discrete time-domain or frequency-domain features. STFT is one of the most classical linear time-frequency analysis methods, known for its advantages of high spectral resolution and fast computation speed. However, it lacks local specificity in both the time and frequency domains, is sensitive to signal length and window selection, and can easily lead to issues such as spectral leakage and inadequate accuracy (Shukla et al., 2009). In contrast, WT overcomes the drawbacks of STFT, offering multi-time-scale analysis capabilities, simultaneous extraction of time and frequency domain features, and excellent time-frequency resolution, making it suitable for the analysis of steady-state disturbance signals (Shukla et al., 2009). Nevertheless, WT has its challenges, as it is sensitive to signal length and window selection, which can result in higher computational complexity (Thirumala et al., 2015; Thirumala et al., 2018). Another approach, the S-transform, extends and improves upon both WT and STFT. It employs movable and scalable Gaussian windows for localized signal analysis and exhibits strong noise resistance. However, it is less effective in detecting transient disturbances, such as oscillatory transients and pulse transients (Wang et al., 2021). HHT, on the other hand, is an adaptive time-frequency analysis method suitable for non-stationary and transient signal analysis (Wang et al., 2021), but it suffers from endpoint effects, leading to artifacts or distortion at the boundaries of signal analysis (Khetarpal and Tripathi, 2020). Moreover, the traditional feature extraction methods mentioned above require manual feature set selection, heavily relying on expert experience, and cannot meet the increasingly complex classification requirements for PQDs in modern power systems.
The classification of disturbance signals aims to categorize PQDS signals using the extracted feature vectors. Classification methods include traditional machine learning algorithms and deep learning algorithms, such as K-nearest neighbors (Gou et al., 2019), decision trees (Kotsiantis, 2013), support vector machines (Tang et al., 2020), neural networks (Cai et al., 2019), and more. These methods establish mapping relationships between feature vectors and corresponding classification labels to achieve the classification of disturbance signals. For example, reference (Zhu et al., 2019) proposes a hybrid algorithm that combines K-nearest neighbors with a fully convolutional Siamese network for classifying power quality disturbances by learning from small samples. In another approach, reference (Zhong et al., 2018) introduces a novel PQDs recognition algorithm based on time-frequency (TF) analysis and a decision tree classifier. In this method, feature statistics extracted by TF analysis are trained by the decision tree classifier to enable automatic PQDs classification. However, these methods require the manual selection of an appropriate classifier based on the chosen set of disturbance features to achieve the desired classification accuracy.
To address the challenges mentioned above, this paper proposes an advanced method that combines the Relative Position Matrix (RPM) and Convolutional Neural Network (CNN) for the effective classification of composite Power Quality Disturbances (PQDs). By integrating RPM and CNN, this method overcomes the limitations of feature observation and the complexity of operations in traditional classification methods. The main work of this paper is summarized as follows.
• Proposing a method based on RPM to transform the original one-dimensional PQD time series data into two-dimensional image data. This approach, while preserving the original high-frequency information, generates an information-rich and feature-rich image training set. Facilitating the automatic capture of inherent multi-scale spatial and temporal features in disturbances, this departure from traditional signal processing methods represents a crucial step in achieving the automation of the classification process.
• Propose a comprehensive end-to-end framework for PQD classification. Utilize a convolutional neural network to automatically extract multi-scale spatial and temporal features from image data, eliminating the need for tedious manual signal processing and feature extraction.
• Extensive simulation results verify the effectiveness of this method in identifying composite Power Quality Disturbances. Its performance was systematically evaluated in various noise environments. By rigorously comparing it with existing methods, we can conclude that this approach exhibits superior accuracy and robustness.
The remaining sections of this paper are organized as follows. In Section 2, the data sources and model framework are discussed. Section 3 provides a detailed presentation of the methodology, followed by the presentation of experimental results on the dataset in Section 4. Finally, Section 5 concludes the paper and outlines future work.
2 PQDs identification framework
2.1 Steps for recognizing compound PQDs classification based on RPM-CNN
The fundamental framework of the composite PQDs classification and recognition system based on RPM-CNN, as proposed in this paper, is depicted in Figure 1. It primarily comprises three steps, which are introduced in the following.
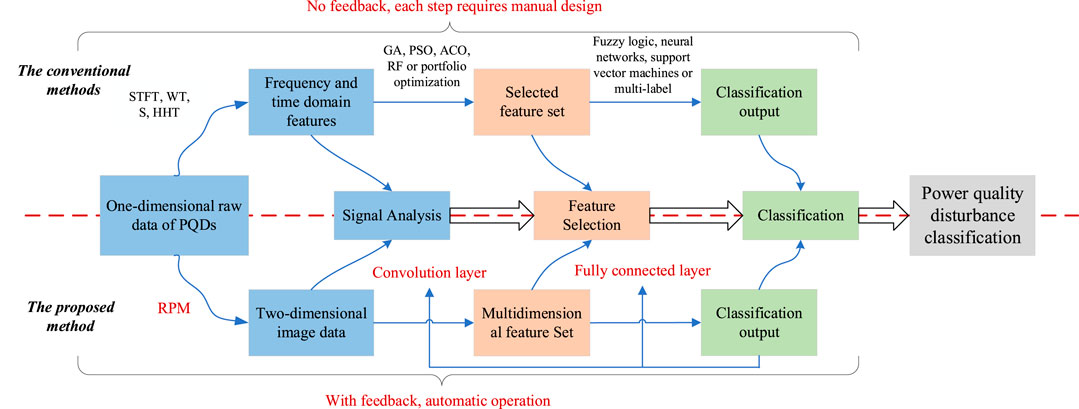
FIGURE 1. Framework comparison between the proposed method and traditional methods.
Step 1) Data Preprocessing. In this initial phase, diverse PQDs are systematically generated through numerical simulations in batches. Subsequently, the data undergoes RPM-based processing and is assigned appropriate labels. This approach transforms the raw time-series data of composite PQDs into two-dimensional image data while preserving crucial high-level features, thereby facilitating deep learning networks in uncovering potential correlated information within the dataset.
Step 2) Feature Extraction. Given the intricate nature and stochasticity of PQDs, multiple layers of convolutional kernels within neural networks are employed to analyze the nuances of periodic and subtle features present in the data. Subsequently, these features are mapped to a hidden feature space, thereby furnishing a more comprehensive depiction of the spatiotemporal characteristics inherent in the original time-series data of composite PQDs.
Step 3) Training the Classification Model. In this stage, careful consideration is given to a range of noise and disturbance combinations. Utilizing the first two fully connected layers, the extracted features are merged and abstracted, progressively elevating low-level features to high-level semantic features. The ultimate fully connected layer, post-application of the softmax function, transforms these features into a probability distribution for classifying distinct categories of PQDs. Furthermore, a validation set is employed to conduct specialized model validation, ensuring both its generalization capacity and high-precision recognition performance.
2.2 Mathematical model of PQDs
To address the challenge of acquiring a substantial amount of data for the model training process, this study generated training and testing datasets in accordance with the IEEE Std 1,159–2019 (Std, 2019) electrical power quality disturbance standard. These datasets encompass eight distinct types of single disturbances, comprising voltage sags, voltage swells, voltage interruptions, voltage fluctuations, harmonics, notches, oscillations, and pulses, alongside twenty-two types of compound disturbances. The mathematical model for electrical power quality disturbances and their corresponding signals are generated using the aforementioned method. Table 1 presents the mathematical model, while Figure 2 displays the waveforms of single electrical power quality disturbances.
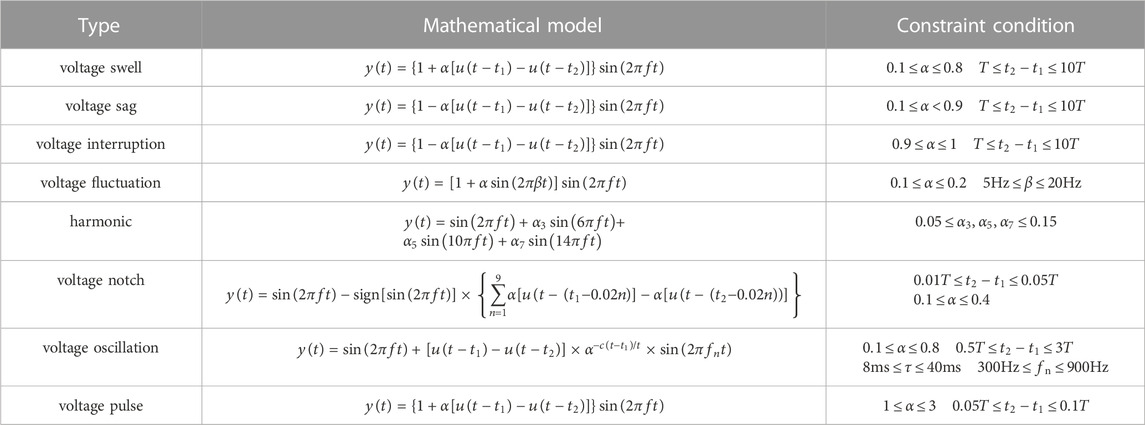
TABLE 1. Classification of power quality disturbances and their mathematical models.
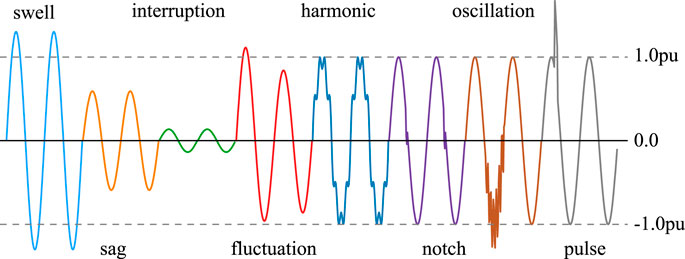
FIGURE 2. Waveform diagram of a single power quality disturbance.
3 Classification method based on RPM-CNN
3.1 RPM implementation: Process & results
RPM is a technique for transforming raw one-dimensional time series data into two-dimensional image data (Chen and Shi, 2019). Consider a set of original voltage data
Here,
Next, the piecewise aggregate approximation (PAA) method is employed to reduce the dimensionality of
Here,
Next, an
Clearly,
Finally, min-max normalization is applied to transform
Figure 1 illustrates the original time-series data of voltage sag alongside the image generated by RPM. For further related data, please consult Figure A1. These images convey valuable information about the original time series data. For instance, dark areas in the images represent lower values in the original time series, while light areas indicate higher values. Solid regions suggest little or slow changes in the original time series values. The frequency of color transitions, from dark to bright or vice versa, represents the waveform of the original time series. Simultaneously, the RPM offers a reverse perspective for analyzing original time series data by constructing a matrix in which elements on either side of the diagonal oppose each other. Therefore, the patterns and features embedded in the original time series data are better preserved in these transformed images. This characteristic streamlines subsequent feature extraction tasks. As demonstrated in Figure 3, the images produced by RPM facilitate easy visual observation and interpretation of both intra-class and inter-class similarities. Furthermore, it successfully circumvents the issue of insufficient feature extraction that arises from directly applying raw time series data in deep learning.
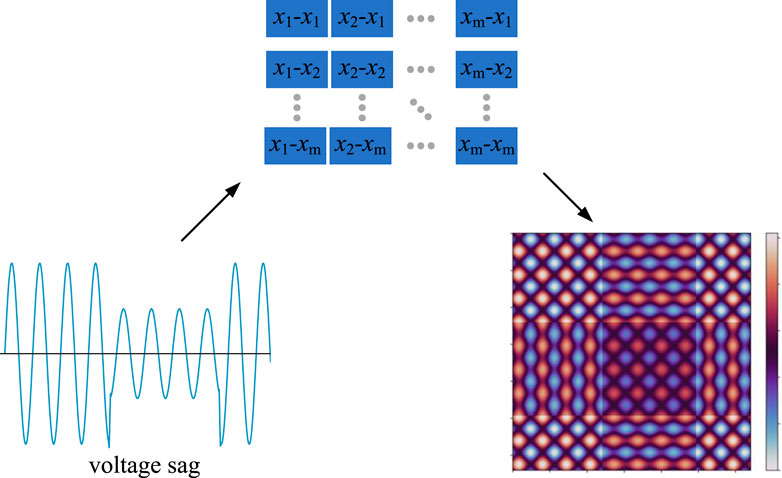
FIGURE 3. RPM transformation process.
3.2 Deep learning stages in RPM-CNN
3.2.1 Specific architecture of the CNN
CNN typically consists of several key components, including the input layer, convolutional layers, pooling layers, activation function layers, fully connected layers, and output layers. Using convolution operations, CNN efficiently extracts features from images, facilitating the stepwise extraction and combination of features. This approach enables advanced feature extraction and image classification with high robustness and accuracy.
This paper establishes a neural network for classifying composite PQDs (Fawaz et al., 2020). The network trains an end-to-end convolutional neural network for image feature extraction and classification. The network architecture comprises a total of 7 layers, which include 5 convolutional layers, 1 global average pooling (GAP) layer, and 1 fully connected (FC) layer. To prevent the blurring effect associated with average pooling, the network exclusively utilizes max-pooling. Furthermore, the stride is set smaller than the size of the pooling kernel, leading to overlap and coverage between the outputs of pooling layers, thus enhancing feature richness. Additionally, to mitigate potential challenges faced by traditional ReLU activation functions, we employ the LeakyReLU function. This choice effectively addresses issues like neuron inactivity, gradient explosion, and gradient vanishing, which might compromise the neural network’s performance. This activation function exhibits superior generalization capabilities, more stable gradient propagation, and faster computational speed.
In the design of the deep CNN network for PQDs, three critical factors are considered.
(1) The occurrence and duration of PQDs are random, requiring the DNN to monitor the entire input cycle effectively. This means the network must analyze the complete time range of the input signal to promptly detect and handle PQDs events.
(2) PQDs exhibit complex characteristics, and even disturbances of the same type have significant differences. Thus, the post-trained network must possess strong generalization capabilities and robust noise resistance to adapt to real-world scenarios with various noise levels and PQDs types.
(3) Some disturbances display global periodic characteristics, while others contain detailed features within local sampling intervals. Therefore, the network design should effectively capture both global information and local details to improve PQDs event identification and differentiation
3.2.2 Strategies for overcoming overfitting
In the deep CNN proposed in this paper, renowned for its robust feature extraction and classification capabilities, the challenge of overfitting the training data is frequently encountered. To mitigate this issue, advanced techniques have been employed in both the network architecture and training process.
(1) Batch Normalization (BN): BN is an effective technique for optimizing neural networks. It normalizes the input data for each layer, mitigating gradient issues and making deep networks more trainable (Ioffe and Szegedy, 2015). This approach reduces inter-layer coupling, speeds up model training, allows for larger learning rates, accelerates convergence, and reduces sensitivity to hyperparameters. It also enhances the model’s generalization capability, making it more robust to input variations and improving performance on the test set. Additionally, BN has a regularizing effect, reducing the reliance on Dropout and aiding in overfitting prevention. By enabling the use of deeper networks, Batch Normalization further increases the model’s representational capacity, enhancing overall performance.
(2) Dynamic Learning Rate and Early Stopping Strategy: The use of adaptive learning rate adjustment techniques can expedite convergence, prevent getting stuck in local optima, and enhance the model’s generalization capability. The early stopping strategy is applied to monitor the performance of the validation set, preventing overfitting, improving training efficiency, and simplifying the model selection process. Combining these two strategies leads to more efficient training. Specifically, if the loss value does not decrease for five consecutive epochs, the learning rate is halved. If the loss value remains unchanged for ten consecutive epochs, early termination of training is employed to prevent overfitting.
(3) Global Average Pooling (GAP), as a technique that replaces Fully Connected layers, notably reduces the number of parameters and complexity within deep neural networks, thereby enhancing the model’s generalization capacity (B. et al., 2016). By applying average pooling across the entire feature map, GAP adeptly captures the global information of the image, effectively mitigating the risk of overfitting and enhancing the model’s spatial invariance to input. This alternative approach not only reduces computational expenses but also alleviates potential overfitting concerns, delivering a more universally applicable solution for deep learning tasks.
Figure 4 provides a visual representation of the process of feature extraction and transformation from disturbance samples using the proposed units.
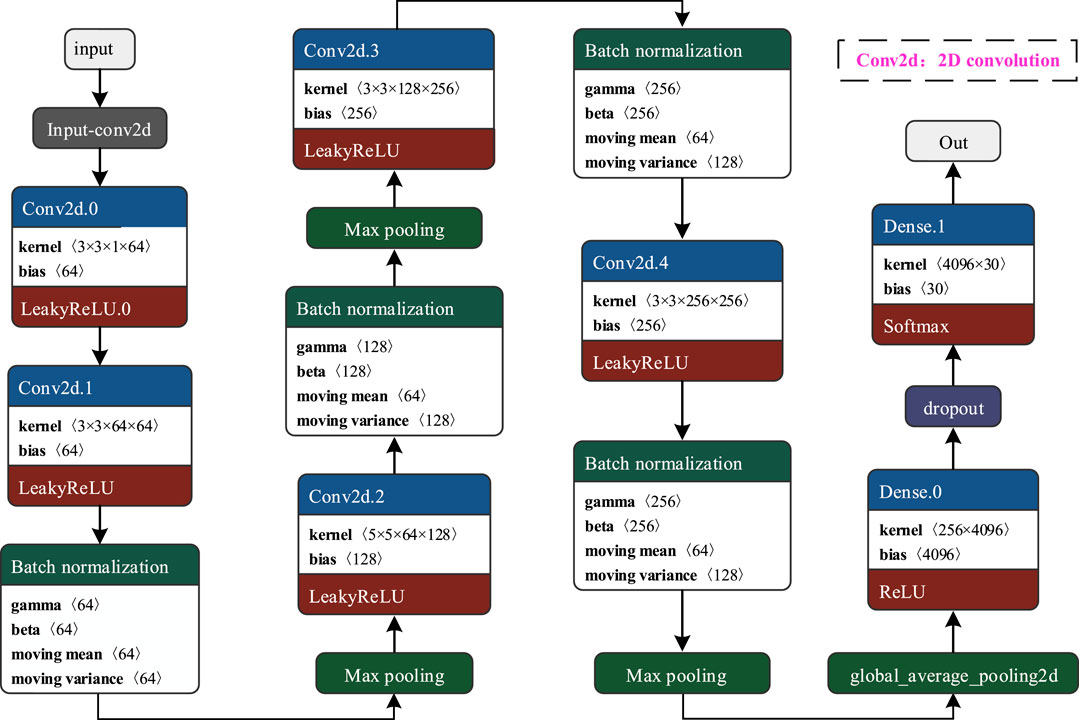
FIGURE 4. The neural network model architecture in this paper.
4 Results and discussion
4.1 Generation of PQDs image data
In this study, utilizing the IEEE Std 1,159–2019 power quality disturbance model as the foundation, a total of 30 types of disturbance signals are generated using MATLAB software. These signals encompass 8 categories of single disturbances and 22 categories of double disturbances. Detailed parameters can be found in Table 1, with 1,000 sets of signal data generated for each disturbance category. The fundamental frequency of composite PQDs is set at 50Hz, with a sampling frequency of 3200 Hz. The sampling duration covers 10 cycles, resulting in a total of 640 sampling points. During the training process, cross-validation is employed, with the dataset split into a training set and a validation set in a 4:1 ratio. The best model is determined based on the classification accuracy on the validation set and saved accordingly.
In this study, the model is constructed using the Keras framework in Python for deep learning training and classification. Table 2 provides a list of hardware models along with their corresponding software versions.
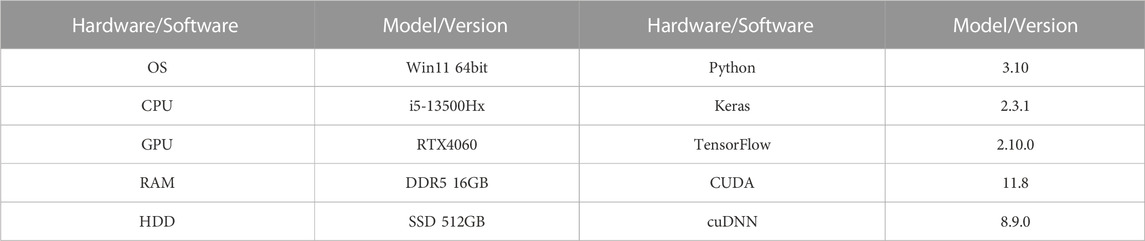
TABLE 2. Hardware models and software versions.
4.2 Training results analysis
The network was trained using the data generated in Section 3.1. Figure 5 illustrates the loss and performance curves during model training. Initially, the noiseless model displayed relatively low accuracy and some oscillations. However, after approximately 20 training epochs, both training accuracy and validation accuracy began to stabilize and steadily increase, signifying network convergence and eventually reaching 99.3%. The loss and accuracy curves for both the training and validation sets followed a similar trajectory, indicating that the network operated smoothly without any indications of underfitting or overfitting. These results suggest that the network’s complexity in this paper is moderate and appropriately captures the training data, allowing it to generalize well to both the training and unseen test data.
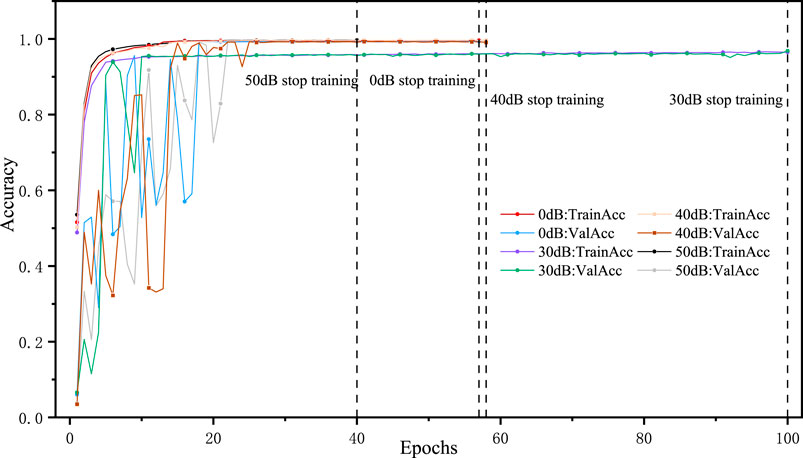
FIGURE 5. Training and validation accuracy of PQDS classification under various noise environments.
4.3 Optimization strategy testing
This section evaluates the impact of incorporating Batch Normalization (BN) and Global Average Pooling (GAP) layers on the training performance of the model. For the comparative analysis, the “model without BN layers” refers to the direct removal of BN layers from the original network, whereas the “model without GAP layers” replaces the GAP layer with a fully connected layer. The initial network structure used is derived from Figure 4. Figure 6 displays the training accuracy and loss of the three neural networks throughout the entire training process, while Figure 7 showcases the final training results of these three networks.
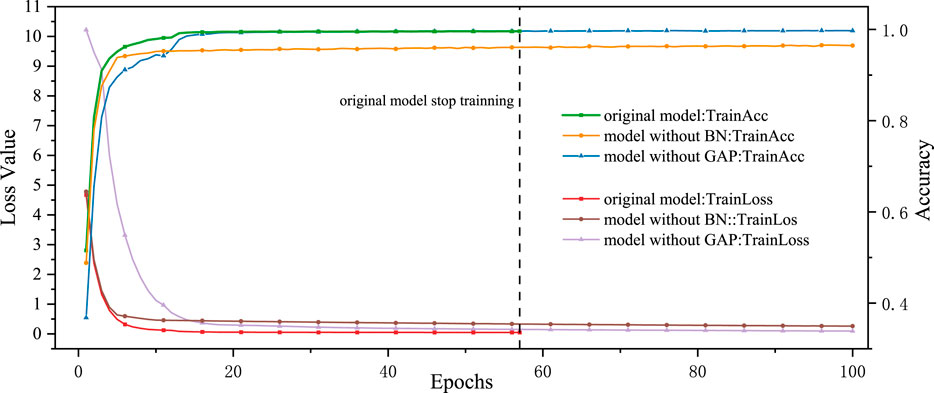
FIGURE 6. The training process of CNN models using different improvement strategies.
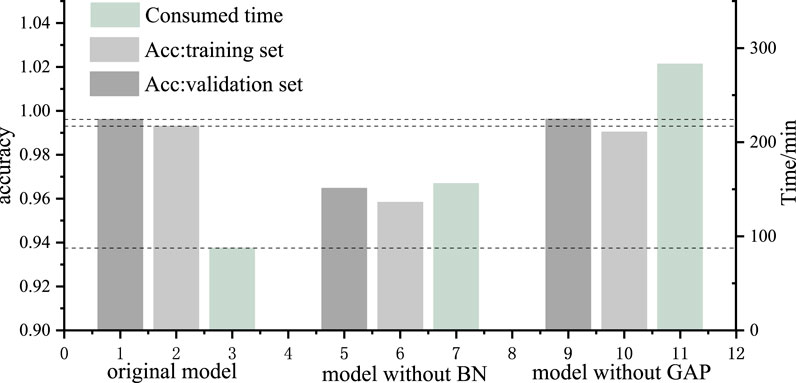
FIGURE 7. PQDs classification results of CNN using different improvement strategies.
Figures 6, 7 illustrate that the network presented in this paper, equipped with BN layers, outperforms the model without BN concerning both training time and accuracy. This underscores that the inclusion of BN layers effectively enhances the model’s generalization capabilities, rendering it more robust and expediting convergence. Simultaneously, the model without GAP, despite delivering commendable accuracy, demands significantly more training time when compared to the model featuring GAP. This unambiguously underscores the substantial reduction in computational cost achieved through the incorporation of the GAP layer. Consequently, for the design of networks targeting PQDs classification tasks, it is advisable to incorporate both BN and GAP layers to augment performance.
4.4 Noise robustness testing
To assess the effectiveness of our proposed method in terms of its ability to withstand noise, we introduced Gaussian white noise with signal-to-noise ratios of 50dB, 40dB, and 30dB to the dataset and conducted classification training. In high-noise environments, PQDS signals are subject to distortion due to the superimposition of multiple noise components. The presence of nonlinear responses and feature interactions presents significant challenges for our model when dealing with composite disturbances, exacerbating their combined effects.
To illustrate this point, we have provided Figure 5 which showcases the training and validation accuracy of our model under various noise environments. We have also presented Table 3 which provides a comprehensive overview of the model’s performance on a new test set. The table shows that certain composite disturbances, such as those involving oscillations and gaps, exhibit reduced accuracy compared to their single counterparts. Notably, the recognition accuracy for the “Oscillation + Notch” composite disturbance reaches its lowest point at 88.94%. This reduction in accuracy can be attributed to the simultaneous presence of oscillations and gaps, which leads to feature blurring in the gap region and consequently affects the model’s recognition accuracy.
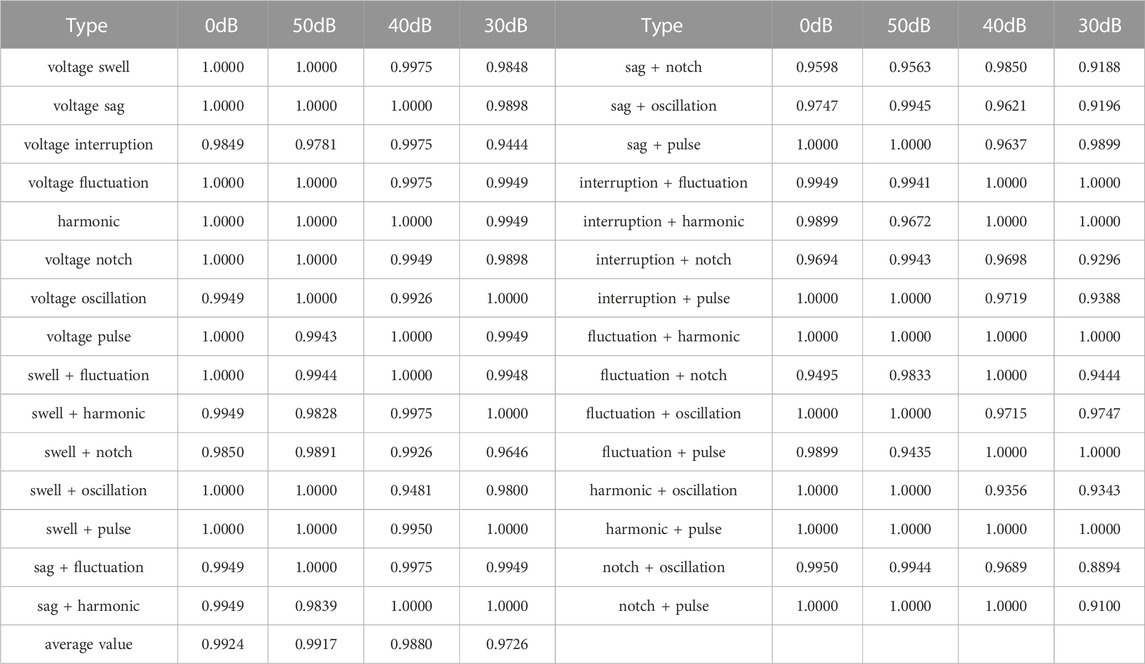
TABLE 3. Network test results in different noise environments.
However, overall, the model proposed in this paper achieved average classification accuracies of 99.17%, 98.80%, and 97.26% for PQDs in high-noise environments with signal-to-noise ratios of 50dB, 40dB, and 30dB, respectively. This demonstrates that the model maintains a high PQDs classification accuracy in high-noise environments and exhibits good noise robustness.
4.5 Comparison with existing methods
As demonstrated in Table 4, under noise-free, low-noise, and high-noise conditions, the proposed algorithm outperforms other algorithms in terms of recognition categories and classification accuracy. Particularly in high-noise conditions (30 dB), the algorithm exhibits significantly improved noise resistance, attributed to the training set augmented with artificially added noise signals. Furthermore, the closed-loop feedback structure of the network and its automatic feature selection capability accurately extract the most crucial features associated with various disturbances, consequently enhancing PQDS recognition accuracy significantly.
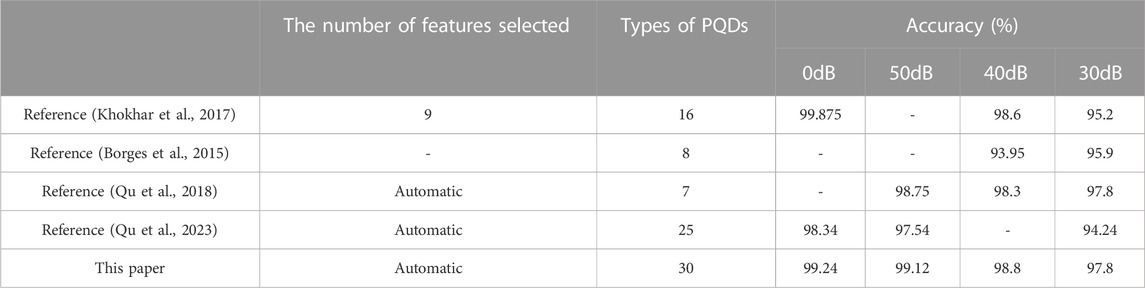
TABLE 4. Comparison with existing methods.
5 Conclusion
This paper first introduces a method for classifying composite PQDs based on RPM and CNN. It maps the initial one-dimensional PQDs time-series data into two-dimensional image data using the RPM method while preserving their high-frequency characteristics. Then, the image data are employed as input for the specially designed convolutional neural network. Leveraging the CNN’s closed-loop structure and automatic feature selection capabilities, it achieves high-precision classification of composite PQDs without the tedious manual signal processing and feature extraction work. Finally, the proposed method is compared with the existing methodologies through testing 30 distinct composite power quality disturbance events, the results indicate that it performs better than other methods in terms of classification accuracy, noise resilience, and generalization capability. As for future work, it is suggested to focus on the research of more intricate composite PQDs classification and improvement of computation efficiency.
Data availability statement
The original contributions presented in the study are included in the article/Supplementary material, further inquiries can be directed to the corresponding author.
Author contributions
ZLi: Writing–original draft, Methodology. HZ: Software, Writing–review and editing. ZLv: Data curation, Writing–review and editing. HJ: Writing–original draft, Writing–review and editing. XL: Funding acquisition, Supervision, Writing–review and editing. QW: Visualization, Writing–review and editing.
Funding
The author(s) declare financial support was received for the research, authorship, and/or publication of this article. Science and Technology Project of China Southern Power Grid (090000KK52222133/SZKJXM20222115).
Conflict of interest
Authors ZLi, HZ, ZLv, XL, and QW were employed by New Smart City High-Quality Power Supply Joint Laboratory of China Southern Power Grid (Shenzhen Power Supply Co., Ltd.).
The remaining author declares that the research was conducted in the absence of any commercial or financial relationships that could be construed as a potential conflict of interest.
Publisher’s note
All claims expressed in this article are solely those of the authors and do not necessarily represent those of their affiliated organizations, or those of the publisher, the editors and the reviewers. Any product that may be evaluated in this article, or claim that may be made by its manufacturer, is not guaranteed or endorsed by the publisher.
References
Borges, F. A., Fernandes, R. A., Silva, I. N., and Silva, C. B. (2015). Feature extraction and power quality disturbances classification using smart meters signals. IEEE Trans. Ind. Inf. 12 (2), 824–833. doi:10.1109/tii.2015.2486379
Cai, K. W., Cao, W. P., Aarniovuori, L., Pang, H. S., Lin, Y. S., and Li, G. F. (2019). Classification of power quality disturbances using wigner-ville distribution and deep convolutional neural networks. IEEE Access 7, 119099–119109. doi:10.1109/ACCESS.2019.2937193
Cao, Y., Zhou, B., Chung, C. Y., Shuai, Z., Hua, Z., and Sun, Y. (2023). Dynamic modelling and mutual coordination of electricity and watershed networks for spatio-temporal operational flexibility enhancement under rainy climates. IEEE Trans. Smart Grid 14 (5), 3450–3464. doi:10.1109/TSG.2022.3223877
Chen, W., and Shi, K. (2019). A deep learning framework for time series classification using relative position matrix and convolutional neural network. Neurocomputing 359, 384–394. doi:10.1016/j.neucom.2019.06.032
Fawaz, H. I., Lucas, B., Forestier, G., Pelletier, C., Schmidt, D. F., Weber, J., et al. (2020). Inceptiontime: finding alexnet for time series classification. Data Min. Knowl. Discov. 34 (6), 1936–1962. doi:10.1007/s10618-020-00710-y
Gou, J. P., Ma, H. X., Ou, W. H., Zeng, S. N., Rao, Y. B., and Yang, H. B. (2019). A generalized mean distance-based k-nearest neighbor classifier. Expert Syst. Appl. 115, 356–372. doi:10.1016/j.eswa.2018.08.021
Huang, Y., Ding, T., Li, Y., Li, L., Chi, F., Wang, K., et al. (2021). Decarbonization technologies and inspirations for the development of novel power systems in the context of carbon neutrality. Proc. CSEE 41 (S1), 28–51. doi:10.13334/j.0258-8013.pcsee.211016
Ioffe, S., and Szegedy, C. (2015). “Batch normalization: accelerating deep network training by reducing internal covariate shift,” in International conference on machine learning, vol 37. Editors F. Bach, and D. Blei, 448–456. (32nd International Conference on Machine Learning).
Khetarpal, P., and Tripathi, M. M. (2020). A critical and comprehensive review on power quality disturbance detection and classification. Sust. Comput. 28, 100417. doi:10.1016/j.suscom.2020.100417
Khokhar, S., Zin, A. A. M., Memon, A. P., and Mokhtar, A. S. (2017). A new optimal feature selection algorithm for classification of power quality disturbances using discrete wavelet transform and probabilistic neural network. Measurement 95, 246–259. doi:10.1016/j.measurement.2016.10.013
Kotsiantis, S. B. (2013). Decision trees: a recent overview. Artif. Intell. Rev. 39 (4), 261–283. doi:10.1007/s10462-011-9272-4
Li, J. M., Teng, Z. S., Tang, Q., and Song, J. H. (2016). Detection and classification of power quality disturbances using double resolution s-transform and dag-svms. IEEE Trans. Instrum. Meas. 65 (10), 2302–2312. doi:10.1109/TIM.2016.2578518
Qu, H., Li, K., Yang, W., Dong, Y., Song, Z., Fan, W., et al. (2023). Power quality compound disturbance identification based on dual channel GAF and depth residual network. Power Syst. Technol. 47 (1), 369–379. doi:10.13335/j.1000-3673.pst.2022.0644
Qu, H., Li, X., Chen, C., and He, L. (2018). Classification of power quality disturbances using convolutional neural network. Eng. J. Wuhan Univ. 51 (6), 534–539. doi:10.14188/j.1671-8844.2018-06-011
Sahu, G., Dash, S., and Biswal, B. (2020). Time-frequency analysis of power quality disturbances using synchroextracting transform. Int. Trans. Electr. Energy Syst. 30 (4). doi:10.1002/2050-7038.12278
Shukla, S., Mishra, S., and Singh, B. (2009). Empirical-mode decomposition with hilbert transform for power-quality assessment. IEEE Trans. Power Deliv. 24 (4), 2159–2165. doi:10.1109/TPWRD.2009.2028792
Std, I. (2019). “Ieee recommended practice for monitoring electric power quality,” in IEEE Std 1159-2019 (revision of IEEE Std 1159-2009), 1–98. doi:10.1109/IEEESTD.2019.8796486
Tang, Q., Qiu, W., and Zhou, Y. C. (2020). Classification of complex power quality disturbances using optimized s-transform and kernel svm. IEEE Trans. Ind. Electron. 67 (11), 9715–9723. doi:10.1109/TIE.2019.2952823
Thirumala, K., Prasad, M. S., Jain, T., and Umarikar, A. C. (2018). Tunable-q wavelet transform and dual multiclass svm for online automatic detection of power quality disturbances. IEEE Trans. Smart Grid 9 (4), 3018–3028. doi:10.1109/TSG.2016.2624313
Thirumala, K., Umarikar, A. C., and Jain, T. (2015). Estimation of single-phase and three-phase power-quality indices using empirical wavelet transform. IEEE Trans. Power Deliv. 30 (1), 445–454. doi:10.1109/TPWRD.2014.2355296
Wang, F., Quan, X., and Ren, L. (2021). Review of power quality disturbance detection and identification methods. Proc. CSEE 41 (12), 4104–4121. doi:10.13334/j.0258-8013.pcsee.201261
Wang, S. X., and Chen, H. W. (2019). A novel deep learning method for the classification of power quality disturbances using deep convolutional neural network. Appl. Energy 235, 1126–1140. doi:10.1016/j.apenergy.2018.09.160
Xu, L., Li, K., Luo, Y., Xiao, X., Zhang, C., and Cai, D. (2019). Classification of complex power quality disturbances based on incomplete S-transform and gradient boosting decision tree. Power Syst. Prot. Control 47 (6), 24–31. doi:10.7667/PSPC180414
Zhang, C., Liu, Q., Zhou, B., Chung, C. Y., Li, J., Zhu, L., et al. (2023). A central limit theorem-based method for dc and ac power flow analysis under interval uncertainty of renewable power generation. IEEE Trans. Sustain. Energy 14 (1), 563–575. doi:10.1109/TSTE.2022.3220567
Zhong, T., Zhang, S., Cai, G. W., and Huang, N. T. (2018). Power-quality disturbance recognition based on time-frequency analysis and decision tree. IET Gener. Transm. Distrib. 12 (18), 4153–4162. doi:10.1049/iet-gtd.2018.5780
Zhou, B., Khosla, A., Lapedriza, A., Oliva, A., and Torralba, A. (2016). “Learning deep features for discriminative localization,” in 2016 IEEE Conference on Computer Vision and Pattern Recognition (CVPR), Las Vegas, NV, USA, June 30 2016, 2921–2929. doi:10.1109/CVPR.2016.319
Zhu, R. J., Gong, X. J., Hu, S. F., and Wang, Y. S. (2019). Power quality disturbances classification via fully-convolutional siamese network and k-nearest neighbor. Energies 12 (24), 4732. doi:10.3390/en12244732
Appendix A
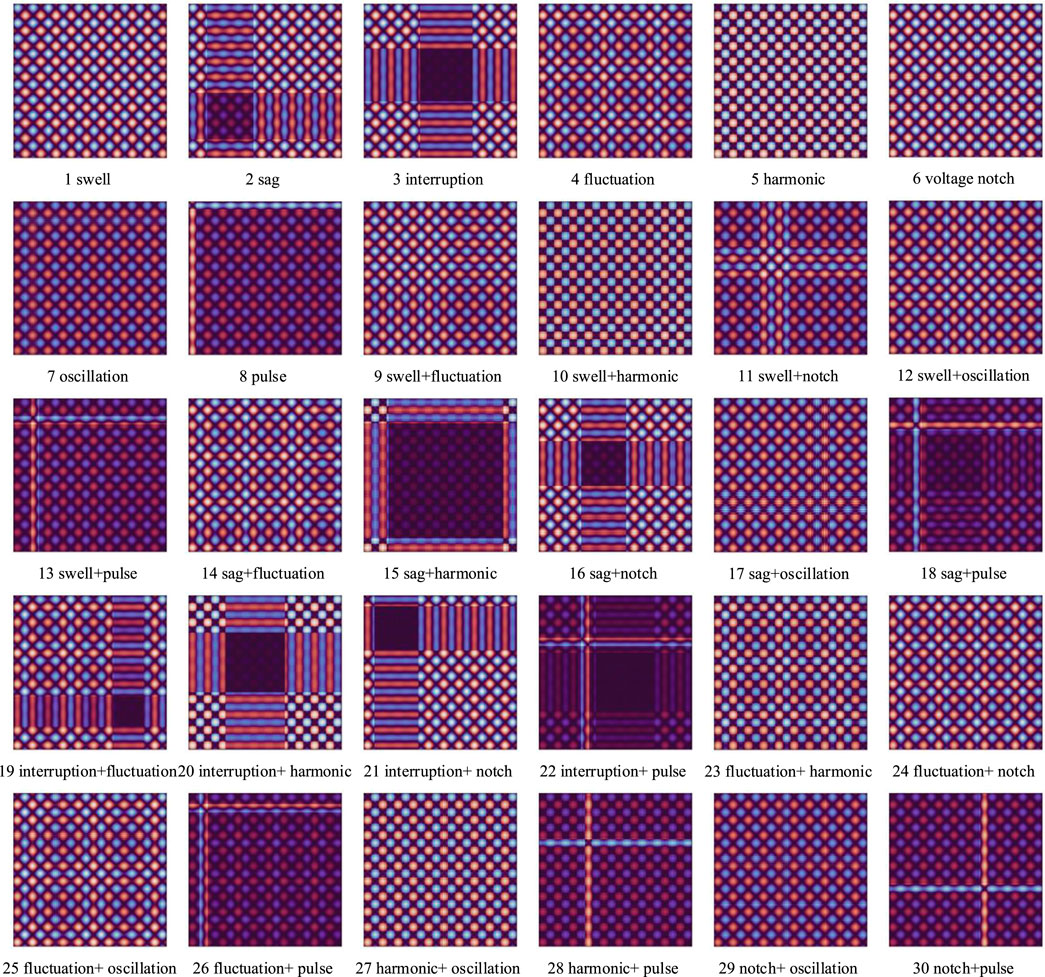
FIGURE A1. The two-dimensional mapping results obtained using RPM correspond to each type of PQDs.
Keywords: power quality, relative position matrix, convolutional neural network, feature extraction, time series data classification
Citation: Liu Z, Zhang H, Lv Z, Jia H, Liang X and Wang Q (2024) Identification of composite power quality disturbances based on relative position matrix. Front. Energy Res. 11:1326522. doi: 10.3389/fenrg.2023.1326522
Received: 23 October 2023; Accepted: 06 December 2023;
Published: 05 January 2024.
Edited by:
Yonghui Liu, Hong Kong Polytechnic University, Hong Kong SAR, ChinaReviewed by:
Weike Mo, Jinan University, ChinaXu Xu, Xi’an Jiaotong-Liverpool University, China
Feixiong Chen, Fuzhou University, China
Copyright © 2024 Liu, Zhang, Lv, Jia, Liang and Wang. This is an open-access article distributed under the terms of the Creative Commons Attribution License (CC BY). The use, distribution or reproduction in other forums is permitted, provided the original author(s) and the copyright owner(s) are credited and that the original publication in this journal is cited, in accordance with accepted academic practice. No use, distribution or reproduction is permitted which does not comply with these terms.
*Correspondence: Honglei Jia, amhseUBobnUuZWR1LmNu