 Bing Kang
 Zhihao Xu1,2,4*
94% of researchers rate our articles as excellent or good
Learn more about the work of our research integrity team to safeguard the quality of each article we publish.
Find out more
ORIGINAL RESEARCH article
Front. Energy Res. , 03 January 2024
Sec. Sustainable Energy Systems
Volume 11 - 2023 | https://doi.org/10.3389/fenrg.2023.1326257
This article is part of the Research Topic Smart Energy System for Carbon Reduction and Energy Saving: Planning, Operation and Equipments View all 42 articles
Accurate differentiation of energy consumption information of residential users is of great significance for load planning, scheduling, operation and management of power system, and is the basic premise for realizing intelligent perception of energy system and energy saving and carbon reduction. Considering that the conventional single-layer clustering method has limited clustering stability and clustering effect, this paper takes the key family feature factors as the modified feature quantity of quadratic clustering, and proposes a study of user energy characteristics based on double-layer clustering and modification. Firstly, the user’s energy consumption data is collected and pre-processed, and the user’s energy consumption curve is clustered and analyzed by using the integrated clustering algorithm based on voting and the advantages of each member algorithm. Then, the key family characteristic factors are obtained, and the results of one-layer clustering and key family characteristic factors are combined to carry out two-layer clustering of the same category of users in the form of questionnaire survey. Finally, the nonlinear mapping capability of Support Vector Machine (SVM) is used to reverse correct the results of the one-layer clustering. The actual algorithm data of the residents’ demand response experiment in a southeastern province are compared. The results show that compared with the single-layer clustering algorithm, the proposed method can accurately distinguish the energy consumption characteristics and adjustable potential of different users, and correct the wrong clustering results in the single-layer clustering. The clustering stability and clustering effect have been effectively improved.The example results show that the clustering results modified by SVM can better mine and distinguish user energy characteristics, and can be used to solve the problem of the current demand response clustering algorithm not being able to comprehensively and objectively describe the participation willingness and response-ability of residential users in the implementation process. It can also provide a basis for peak shaving and power grid frequency regulation.
With the continuous development of the smart grid and social economy, only studying user electricity consumption data can no longer meet the needs of the refined development of the electricity market. In the context of power big data, simply increasing the supply-side capacity to meet the growing user load and peak electricity demand will cause a series of problems, such as low annual utilization hours of power generation and transmission equipment, high cost, and waste of social resources (Liu et al., 2014; Xu et al., 2023). Although the proportion of users participating in demand response is increasing year by year, due to the large number of participating users and complex load types, it is difficult to accurately distinguish and predict the energy use information and response potential of users (Xu et al., 2018; Li et al., 2022), resulting in an unsatisfactory effect of demand response, which has had a significant impact on the economy and life of both supply and demand. Therefore, on account of the two aspects, namely, user electricity consumption data and user household characteristics, analyzing user energy consumption behavior can achieve precise differentiation of load regulation potential for user energy consumption characteristics and demand response.
Clustering is an unsupervised learning technique in data mining that can be used to cluster load characteristics and achieve potential analysis of demand response resources. Cai (2023) proposed a bad data recognition and correction method based on the combination of statistical models and curve similarity to preprocess user load data. Then, user load patterns are extracted using a stack autoencoder and clustered user behavior analysis, thereby improving the availability and clustering accuracy of the dataset and making user energy behavior analysis more accurate. Liu et al. (2016) combined the structure, characteristics, and trends of user energy consumption in Gansu Province to identify potential users of electricity substitution. It thus implements the electricity substitution strategy of “replacing coal with electricity, oil with electricity, and gas with electricity” to solve the problem of abandoning wind and light. Based on the existing research on user-side load classification, Zheng et al. (2022) proposed a method of classifying load-side resources from the perspective of energy supply and consumption attributes, analyzed typical loads and characteristics of different energy supply attributes, and established a load resource library for various user attributes in demand response. Lu and Wang (2021) proposed a data mining method for classifying large users’ electricity consumption characteristics. This method can calculate the centralized power consumption of large users, and at the same time, the behavior pattern characteristics of users can be extracted in a directional manner, and power resources can be allocated according to demand. Li et al. (2021) proposed a user electricity behavior detection method based on singular spectrum analysis, which involves performing singular spectrum analysis on the user’s electricity behavior before and after the detection point. Accurate judgment of electricity behavioral changes can be achieved by calculating the cosine value of the angle between the singular value vector and the historical feature hyperplane. Zhang et al. (2020) established a Bayesian regularized self-organizing map (SOM) clustering model to analyze distribution networks’ short-term load electricity consumption behavior, and the results obtained have high accuracy. Zhao et al. (2019) studied various dimensionality reduction techniques for power load data, sampled, clustered, and analyzed the load data after dimensionality reduction. A comparison of various methods shows that the integrated clustering algorithm based on principal component analysis (PCA) dimensionality reduction performs best. Yang et al. (2022a) conducted a pioneering study on security-constrained unit commitment (SCUC) problems, proposing an expanded sequence-to-sequence (E-Seq2Seq)-based data-driven SCUC expert system for dynamic multiple-sequence mapping samples; it can accommodate the mapping samples of SCUC and consider the various input factors that affect SCUC decision-making, possessing strong generality, high solution accuracy, and efficiency over traditional methods.
Lei et al. (2023) used the optimized fuzzy C-means algorithm to realize cluster analysis, and the feature model is established through the cluster center so as to overcome the problem of quantity selection and feature selection of the diversity user division of the existing distribution station area. Yang et al. (2022b) summarized the basic mathematical model of the standard SCUC, and the characteristics and application scopes of common solution algorithms are presented. Customized models focusing on diverse mathematical properties are then categorized, and the corresponding solving methodologies are discussed. Yang et al. (2021) proposed a data-driven (DD) SCUC decision-making method, which processes historical user load data based on the k-means algorithm, and used the processed data samples to realize the pioneering role of the DL algorithm in solving SCUC problems. Fu et al. (2023) and Zhang et al. (2023) proposed a generative adversarial network and a distributed double consistency algorithm to enhance power data and process data consistency. (Yu and Xiao, 2021; Zhu et al., 2022) selected independent and effective power consumption characteristics from the existing common power consumption characteristics set to construct the optimal feature set. On this basis, the improved K-means clustering algorithm is used to analyze the user’s power consumption pattern by combining the preferred feature set. The results show that the complexity of the calculation can be reduced while ensuring the clustering accuracy.
In the above literature, when considering the clustering of users' energy consumption characteristics, most of them are based on the user’s electricity consumption data for load analysis (Sun et al., 2021; Li et al., 2023). In response to the above phenomenon, this article proposes a two-level clustering and correction method that comprehensively considers user electricity characteristics and key features. It uses the advantages of integrated clustering and fusion of multiple member algorithms to perform a layer of clustering on user electricity data. Based on the results of the layer of clustering, combined with the user’s key family information, multi-dimensional information clustering of users is achieved. Finally, the nonlinear mapping ability of SVM is used to reverse-correct the clustering layer results and achieve precise differentiation of energy consumption characteristics and regulatory potential among different users.
Integrated clustering is an unsupervised learning method that effectively combines the advantages of multiple-member algorithms (Fu et al., 2023; Wang et al., 2023). It includes generating base clusters and obtaining the final clustering results through consensus functions (Gorbachev et al., 2023; Lakshmi Kumari and Prasad, 2023). In real-world examples, a cube may have various shapes or structures, and its cluster structure cannot be distinguished using a single clustering algorithm. Voting is the use of the advantages of member algorithms to integrate samples. Selecting a baseline algorithm and a clustering result integration function as the unified clustering that unifies the individual member algorithms is necessary.
The effectiveness metric of clustering is often used to measure the effectiveness of clustering results and select the appropriate number of clusters. Good clustering results should have a high within-class similarity and low between-class similarity. Therefore, the improved Davies–Bouldin index (DBI) was selected to evaluate the clustering effect and determine the optimal number of clusters (Wang et al., 2022):
In Equation 1, k represents the number of clusters;
The unsupervised nature of clustering can lead to mismatched classification of results from different clustering algorithms; for example, the clustering result category 1 of member algorithm X may correspond to the clustering result category 2 of member algorithm Y. Therefore, it is necessary to design a consistent function to unify the clustering results. The determination of benchmark clustering algorithms is an important step in the design of consistency functions. Existing experimental results have shown that in terms of the impact of range ratio (CR) and coefficient of variation (CV) on the volatility of clustering evaluation indicators, the silhouette coefficient (SC) indicator has a smaller volatility index in different clustering results under different distribution datasets and can be used for screening benchmark clustering algorithms. The SC index is a clustering evaluation index that combines the compactness of intra-cluster samples and the separation of inter-cluster samples. The larger the value, the better the clustering effect. The calculation method is as follows:
In formulas (4), 5, and 6, x and y are sample points,
The one-layer clustering process of residential electricity load characteristics based on the voting method (Yan et al., 2021) is shown in Figure 1. First, the user’s original dataset is collected for data preprocessing, and then, feature engineering is used to extract load curve features. Each member algorithm is used to cluster the dataset, the number of clusters is determined through improved DBI, and then, the SC index is used to determine benchmark clustering. Finally, the clustering results of each member algorithm are unified through the consistency function, and the voting method is used to divide the curves of ordinary and typical members. Figure 1 shows the one-layer clustering process.
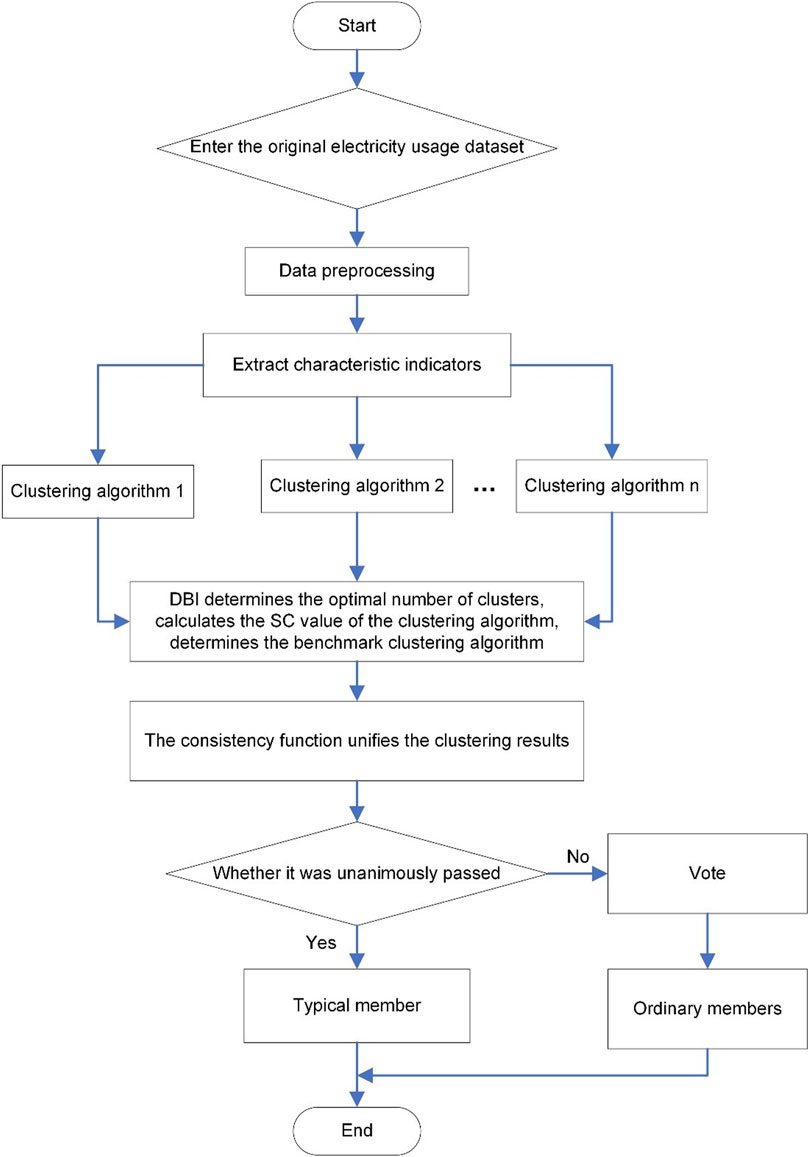
FIGURE 1. One-layer clustering.
The electricity consumption behavior of residential users has individual differences, which are influenced by factors such as the user income level, electricity price level, climate change, seasonal changes, and household structure. In order to refine the classification of residential users, this paper uses a questionnaire survey to collect users’ electricity consumption behavior. Based on the data from customer behavior experiments in Ireland, the questionnaire was designed to include four aspects: the number of smart electrical devices in the home, the family structure, the lifestyle, and the popularity of policies.
A multiple logistic regression model was used to study the validity of the questionnaires. The results of the first-layer ensemble clustering were input into the multiple logistic regression model as the dependent variable of the regression analysis. The questionnaire-related questions were feature-coded and then input into the multiple logistic regression model as independent variables and covariates for regression analysis. The quality of the questionnaire questions was judged by their significance. Finally, the modified 35 key household characteristics affecting the energy consumption characteristics of users are obtained. These key household traits are field-coded and converted into data forms that can be clustered.
The principal component analysis method reduces the dimensionality of the effective survey questionnaire data obtained from the sample. Principal component analysis is a statistical method that attempts to recombine the original variables into a new set of unrelated composite variables and extract a few fewer composite variables as much as possible to reflect the information about the original variables, according to actual needs. The questionnaire dataset obtained after dimensionality reduction is used as the clustering dimension indicator, and the samples contained in each large class in the one-layer clustering result are used to construct the two-layer clustering sample dataset δ:
In formulas (7) and 8, δ is the collection of all questions in the survey questionnaire,
One-level clustering is carried out based on the user load data collected using the smart meter, which only considers the load characteristics of the user, and is not enough for a deep exploration of the user’s accurate information. Therefore, the dataset constructed after comprehensive user load data clustering and key household information clustering is considered the sample dataset for the two-level clustering (Qiu et al., 2018; Wang et al., 2023).
The main step of two-level clustering is to use the key family feature encoding as input indicator data and consider the strength of the user adjustment potential. The two-level clustering is performed on clusters of users with the same load characteristics obtained by one level of clustering.
When conducting two-level clustering, the dataset used differs from the first layer. The sample dataset selected for two-level clustering is based on the basic information on the influencing factors of user electricity consumption behavior collected from the survey questionnaire, representing the adjustable potential of users. Therefore, it is necessary to use the feedback mechanism to correct the clustering error of one-level clustering when performing two-layer clustering and correlate the user load characteristics with the adjustable potential to realize an accurate classification of the current user power consumption behavior under the multi-dimensional influencing factors.
The article constructed a two-level clustering correction model that comprehensively considers the key characteristics of demand response users and user load, as shown in Figure 2. They used the results obtained from two-level clustering as the training dataset for support vector machines and employed the nonlinear mapping ability of SVM to reverse-correct the results of one-level clustering. This approach ensured a more comprehensive and accurate correction of the clustering results.
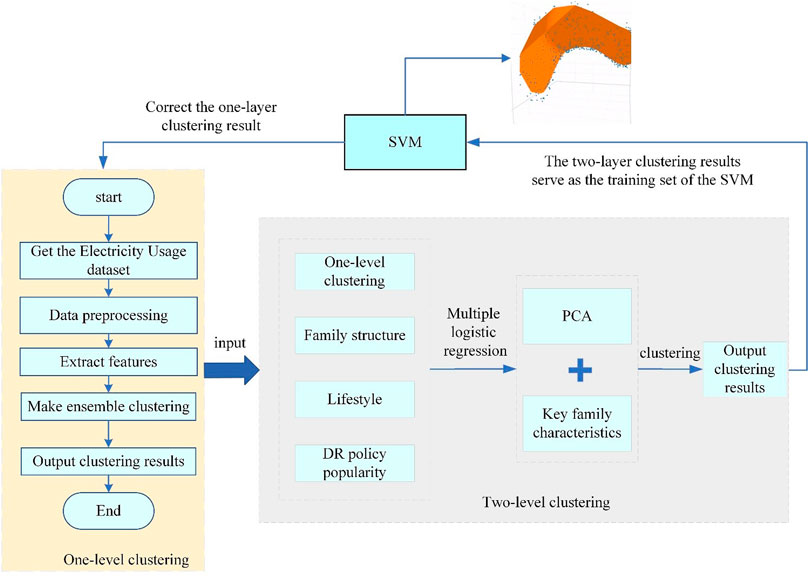
FIGURE 2. Two-level clustering and correction.
This article randomly selects 30 households from a valid survey questionnaire filled out in a certain place as experimental subjects. It extracts users’ daily 24-h load data in a certain place for a week through the provincial residents’ smart energy service platform.
This article selects three clustering algorithms as member algorithms for voting ensemble clustering to cluster daily load curve data. The member algorithms are k-means clustering, SOM clustering, and GMM clustering. Figure 3 shows the detailed DBI index scores of the three-member algorithms under different cluster numbers. It can be intuitively seen from the figure that when the number of clusters is 3, the DBI index of the three-member algorithms is the lowest. As the number of clusters increases, the integration level of all member algorithms tends to stabilize. Therefore, the optimal number of clusters selected is 3.
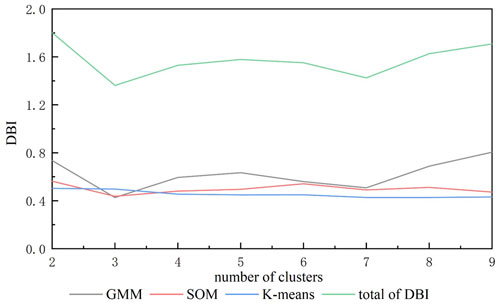
FIGURE 3. Different algorithm DBI values.
Table 1 shows that among the three-member clustering algorithms, the traditional k-means (k-means) and SOM algorithms have a higher degree of clustering stability than the GMM clustering algorithm, and their clustering performance remains good. According to SC, as an indicator to measure the effectiveness of the clustering effect, SOM clustering is used as the benchmark clustering algorithm.
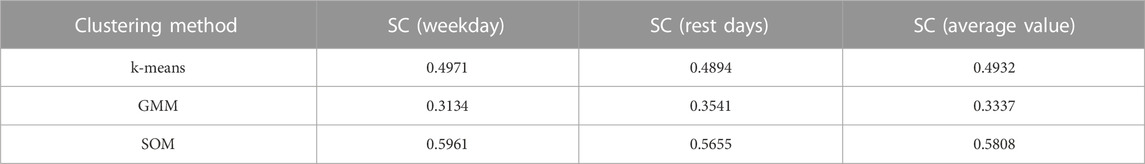
TABLE 1. SC values of different clustering results.
Table 2 shows the results of one layer of integrated clustering.
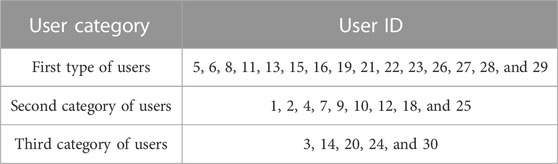
TABLE 2. Integrated clustering results.
In order to ensure the maximum retention of questionnaire information and guarantee the data processing performance, the study used PCA to process the encoded survey questionnaire data. Through PCA, high-dimensional data can be dimensionally reduced to obtain a set of dimensionally reduced datasets, which can be used as input indicators for two-level clustering. Two-level clustering is based on the results of one-level clustering, which further divides each group of user groups obtained from one-level clustering into two subcategories, namely, strong and weak adjustable potential, using the k-means algorithm. This division can help researchers gain a more detailed understanding of the user group, thereby grasping the characteristics and potential of the user group. The clustering results are shown in Figure 4 and Table 3.
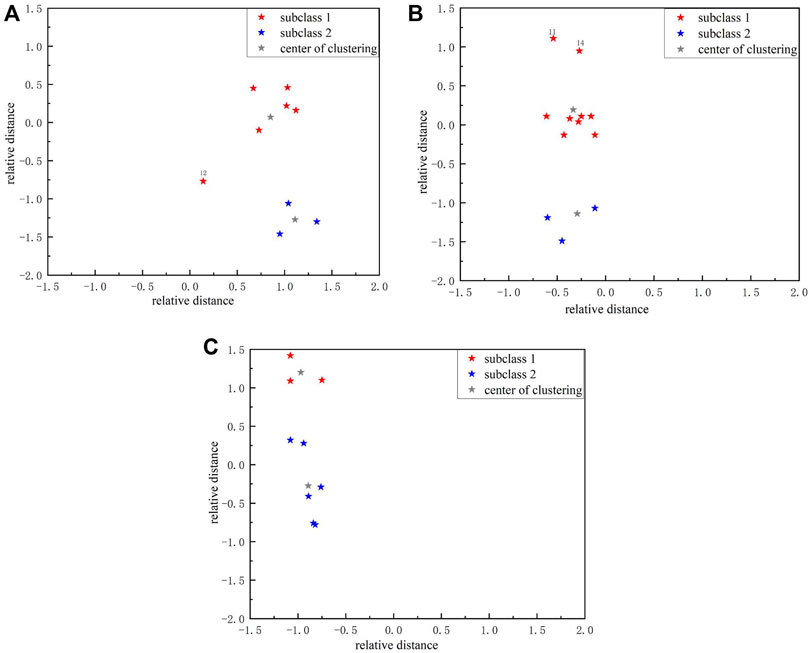
FIGURE 4. Two-level clustering results.
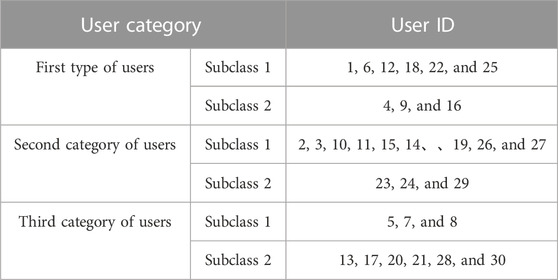
TABLE 3. Two-level clustering results.
Figure 4A represents the first type of users, Figure 4B represents the second type of users, and Figure 4C represents the third type of users. The gray color represents the cluster center, and the red and blue colors represent the sample.
In the visualization results of two-level clustering, some data points lack rationality in distribution, and there are obvious errors in clustering. The result of two-level clustering is used as the training dataset of the support vector machine, and the one-layer clustering result is corrected with the help of the inverse adjustment mechanism. After SVM correction, the categories of three users have changed, and the specific results are shown in Figure 5 and Table 4.
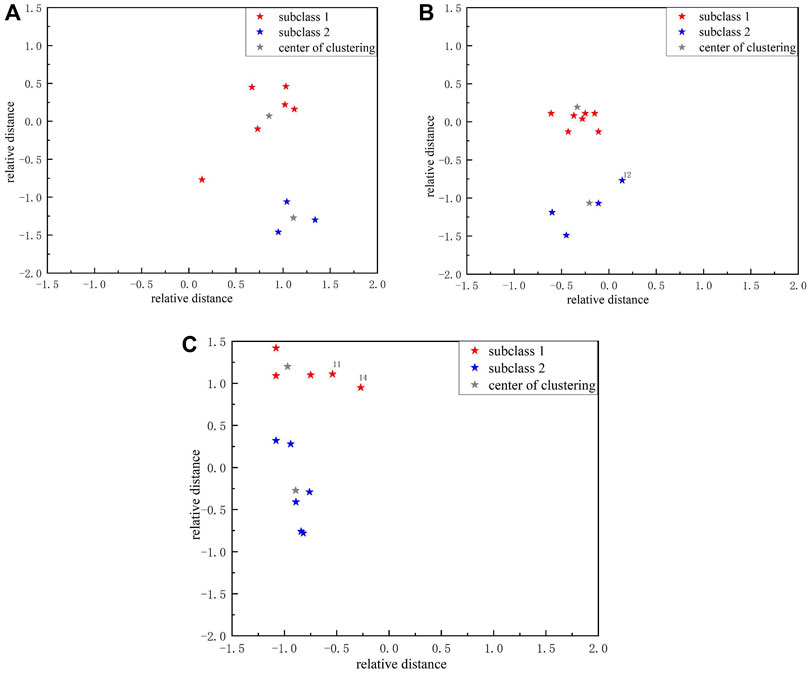
FIGURE 5. Clustering result based on SVM correction.
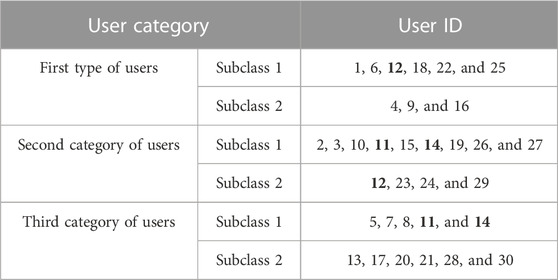
TABLE 4. Clustering results based on SVM correction.
Figure 5A represents the first type of users, Figure 5B represents the second type of users, and Figure 5C represents the third type of users. The gray color represents the cluster center, and the red and blue colors represent the sample.
Table 4 shows that SVM correction has reclassified user 12 from subclass 1 of the first type of user to subclass 2 of the second type of user, while it has also reclassified users 11 and 14 from subclass 1 of the second type of user to subclass 1 of the third type of user. By comparing the original clustering map with the modified clustering map, we can intuitively find the following points: first, the relative distance between the clustering centers of user 12 and subcategory 1 of the first type of user is significantly greater than the distance between the clustering centers of user 12 and subcategory 2 of the second type of user. Second, the relative distance between users 11 and 14 and the cluster centers of subclass 1 of the second type of users is significantly greater than the distance between users 11 and 14 and the cluster centers of subclass 1 of the third type of users. The above results indicate that in the adjusted clustering graph, user 12 is more correlated with subcategory 2 of the second type of users, while users 11 and 14 are more correlated with subcategory 1 of the third type of users. This verifies the algorithm’s good potential value in user energy feature recognition, which can accurately distinguish users and improve the power system stability.
In order to further verify the influence of key family features on the clustering results, this paper constructs five application scenarios. It contains the corresponding clustering correction error proportions under 20%, 40%, 60%, 80%, and 100% of the user’s household characteristic information. Massive datasets are randomly selected in the same proportion, and their error correction rates are calculated, as shown in Eq. 9:
In Equation 9, n is the proportion of the same information containing family characteristics that is randomly selected n times; m is the total number of users;
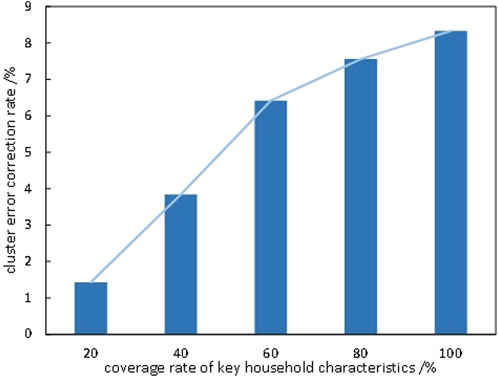
FIGURE 6. The specific relationship between the clustering correction rate and the key characteristics of the user’s household.
As can be seen from Figure 6, the key family characteristic factors are proportional to the clustering error correction rate. When the coverage rate of key household factors is 20%–60%, the correction rate of clustering error is low, and the increase is larger. However, when the coverage rate exceeds 60%, the increase in the clustering error correction rate becomes less pronounced, yielding a more ideal effect.
This article proposes a research method for user energy characteristics that takes into account user energy characteristics and key household characteristics. It validates the reliability and practicality of the proposed classification method by randomly selecting 30 users from a valid survey questionnaire filled out in a specific place. The example results show that the clustering results modified by SVM can better mine and distinguish user energy characteristics. This approach can be used to solve the problem of the current demand response clustering algorithm (Cheng et al., 2021), which struggles to comprehensively and objectively describe the participation, willingness, and response ability of residential users in the implementation process. It can also provide a basis for peak shaving and power grid frequency regulation.
The original contributions presented in the study are included in the article/Supplementary Material; further inquiries can be directed to the corresponding author.
BK: conceptualization and writing–original draft. ZX: investigation and writing–original draft. GD: data curation and writing–review and editing.
The author(s) declare that no financial support was received for the research, authorship, and/or publication of this article.
Author ZX was employed by Jiangxi Booway New Technology Co., Ltd.
The remaining authors declare that the research was conducted in the absence of any commercial or financial relationships that could be construed as a potential conflict of interest.
All claims expressed in this article are solely those of the authors and do not necessarily represent those of their affiliated organizations, or those of the publisher, the editors, and the reviewers. Any product that may be evaluated in this article, or claim that may be made by its manufacturer, is not guaranteed or endorsed by the publisher.
Cai, Q. (2023). Research on the analysis method of user power consumption behavior based on load data preprocessing (Master’s thesis. Nanjing: Nanjing University of Posts and Telecommunications.
Cheng, J., He, Y., Bao, G., and Pan, F. (2021). User power load clustering analysis based on CK-means algorithm. Comput. Simul. (07), 63–67+133. doi:10.3969/j.issn.1006-9348.2021.07.017
Fu, W., Jiang, X., Li, B., Tan, C., Chen, B., and Chen, X. (2023). Rolling bearing fault diagnosis based on 2D time-frequency images and data augmentation technique. Meas. Sci. Technol. 34 (4), 045005. doi:10.1088/1361-6501/ACABDB
Gorbachev, A. M., Vikharev, A. A., Afanasiev, A. V., Vikharev, A. L., Bandurkin, I. V., Radishev, D. B., et al. (2023). Investigation of phosphorus-doped nanocrystalline diamond films for photocathode application. Vacuum 215, 112335. doi:10.1016/j.vacuum.2023.112335
Lakshmi Kumari, C. H., and Prasad, K. V. (2023). Spatiotemporal detection and localization of object removal video forgery with multiple feature extraction and optimized residual network. Intern. J. Pattern Recognit. Artif. Intell. 37 (4), 2355002. doi:10.1142/S0218001423550029
Lei, G., Zhang, T., Tang, Y., Liang, T., and Shu, K. (2023). The analysis method of electricity consumption characteristics of users in Taiwan area with fuzzy C-means clustering was optimized. Proc. Dep. Power Syst. its Automation. doi:10.19635/j.cnki.csu-epsa.001346
Li, J., Ling, S., Yang, Z., and Tang, J. (2021). A method for detecting changes in user electricity consumption behavior based on singular spectrum analysis. Guangxi Electr. Power (05), 22–27+44. doi:10.16427/j.cnki.issn1671-8380.2021.05.014
Li, Q., Wang, G., Zhang, Y., and Yang, Q. (2022). Analysis of user electricity consumption behavior based on density peak clustering with shared neighbors and attractiveness. Concurrency Comput. Pract. Exp. 35 (3). doi:10.1002/cpe.7518
Li, Z., Wu, L., Xu, Y., Wang, L., and Yang, N. (2023). Distributed tri-layer risk-averse stochastic game approach for energy trading among multi-energy microgrids. Appl. Energy 331, 120282. doi:10.1016/j.apenergy.2022.120282
Liu, J., Xu, H., Liu, Y. P., Song, D., and Pang, Y. (2016). Analysis of energy consumption characteristics and potential users of electric energy substitution in Gansu Province. Electr. demand side Manag. (01), 44–48.
Liu, Y., Yuen, C., Huang, S., Ul Hassan, N., Wang, X., and Xie, S. (2014). Peak-to-Average ratio constrained demand-side management with consumer’s preference in residential smart grid. IEEE J. Sel. Top. Signal Process. 8 (6), 1084–1097. doi:10.1109/jstsp.2014.2332301
Lu, H., and Wang, L. (2021). Research on the classification method of large user electricity consumption characteristics based on data mining. Electron. Des. Eng. (14), 38–41+46. doi:10.14022/j.issn1674-6236.2021.14.009
Qiu, Q., Li, G., and Pan, Y. (2018). Research on user load classification based on comprehensive indicators of electricity consumption behavior. Smart Electr. (10), 26–31. doi:10.3969/j.issn.1673-7598.2018.10.005
Sun, Y., Mao, Y., Li, Z., Zhang, X., and Li, X. (2021). Comprehensive clustering method for user load-characteristics and adjustable potential of power big data. Proc. CSEE (18), 6259–6271. doi:10.13334/j.0258-8013.pcsee.201928
Wang, B., Wei, Y., Zhang, B., and Song, L. (2022). Lipid metabolism within the bone micro-environment is closely associated with bone metabolism in physiological and pathophysiological stages. Statistics decision-making 21 (12), 5–11. doi:10.1186/s12944-021-01615-5
Wang, Z., Wu, Q., Bao, X., Liu, S., Zhang, G., Wang, K., et al. (2023). Comprehensive energy user demand response potential analysis based on secondary clustering. Electrotech. Technol. (05), 43–47. doi:10.19768/j.cnki.dgjs.2023.05.011
Xu, P., Fu, W., Lu, Q., Zhang, S., Wang, R., and Meng, J. (2023). Stability analysis of hydro-turbine governing system with sloping ceiling tailrace tunnel and upstream surge tank considering nonlinear hydro-turbine characteristics. Renew. Energy. doi:10.1016/j.renene.2023.04.028
Xu, Z., Sun, H., and Guo, Q. (2018). Comprehensive demand response research review and prospects. Proc. CSEE (24), 7194–7205+7446. doi:10.13334/j.0258-8013.pcsee.180893
Yan, Q., Li, Y., Fan, Y., Chen, Y., and Guo, J. (2021). Regression analysis of residential electricity consumption behavior based on weighted voting ensemble clustering. Grid Technol. (11), 4435–4446. doi:10.13335/j.1000-3673.pst.2020.2268
Yang, N., Dong, Z., Wu, L., Zhang, L., Shen, X., Chen, D., et al. (2021). A comprehensive review of security-constrained unit commitment. J. Mod. Power Syst. Clean Energy 10 (3), 562–576. doi:10.35833/MPCE.2021.000255
Yang, N., Yang, C., Wu, L., Shen, X., Jia, J., Li, Z., et al. (2022a). Intelligent data-driven decision-making method for dynamic multisequence: an E-seq2seq-based SCUC expert system. IEEE Trans. Industrial Inf. 18 (5), 3126–3137. doi:10.1109/TII.2021.3107406
Yang, N., Yang, C., Xing, C., Ye, D., Jia, J., Chen, D., et al. (2022b). Deep learning-based SCUC decision-making: an intelligent data-driven approach with self-learning capabilities. IET Generation, Transm. Distribution 16 (4), 629–640. doi:10.1049/GTD2.12315
Yu, W. X., and Xiao, W. H. (2021). A new solving function optimization problems methods—Resonance Algorithm. Eng. Appl. Artif. Intell. 104, 104385. doi:10.1016/j.engappai.2021.104385
Zhang, B., Xu, P., and Ge, P. (2020). Analysis of short-term load consumption behavior of distribution network based on improved SOM clustering model. Microcomput. Appl. (11), 164–167.
Zhang, Y., Xie, X., Fu, W., Chen, X., Hu, S., Zhang, L., et al. (2023). An optimal combining attack strategy against economic dispatch of integrated energy system. IEEE Trans. Circuits Syst. II Express Briefs 70 (1), 246–250. doi:10.1109/TCSII.2022.3196931
Zhao, Q., Li, H., Wang, X., Pu, T., and Wang, J. (2019). Analysis of users’ electricity consumption behavior based on ensemble clustering. Glob. Energy Interconnect. 2 (6), 479–488. doi:10.1016/j.gloei.2020.01.001
Zheng, Q., Lu, Y., Xiang, J., Chen, Y., Gong, F., Yuan, J., et al. (2022). Research on user-side adjustable resource classification and characteristic analysis. Integr. smart energy (11), 50–55. doi:10.3969/j.issn.2097-0706.2022.11.007
Keywords: power system, integrated clustering, energy consumption characteristics, double-layer clustering, energy saving and carbon reduction
Citation: Kang B, Xu Z, He W, Ding G, Han W, Sun M, He J and Wang Z (2024) Research on the double-layer clustering method of residential energy use characteristics under the background of energy system energy savings and carbon reduction. Front. Energy Res. 11:1326257. doi: 10.3389/fenrg.2023.1326257
Received: 23 October 2023; Accepted: 06 December 2023;
Published: 03 January 2024.
Edited by:
Wenlong Fu, China Three Gorges University, ChinaReviewed by:
Yu Wang, Guangdong University of Technology, ChinaCopyright © 2024 Kang, Xu, He, Ding, Han, Sun, He and Wang. This is an open-access article distributed under the terms of the Creative Commons Attribution License (CC BY). The use, distribution or reproduction in other forums is permitted, provided the original author(s) and the copyright owner(s) are credited and that the original publication in this journal is cited, in accordance with accepted academic practice. No use, distribution or reproduction is permitted which does not comply with these terms.
*Correspondence: Zhihao Xu, emh4dWhpQHdodS5lZHUuY24=
Disclaimer: All claims expressed in this article are solely those of the authors and do not necessarily represent those of their affiliated organizations, or those of the publisher, the editors and the reviewers. Any product that may be evaluated in this article or claim that may be made by its manufacturer is not guaranteed or endorsed by the publisher.
Research integrity at Frontiers
Learn more about the work of our research integrity team to safeguard the quality of each article we publish.