 Jian Zhou1
 Wenting Zha
95% of researchers rate our articles as excellent or good
Learn more about the work of our research integrity team to safeguard the quality of each article we publish.
Find out more
ORIGINAL RESEARCH article
Front. Energy Res. , 29 December 2023
Sec. Sustainable Energy Systems
Volume 11 - 2023 | https://doi.org/10.3389/fenrg.2023.1326100
This article is part of the Research Topic Low-Carbon Oriented Improvement Strategy for Flexibility and Resiliency of Multi-Energy Systems View all 24 articles
Electricity sales is one of the important assessment indexes of a power grid company’s operation. Since electricity sales is closely related to many factors, how to consider the influence of multiple factors and improve the accuracy of the calculation of electricity sales is a difficult problem that needs to be solved urgently. In this paper, we first analyze the six dimensions affecting electricity sales and select the key influencing factors that can be quantified statistically. Secondly, the key influencing factors are screened according to Pearson’s correlation coefficient and then the calculation model of electricity sales is established based on the random forest algorithm. Finally, we validate the feasibility and validity of the proposed calculation method for electricity sales through a case study.
Electricity sales is an important efficiency assessment index for the operation and management of power grid companies. Calculation of electricity sales is one of the fundamental tasks in the operation of the electricity market. It helps utilities understand the quantity and amount of electricity they sell so that they can make accurate financial analyses and market forecasts. However, the amount of electricity sales in a region is affected by many complex factors. For example, grid investment has a profound impact on electricity sales. The current large-scale rough investment strategy is no longer applicable, the precise investment strategy has been applied in many countries, and how to accurately invest to enhance electricity sales has become the focus of the investment strategy of many power grid enterprises. In addition, the economic situation, technological development, and other factors also have a certain degree of impact on electricity sales. Under the current transmission and distribution tariff policy, the positive growth of electricity sales directly determines the economic efficiency of the grid company, which is an important basis for judging whether the value of grid assets is preserved or increased. Therefore, It is necessary to analyze and process the data of electricity sales at a deeper level and discover its inherent change rules at the same time. It can provide the basis for the operators of power grid enterprises to support their business decisions, and help them better understand the market development trend and make correct business decisions.
With the development of data technology, it is an effective way to construct the calculation model of electricity sales by mining the intrinsic relationship between the historical data of multiple factors and electricity sales. At present, most of the relevant research results are focused on accurate forecasting of electricity sales, and the commonly used forecasting methods are the time series method (Billinton et al., 1996; Toyoda et al., 1970; Pektas and Cigizoglu, 2013), regression analysis method (Dudek, 2016; Sarduy et al., 2016), and grayscale forecasting method (EI-Fouly et al., 2006; Li et al., 2011). First of all, historical electricity sales data have time series characteristics, time series-based forecasting methods are widely used in the field of electricity sales forecasting (Madden, 2005). Kim M et al. (2023) applied a new model and scientific approach to power prediction in IoT and big data environments using traditional time series prediction methods. The work (Sarkodie et al., 2017) used an Autoregressive Integrated Moving Average (ARIMA) model to forecast the electricity consumption in Ghanaian regions up to 2030. This method requires high data accuracy and can only handle relatively smooth time series data. However, electricity sales are usually perturbed by stochastic factors such as temperature, precipitation, and season, which cannot be handled by this method. Secondly, the regression analysis method is similar to the time series-based electricity sales prediction method, which constructs a regression model for the prediction of electricity sales by mining the historical data of electricity sales. The difference is that this method considers different factors affecting electricity sales, which makes the model more stable by considering the factors of electricity sales from a higher dimension. The work (Lai et al., 2023) built the annual contribution electricity forecast model based on Logistic regression analysis. The work (Vu et al., 2015) analyzed the importance of climate for the prediction of electricity sales under different geographical conditions and established a multiple regression model for the prediction of monthly electricity demand by selecting appropriate variables. The predictive accuracy of the proposed model is also verified based on the data of New South Wales, Australia. Finally, the gray prediction method, proposed by Deng (Chan et al., 2010), is a multidisciplinary theory for analyzing gray systems. The method has been widely used in many fields such as agriculture, industry, and environmental systems research (Cai and Liao, 2021). As an important part of the gray system theory, the gray forecasting model has been widely used in time series forecasting due to its simplicity and ability to describe unknown systems with only four data points (Mohamed and Bodger, 2004a; Mohamed and Bodger, 2004b). Electricity demand forecasting can be regarded as a gray system problem because we know that some factors such as population, economic conditions, and weather have an impact, but we are not sure how they affect the electricity demand (H Morita et al., 1996; Zhou et al., 2005 proposed a simple triangular gray pre-method to forecast electricity demand. On this basis, it is combined with the idea of interval prediction in multiple regression, and the method’s feasibility is proved through actual case analysis. However, the gray prediction also has some defects, when electricity sales are in a smooth change the method predicts poorly. Therefore, the methods in the above-mentioned literatures are only suitable for dealing with linear data, which does not work for electricity sales with non-linear and non-stationary characteristics.
In order to improve the accuracy of electricity sales calculations, this paper intends to establish a calculation model of electricity sales by analyzing and screening the factors based on correlation ranking and random forest algorithm. The use of big data technology to analyze and quantify the relationship between grid investment and electricity sales growth in different regions has a positive effect on grid companies to further improve the level of investment precision. The main contributions of this paper are as follows:
(1) The influencing factors on electricity sales are selected by analyzing different dimensions and the Pearson’s correlation coefficient is utilized to filter out the key influencing factors.
(2) The artificial intelligence algorithm is introduced into the calculation method of electricity sales to improve the accuracy.
According to the experts’ selection and actual operation experience, it is known that the six dimensions of infrastructure, technological transformation, inherent loss, load development, power supply construction and power supply characteristics have a greater impact on power sales, which are analyzed as follows.
Grid infrastructure is the hardware facilities to guarantee the power supply, such as transmission and distribution lines, substations, and auxiliary equipment. The infrastructure directly determines the maximum power supply capacity of the region, which in turn affects the amount of electricity sales. In this dimension, the total amount of grid infrastructure investment is chosen as one of the key influencing factors. The total investment in grid infrastructure should be compatible with the local load development level, and its calculation formula is as follows:
Where T is the statistical period,
Electricity technology renovation is the improvement of assets such as existing grid production equipment, facilities and related auxiliary facilities by utilizing advanced technologies, equipment, processes and materials. The total amount of investment in agricultural network upgrading and transformation is selected as one of the key influencing factors under this dimension, and its calculation formula is as follows:
Where
Reforming and upgrading rural distribution grids can improve the power supply capacity of agricultural grids, thus boosting the growth of electricity sales.
When electricity is transmitted over long distances, it generates active losses in the lines and transformers, which directly affects the transmission efficiency. When the power generation remains unchanged and the loss is too high, the power transmitted to the customer side will decrease, which will inevitably cause a decrease in power sales. Under this dimension, the line loss rate is selected as one of the key influencing factors, and its calculation formula is as follows:
Where
With the increasing electrification of industrial, agricultural, commercial, and residential loads, the load power demand is increasing, which is the intrinsic reason for the growth of electricity sales. Under this dimension, the maximum load power for the year is selected as one of the key influencing factors, the value of which is obtained from the yearly statistics and labeled as
In recent years, renewable energy has become an important part of the global new energy market. In this dimension, new energy installed capacity is chosen as one of the key influencing factors, and its calculation formula is as follows:
Where
While the proportion of installed new energy has increased significantly, the new energy has the characteristics of intermittent supply and high volatility, which poses a hidden danger to the safe and orderly operation of the power system, and inversely restricts its grid-connected capacity, leading to short-term power supply tightness in some areas, indirectly affecting electricity sales. Therefore, under this dimension, the maximum load utilization hours of new energy is chosen as one of the key influencing factors, and its calculation formula is as follows:
Where
Figure 1 shows the trend of seven types of data, including line loss rate, maximum load of electricity consumption, new energy installation and utilization hours, completion of grid infrastructure investment, completion of agricultural network upgrading and electricity sales in a region from 2015 to 2022. According to Figure 1, it can be seen that: line loss rate is approximately inversely correlated with electricity sales, installed capacity of new energy is positively correlated with electricity sales, and the rest have no consistent correlation characteristics. In this case, it is particularly important to screen key influencing factors, which may have a greater impact on electricity sales. Therefore, it is necessary to screen the key influencing factors to make the calculation of electricity sales more efficient.
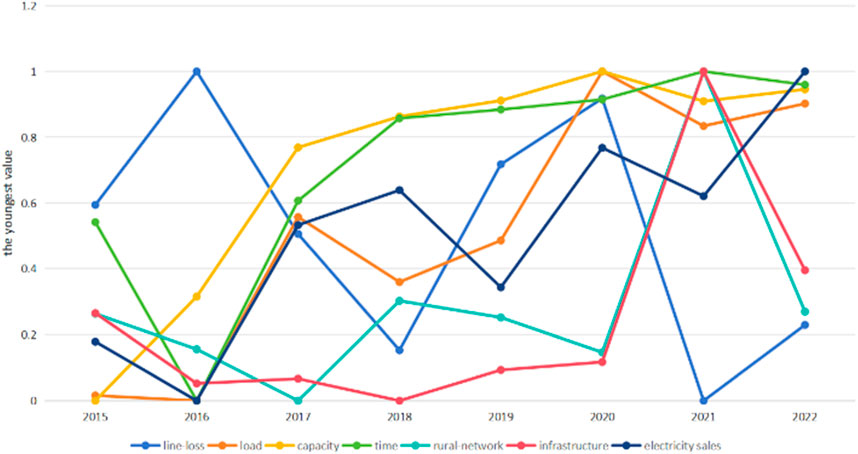
FIGURE 1. Schematic correlation between key influencing factors and electricity sales.
In this chapter, the Pearson correlation coefficient is first proposed to screen the key influencing factors, which provides the theoretical basis for the correlation simulation conducted in Chapter 4; Then, it introduces the calculation model of electricity sales based on the random forest algorithm, which puts forward a new idea for the computation of electricity sales under the influence of multiple factors.
Based on the above analysis, it is clear electricity sales are affected by a variety of factors, including, but not limited to, market demand, economic development, policy support, energy mix, etc. These factors may interact with each other and have varying degrees of influence on electricity sales. Therefore, if all the influencing factors are directly used in the calculation of electricity sales, the calculation accuracy and generalization ability of the model may be affected due to the excessive dimensions of the input data.
To solve this problem, correlation analysis is introduced to help filter key factors, which is a statistical method that measures the degree of association between variables. Through correlation analysis, the most relevant factors to electricity sales can be found and used in the calculation of electricity sales, thus reducing the dimensionality of the input data and improving the computational efficiency of the model.
In this paper, the Pearson correlation coefficient is introduced for key factor screening, whose calculation formula is as follows
Where X is the quantitative value of the influencing factor, Y is the amount of electricity sold,
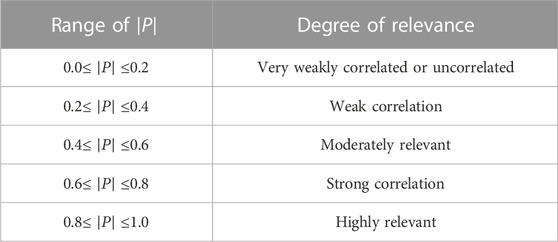
TABLE 1. The degree of relevance for the Pearson correlation coefficient.
Therefore, according to the Eq. 6, the Pearson correlation coefficient between the sales of electricity and six types of data, such as line loss rate
This subsection establishes a mapping of the relationship between different influencing factors and electricity sales, achieving accurate linkage. In this paper, the random forest regression algorithm is selected. Random Forest Regression (RFR) algorithm as a machine learning algorithm, has been applied to several fields. Compared with regression algorithms such as SVM, the RFR algorithm does not require normalization of data and can perform feature selection through the algorithm itself, resulting in better robustness. The schematic diagram of the algorithm principle is shown in Figure 2:
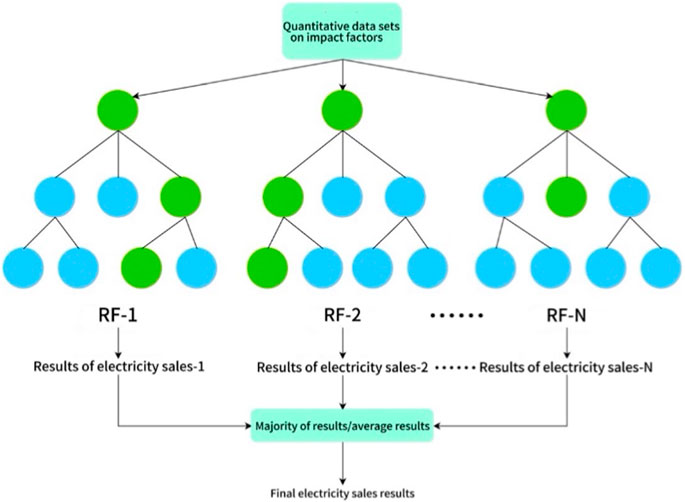
FIGURE 2. Random Forest algorithm schematic.
The main decision tree algorithm used for random forest regression is the CART (classification and regression tree) algorithm. The decision tree algorithm alone often performs well on training data, but due to the drawbacks of overfitting, the model does not have universality and engineering application capabilities. To make up for the shortcomings of decision trees, the concept of random sampling is introduced into the RF algorithm. Its algorithmic formulation is based on the decision tree regression model, and the prediction function for each decision tree can be expressed as shown in Eq. 7:
Where k denotes the kth decision tree, x denotes the input sample,
The prediction function of a multiple decision tree can be expressed as:
With the number of decision trees k.
In this paper, the computational model based on random forest is calculated as follows:
Step 1:. Data preparation: The dataset including the filtered influencing factors is divided into two parts, the training set Tr and the test set Te according to a certain proportion. The training set is used to train the model and the test set is used to evaluate the performance of the model.
Step 2:. Model construction and training: Initialize the model and set some model parameters to control the behavior of the random forest, such as the number of decision trees, the way of feature selection, the way of decision tree growth, and so on.
The model will construct multiple decision trees based on the samples in the training set and the values of the target variables, and perform feature selection and segmentation on each tree. This splitting continues until all the training samples at the node belong to the same class, and the optimal model for the calculation of electricity sales is obtained without pruning during the splitting process of the decision tree.
Step 3:. Calculation results and evaluation: Based on the optimal random forest model, the sales electricity of the samples in the test set can be calculated. The model will average or weighted average the calculation results of each decision tree to get the final regression results. For model evaluation, the Relative Root Mean Square Error (RRMSE) is used to measure the deviation between the observed (true values) and calculated values. Its calculation formula is as follows:
Where
In this paper, the dataset of electricity sales of 13 cities in a region in recent years is used to conduct a case study, with a statistical period of years. These historical data come from historical data collected by power grid companies. The specific steps of electricity sales calculation are as follows:
First, the six key factor indicators of each city in each calendar year are calculated according to the six-dimensional formulas in Section 2. Among them, the data from 2015–2018 is regarded as the training set, totaling 52 sets of data, and the data in 2021 is used as the test set
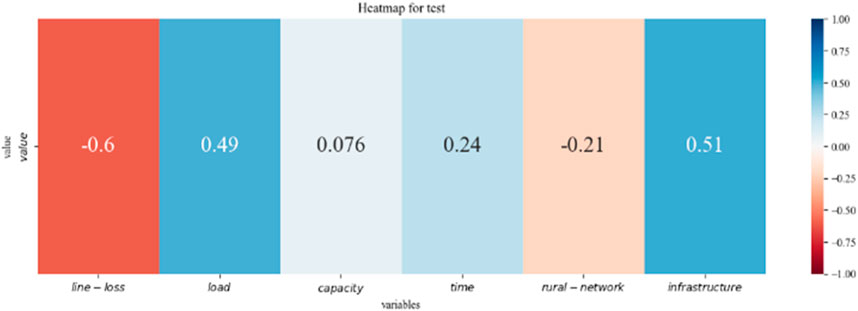
FIGURE 3. The results of the Pearson correlation analysis.
Through analyzing and screening, three items with absolute values greater than 0.4, namely, line loss rate
Finally, a random forest-based electricity sales calculation model is established. In the experiments, the iteration number is set to 30. Based on the training set
To validate the proposed method for calculating electricity sales based on correlation factor analysis and random forest, ablation experiments and comparative experiments are conducted in this section. To demonstrate the advancement of Random Forest, the SVR model is built as the control group. Moreover, the calculation models based on all influencing factors are constructed for SVR and RF in this section as a comparison, respectively.
In the calculation of electricity sales based on the SVR model, it is necessary to carry out the normalization of all the data to the same scale, which is conducive to improving the accuracy. In addition, a linear kernel function is adopted in the SVR model, which makes the calculation process simple and efficient.
The calculation results of these two models using different influencing factors on the test set are shown in Figure 4. The horizontal axis corresponds to the 13 different regions, and the vertical axis represents the values of electricity sales. The blue curve is the real value of electricity sales, while the red and green curves represent the calculation values of electricity sales before and after the screening of influencing factors, respectively. In Figure 4A, it can be seen that the trends of the calculation curves are consistent with the change of the actual values, and the calculation curve is closer to the actual one when only three key factors after screening are input. Similarly, corresponding conclusions can also be drawn in the calculation curves of electricity sales based on SVR in Figure 4B. Therefore, both models have shown better computational accuracy with only three key factors, indicating the importance of multi-factor screening.
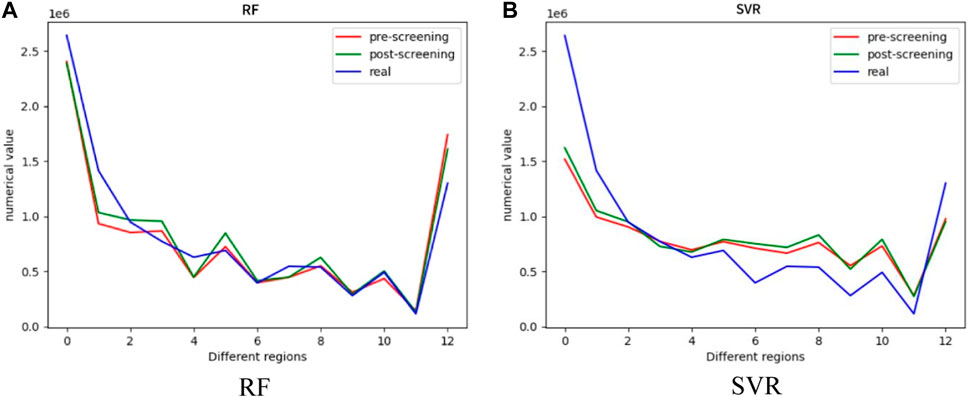
FIGURE 4. The plot of the calculation results of the two models. (A) RF. (B) SVR.
To verify the progressiveness of the RF algorithm, Figure 5 shows the calculation curves of RF and SVR based on three key influencing factors. The blue curve in the figure shows the actual value of electricity sales, while the green and red colors represent the results of the RF model and SVR model calculations, respectively. From the figure, it can be seen that the green curve is closer to the blue curve than the red curve in the 6th to 11th regions, which means the RF model calculations have a smaller error from the true values. Compared with the RF model, although the calculation results of the SVR model generally follow the changes in actual values, there is a significant difference between them. It indicates that the electricity sales calculation method based on RF shows better performance in terms of trend capture and accuracy, while the performance of the SVR model may be affected by a variety of factors, such as data complexity, leading to a decrease in the reliability of the calculation results.
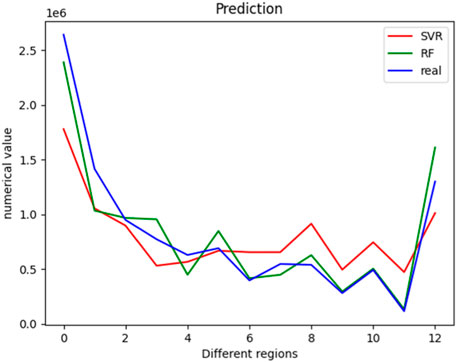
FIGURE 5. Graph of calculation results after screening of key factors.
The RRMSE values of these two electricity sales calculation models on the whole test set are obtained according to Eq. 9, as shown in Table 2. From the indicators in the table, it can be found that the RRMSE of the calculation after screening the influencing factors is significantly smaller than before, and based on this, the RRMSE based on the RF model is lower. Therefore, the electricity sales calculation model based on random forest proposed in this paper can reflect the relationship between multi-factors and power sales and effectively improve the calculation precision.
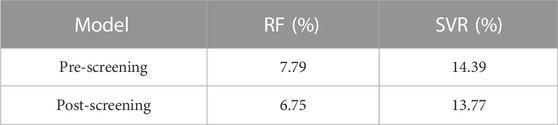
TABLE 2. Relative error in the calculation results of electricity sales.
By analyzing the importance of calculating electricity sales for power grid investment, construction, and planning development, this article has proposed to explore the inherent relationship between multi-factors and electricity sales, which is an effective way to improve the calculation accuracy. The Pearson correlation coefficients have been calculated and three key factors have been screened out. Then, a calculation model of electricity sales is constructed based on the RF method. The comparative experimental results show that the proposed model has smaller computational errors and higher accuracy. It can better achieve accurate linkage between investment and electricity sales for power grid companies, improve the refinement of management, and enhance the economic benefits of enterprises.
In addition, due to the limited dataset, this work also has limitations in analyzing the dimensions that affect electricity sales. At the same time, there is a possibility of further optimization in the constructed RF regression calculation model. Further research will be conducted in the future to address these issues.
The datasets analyzed during the current study are not publicly available because they involve the data security of the operating unit, but are available from the corresponding author on reasonable request.
JZ: Writing–review and editing. JT: Writing–review and editing. LW: Writing–review and editing. YS: Writing–original draft. WZ: Writing–original draft, Writing–review and editing.
The author(s) declare that no financial support was received for the research, authorship, and/or publication of this article.
Authors JZ and LW were employed by Tianshui Power Supply Company of State Grid. Author JT was employed by State Grid Gansu Electric Power Company.
The remaining authors declare that the research was conducted in the absence of any commercial or financial relationships that could be construed as a potential conflict of interest.
All claims expressed in this article are solely those of the authors and do not necessarily represent those of their affiliated organizations, or those of the publisher, the editors and the reviewers. Any product that may be evaluated in this article, or claim that may be made by its manufacturer, is not guaranteed or endorsed by the publisher.
Billinton, R., Chen, H., and Ghajar, R. (1996). Time-series models for reliability evaluation of power systems including wind energy. Microelectron. Reliab. 36 (9), 1253–1261. doi:10.1016/0026-2714(95)00154-9
Cai, X., and Liao, Y. (2021). Transformer order demand forecasting based on grey forecasting model. IOP Conf. Ser. Earth Environ. Sci. 831 (1), 012004. doi:10.1088/1755-1315/831/1/012004
Chan, B. L., FengSu, S., and Yen, T.H. (2010). High-precision forecast using grey models. Int. J. Syst. Sci. 32 (5), 609–619. doi:10.1080/00207720120323
Dudek, G. (2016). Pattern-based local linear regression models for short-term load forecasting. Electr. Power Syst. Res., 130. doi:10.1016/j.epsr.2015.09.001
Ei-Fouly, T. H. M., Ei-Saadany, E. F., Salama, M. M. A., El-Fouly, T., and El-Saadany, E. (2006). Grey predictor for wind energy conversion systems output power prediction. IEEE Trans. Power Syst. 21 (3), 1450–1452. doi:10.1109/tpwrs.2006.879246
Kim, M., Lee, S., and Jeong, T. (2023). Time series prediction methodology and ensemble model using real-world data. Electronics 12 (13), 2811. doi:10.3390/electronics12132811
Lai, G. S., Wu, G. Y., Lan, Z. Q., Wu, X. F., and Xia, S. H. (2023). Annual contribution electricity forecasting model based on logistic regression analysis. J. Phys. Conf. Ser. (1), 2530. doi:10.1088/17426596/2530/1/012008
Li, G. D., Wang, C. H., Nagai, M., Masuda, S., et al. (2011). A research on short-term load forecasting problem applying improved grey dynamic model. Int. J. Electr. Power & Energy Syst. 33 (4), 809–816. doi:10.1016/j.ijepes.2010.11.005
Madden, C. (2005). Indicators for arts and cultural policy: a Global perspective. Cult. Trends 14 (3), 217–247. doi:10.1080/09548960500436824
Mohamed, Z., and Bodger, P. (2004a). Forecasting electricity consumption in New Zealand using economic and demographic variables. Energy 30 (10), 1833–1843. doi:10.1016/j.energy.2004.08.012
Mohamed, Z., and Bodger, P. (2004b). A comparison of Logistic and Harvey models for electricity consumption in New Zealand. Technol. Forecast. Soc. Change 72 (8), 1030–1043. doi:10.1016/j.techfore.2004.05.002
Morita, H., Kase, T., Tamura, Y., and Iwamoto, S. (1996). Interval prediction of annual maximum demand using grey dynamic model. Int. J. Electr. Power Energy Syst. 18 (7), 409–413. doi:10.1016/0142-0615(95)00019-4
Pektas, A. O., and Cigizoglu, H. K. (2013). ANN hybrid model versus ARIMA and ARIMAX models of runoff coefficient. J. Hydrology 50 (13).
Sarduy, J. R. G., Di Santo, K. G., and Saidel, M. A. (2016). Linear and non-linear methods for prediction of peak load at University of Sao Paulo. Measurement, 78. doi:10.1016/j.measurement.2015.09.053
Sarkodie, S. A. (2017). Estimating Ghana's electricity consumption by 2030:An ARIMA forecast. Energy Sources Part B-economics Plan. Policy 12 (10), 936–944. doi:10.1080/15567249.2017.1327993
Toyoda, J., Chen, M., and Inoue, Y. (1970). An application of state estimation to short-term forecasting. IEEE Trans PAS 89 (7). doi:10.1109/tpas.1970.292823
Vu, D. H., Muttaqi, K. M., and Agalgaonkar, A. P. (2015). A variance inflation factor and backward elimination-based robust regression model for forecasting monthly electricity demand using climatic variables. Appl. Energy, 140. doi:10.1016/j.apenergy.2014.12.011
Keywords: electricity sales, investors, correlation, random forest, calculation accuracy
Citation: Zhou J, Tuo J, Wang L, Shi Y and Zha W (2023) Calculation of electricity sales based on multi-factor correlation analysis. Front. Energy Res. 11:1326100. doi: 10.3389/fenrg.2023.1326100
Received: 22 October 2023; Accepted: 28 November 2023;
Published: 29 December 2023.
Edited by:
Lu Zhang, China Agricultural University, ChinaReviewed by:
Yunhao Zhao, North China Electric Power University, ChinaCopyright © 2023 Zhou, Tuo, Wang, Shi and Zha. This is an open-access article distributed under the terms of the Creative Commons Attribution License (CC BY). The use, distribution or reproduction in other forums is permitted, provided the original author(s) and the copyright owner(s) are credited and that the original publication in this journal is cited, in accordance with accepted academic practice. No use, distribution or reproduction is permitted which does not comply with these terms.
*Correspondence: Wenting Zha, d3R6aGFAY3VtdGIuZWR1LmNu
Disclaimer: All claims expressed in this article are solely those of the authors and do not necessarily represent those of their affiliated organizations, or those of the publisher, the editors and the reviewers. Any product that may be evaluated in this article or claim that may be made by its manufacturer is not guaranteed or endorsed by the publisher.
Research integrity at Frontiers
Learn more about the work of our research integrity team to safeguard the quality of each article we publish.