 Hang Yang
 Yutong Liu
 Binghong Pan*
- Highway Academy, Chang’an University, Xi’an, China
Due to the rapid growth of traffic volume, some existing expressways are being transformed into two-way ten-lane configurations. The increased lane flexibility of two-way ten-lane expressways implies a more serious mixing of passenger and freight traffic, thus necessitating a focus on traffic organization, especially at bottleneck sections. This study, based on field-measured data and traffic simulation, investigates the traffic applicability of five expressway entrance forms: conventional interchange entrance ramp (CI), passenger vehicles and trucks separation (PVTS), lanes separation around interchange (LSI), both left-side and right-side entrance ramp (LRER) and the stacked composite cross-section expressway (CCE). Using a comprehensive evaluation method, it provides optimal design solutions for varying traffic volumes, truck ratios, and merging ratios. Comprehensive evaluation results indicate that for one-way total traffic volumes exceeding 9,000 veh/h and truck ratios above 25%, the PVTS form should be prioritized. The LSI scheme demonstrates significant advantages when the truck proportion is below 30% and the merging ratio is above 20%. Additionally, due to its relatively low construction cost, it can serve as a good substitute for the PVTS approach. The LRER plan is unsuitable for entrance sections due to poor traffic capacity, increased CO emissions, and foreseeable safety issues. The strengths and applicability of PVTS, LSI, and CCE can guide the choice of entrance forms for ten-lane expressways.
1 Introduction
Expressways play a central role in transportation as a significant component of modern transportation networks. Developing countries consider the construction of expressways as a national strategy to meet the growing travel demands of the population and promote regional economic development. Research has suggested that the increased travel convenience brought by expressways significantly contributes to urban economic growth (Han and Gao, 2010).
However, the rapid economic development in recent years has also created an imbalance between transportation demand and infrastructure conditions. Particularly, numerous four-lane or six-lane expressways constructed initially have struggled to handle the growing traffic volumes in developing countries such as China, urgently requiring expansion from the original alignments. Despite the precedents of construction and operation of expressways with more than 10 lanes of cross-section in developed countries, the frequent lane changes and complex interweaving behaviors at diverging and merging areas are still a cause for concern (Golob et al., 2004; Kononov et al., 2008).
Experts in China’s transport construction industry have proposed the use of composite sections to deal with complex merging and diverging flows by dividing lanes in the same direction into two levels (Sun et al., 2021; Weibin et al., 2021). Inevitably, this approach suffers from a significant increase in construction costs, making it uneconomical under certain design traffic conditions. Therefore, the exploration of new design and traffic organization strategies for multi-lane expressway interchanges is urgently needed, as well as essential for supporting policy revision and implementation for expressway upgrading and expansion in developing countries.
Despite ten-lane expressways providing more flexibility to drivers changing lanes when they are dissatisfied with driving conditions of the current lane, the lack of appropriate lane restriction management will also create a more severe mixing of different-sized vehicles.
The coexistence of various types of vehicles can lead to non-negligible safety issues. Data from the Federal Motor Carrier Safety Administration (FMCSA) indicates that passenger vehicle occupants accounted for the highest percentage of fatalities in accidents involving large trucks, at 34.1% (FACTS, 2020). This may be attributed to significant differences in outline dimensions, kinetic characteristics, and driver styles among various vehicle types, particularly passenger vehicles that possess a relatively fragile body structure compared to trucks.
Additionally, some industry organizations have conducted in-depth investigations and studies on the safety, economic, social, and environmental effects of lane restriction strategies (Borchardt et al., 2004; Fontaine et al., 2009). By restricting trucks to use only the rightmost lane on the I-10 expressway in Louisiana, United States, traffic safety significantly improved as both the number and severity of accidents reduced, especially those involving trucks (Ishak et al., 2012). Similarly, the I-40 expressway in Tennessee, United States, has also achieved improvements in road safety through enhanced safety measures, including lane restrictions and following distance control (Stammer and Shannon, 2010).
Furthermore, trucks usually operate at lower speeds due to the limitations of their power characteristics and impact on load, further causing lane restriction measures to affect road capacity. Specifically, queuing and deceleration often occur following trucks when various types of vehicles share lanes. In 1992, researchers in the United States noticed this phenomenon and introduced the concept of the “bottleneck effect” (Gazis and Herman, 1992). Researchers have investigated the formation mechanisms, impact effects, and control strategies of moving bottlenecks from the perspectives of traffic waves, numerical methods, and traffic flow models (Daganzo and Laval, 2005b; a; Yamamoto et al., 2006; Singh and Santhakumar, 2022). However, these studies primarily focused on basic road sections and have not considered the impact of bottleneck effects on the merging and diverging areas of interchanges.
When lane separation for trucks and passenger vehicles is implemented in high traffic density conditions, the performance and vehicle types on each lane tend to be consistent, leading to the formation of vehicle platoons with similar speeds and smaller following distances, referred to as homogeneous traffic flow (Kerner and Konhäuser, 1993; Verma, 2016). The short time headways and inhomogeneous traffic flow can make it difficult for other vehicles to merge. Although lane restrictions are usually removed at expressway entrances and exits, the curb lanes remain in a relatively high proportion during such periods, leading to the occurrence of approximate homogeneous traffic flow on the curb lanes. This contributes to the challenge for vehicles on the entrance ramp to merge into the mainline, meanwhile obstructed visibility for passenger vehicles on the fast lanes, resulting in difficulty in reading signs and recognizing exits. Researchers attribute the impact of large vehicles on expressway entrance and exit ramp vehicles to the “barrier effect” of large vehicles and provide a macro-level explanation for this effect (Gan and Jo, 2003; Jo et al., 2003).
Therefore, aiming to reduce the probability of accidents on multi-lane expressways and fully utilize the capacity of multi-lane expressways, appropriate lane management measures should be implemented for multi-lane expressways (El-Tantawy et al., 2009; Davis, 2012). Lane management methods for ten-lane expressways can be divided into several forms, including mixed passenger and freight traffic, lanes designated for passenger vehicles and trucks, hard separation between passenger and freight lanes, and dedicated lanes for passenger and freight vehicles. Furthermore, the adverse effects of large vehicles can also be mitigated through geometric design. Available geometric design strategies include conventional interchange entrance ramp (CI), passenger vehicles and trucks separation (PVTS), lanes separation around interchange (LSI), both left-side and right-side entrance ramps (LRER), and others (Chen et al., 2023b). These design strategies can better separate passenger vehicles and trucks, thereby reducing the impact of trucks. Additionally, as previously stated, to address limited land availability, narrow corridor widths, and excessive lane numbers leading to overly wide cross-sections, the concept of a stacked composite cross-section expressway (CCE) has been proposed.
Apart from considerations of traffic efficiency, the sustainability of road traffic infrastructure has also garnered continuous attention in recent years (Khurshid et al., 2023; Patel and Ruparathna, 2023). Some scholars have attempted to find answers for low-carbon road transportation in the integration of transportation-energy integration (Chen et al., 2023a; Jiang et al., 2023; Yuan et al., 2023). However, the geometric design of roads and traffic organization forms also play a pivotal role in addressing this issue. Different design schemes for expressway entrances and exits can lead to significant changes in traffic flow characteristics, potentially impacting fuel consumption and exhaust emissions of vehicles. Additionally, once the form of expressway entrances and exits is established, it often requires considerable cost to modify. Therefore, determining appropriate designs for expressway entrances and exits could be crucial for the sustainability of road traffic infrastructure.
Traffic simulation technology has experienced rapid development in recent years. Through traffic simulation technology, it is possible to simulate road traffic conditions for construction projects that have not yet been implemented, to assess congestion and safety. Representative software includes CORSIM, VISSIM, INTEGRATION, AIMSUN, SimTraffic (Bloomberg and Dale, 2000; Moen et al., 2000; Gao, 2008; Shaaban and Kim, 2015). Notably, it is necessary to calibrate and adjust simulation model parameters using real-world data to ensure the accuracy of the simulation (Toledo and Koutsopoulos, 2004; Rrecaj and Bombol, 2015).
The comprehensive evaluation method is a multi-index evaluation approach that comprehensively considers the importance and impact of various indicators, thereby obtaining more objective, scientific results. Commonly used methods include the entropy weight method, analytic hierarchy process, TOPSIS-Entropy method, and others (Vaidya and Kumar, 2006; Ding et al., 2016; Zhao et al., 2017; Shi et al., 2023). The comprehensive evaluation method has been widely applied in fields such as meteorology, architecture, ecology, and transportation (Zhao et al., 2009; Liu et al., 2017; Li et al., 2018; Wu and Hu, 2020; Pan et al., 2021). Compared with various subjective comprehensive evaluation models, the biggest advantage of the entropy weight method is that it avoids the interference of human factors on the weights of indicators, thus improving the objectivity of the comprehensive evaluation results. In the evaluation of schemes in the field of transportation, the entropy weight method can judge the advantages and disadvantages of schemes more objectively and comprehensively, instead of being limited to a single indicator (Liu et al., 2022). However, the entropy weight method also has issues, such as the potential for distortion in standardized results when there are too many zeros in the measured values. It also ignores the rank discrimination degree of the index, among other problems (Zhu et al., 2020).
There is currently no clear conclusion regarding the applicable conditions of various forms at the entrance of the expressway, especially the specific conditions under different proportions of truck and merging ratios. For ten-lane expressways, the “moving bottleneck effect” and “barrier effect” of large vehicles at the entrance need to be considered. The extent of the impact of these two effects at the entrance under various traffic organization methods still requires further research. Furthermore, the applicable boundaries of PVTS and CCE are still not well-defined.
The organization of the rest of this article is as follows: Section 2 primarily introduces data collection methods, the establishment and calibration of simulation models, and evaluation methods. Section 3 presents the situation of collected empirical data and the proposed design schemes for evaluation. Section 4 showcases the results and conducts sensitivity analysis. Section 5 discusses the results in detail, and the conclusion is presented in Section 6.
2 Methodology
In this paper, empirical data are used to calibrate the parameters of the simulation model, followed by verification. Subsequently, the simulation model is employed to conduct a comprehensive evaluation of the entrance design schemes for a ten-lane expressway. The evaluation is based on the entropy method, three indicators are selected for comprehensive evaluation, to determine the optimal solution under different traffic volumes and truck ratios.
2.1 Data collection method
Data collection should be conducted under conditions without traffic accidents and road maintenance. Clear weather without significant crosswinds or severe haze should also be ensured. Additionally, the data collection location should have a favorable terrain and unobstructed line of sight to avoid influencing drivers’ behavior (Tian et al., 2023).
Data collection is conducted using roadside laser traffic surveyors (Figure 1). The laser device is set on either the paved or unpaved shoulder during the survey, aligned vertically to the lane and the driving direction of the vehicles. The instrument continuously emits 10 kHz laser pulses at the vehicle’s chassis position, measuring the time of the reflected laser pulses. With the accompanying Nano-L software, it can record the driving position, speed, passage time, wheelbase, and other parameters of each vehicle as it passes through the section.
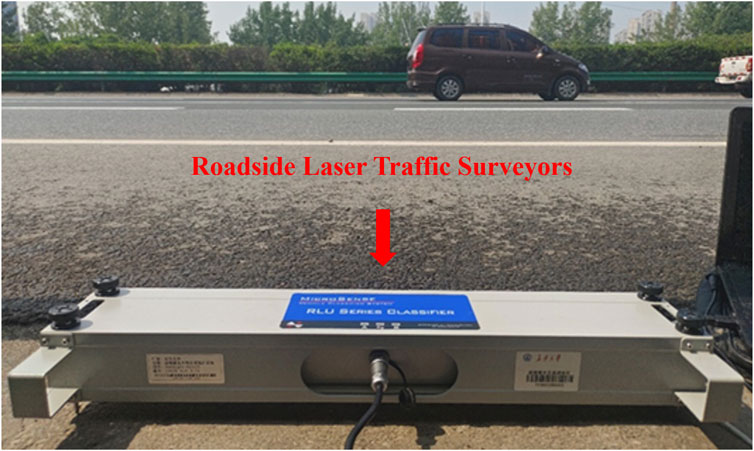
FIGURE 1. Roadside laser traffic surveyor.
The types of data to be collected include vehicle counts for both passenger vehicles and trucks, as well as traffic volumes and merging speeds for both types of vehicles on the mainline and ramp. The collected data will be used for parameterization and model calibration in traffic simulation.
2.2 Simulation model
2.2.1 Model development
Currently, the number of ten-lane expressways that have been completed and opened to traffic is extremely limited, with the vast majority of ten-lane expressways still in the planning or construction phase in China. Consequently, the evaluation of various design schemes necessitates reliance on VISSIM, a sophisticated traffic flow simulation software. This software is capable of modeling the behaviors and interactions of individual road users and vehicles at a microscopic level, as well as simulating traffic dynamics and network performance at a mesoscopic level.
It is essential to use traffic characteristics and vehicle trajectories consistent with the empirical data and to have the same geometric features as the data collection site to ensure the accuracy of the model.
Additionally, to ensure fairness in comparing different scenarios, when setting up VISSIM nodes, it should be ensured that the nodes cover equal lengths of the mainline and ramps, and they should fully encompass the ramp diverge area and the mainline-ramp merge area.
2.2.2 Model calibration
Initially, the distribution of vehicle speeds and headways, derived from the collected data, are input into the model as critical parameters for calibration. Furthermore, parameters governing vehicle lane-changing behavior are adjusted following prior experience to align them more closely with the observed driving habits on Chinese expressways.
The model calibration process involves calculating the discrepancies between observed values and simulated values for capacity, density, and subsequently, the simulation accuracy of speed. Among these, the mean absolute percentage error (MAPE) is often used as a measure of accuracy in calibration (Bowerman et al., 2004). MAPE can be calculated according to equations Eq. 1 and Eq. 2.
Where
For design schemes lacking empirical data, corresponding speed, density, and traffic volume can be calculated based on the simulation results using equations Eqs 3–5. Since multiple simulation segments make up a specific entrance type, the three-parameter average value for the entire segment needs to be derived from the three-parameter data of various local simulation segments.
Where
Considering that measuring road sections shorter than the length of a passenger vehicle is meaningless, the results of road sections with connectors shorter than 6 m should be disregarded.
According to the Greenshields model, there exists a linear relationship between traffic density (K) and speed (V) (Figure 2). The linear relationship of K-V can provide another perspective for the validation and calibration of the model.
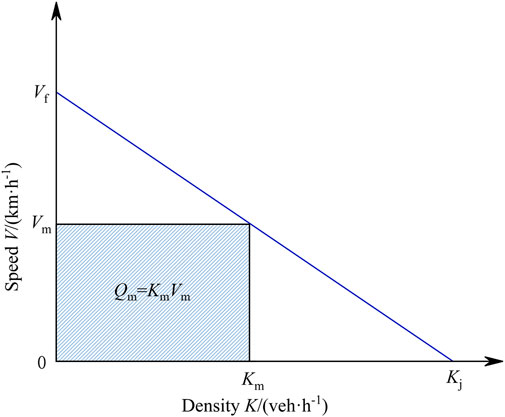
FIGURE 2. K-V relationship based on Greenshields model.
The coefficient of determination R2 represents the percentage of the variance in the data that is explained by the model. Its computation is based on the total sum of squares (TSS), the regression sum of squares (RSS), and the error sum of squares (ESS). R2 is calculated as shown in equation Eqs 6–9.
Where
2.3 Evaluation method
2.3.1 Principle of evaluation method
The entropy method is a comprehensive evaluation approach. It determines the objective weights based on the variability of indicators. If the entropy of a certain indicator is smaller, it indicates that the degree of variation in the indicator values is greater, providing more information and thus having a greater impact on the comprehensive evaluation, resulting in a higher weight. Conversely, if the entropy of a certain indicator is larger, it indicates that the variation in the indicator values is smaller, providing less information and thus having a smaller impact on the comprehensive evaluation, resulting in a lower weight. The specific steps are shown in Eqs 10–17.
1. Data standardization
Suppose we choose k indices
To avoid the impact of non-unification of units of measurement for indicators, the data of each indicator should be standardized first.
Suppose that the values of each indicator data after standardization are
For negative indicators, there are:
2. Find the weight of each indicator under each scheme
The proportion of the jth item to the overall index in the ith scheme is calculated as follows:
3. Find the information entropy of each index
The information entropy of a set of data is:
In particular, when
4. Determine the weights of each indicator
First, calculate the redundancy of information
Then calculate the index weight value according to this:
5. Calculate the comprehensive score of each scheme
2.3.2 Evaluation index selection
Factors such as traffic efficiency and environmental pollution, road capacity, delay, and CO emissions have been selected for evaluation, which are related to the sustainability of road infrastructure.
Road capacity is the most critical indicator for assessing whether a road meets its intended design level and fulfills the demand for road use. The differences in traffic capacity between different scenarios will result in their adaptability to varying traffic volumes.
Delay refers to the time lost by vehicles during travel due to interference from other vehicles beyond the driver’s control or unexpected obstacles, including parking delays and delays caused by operating at speeds lower than the ideal speed. It is an important indicator of traffic flow service level.
Carbon monoxide (CO) is generally considered one of the most harmful pollutants to human health in vehicle exhaust emissions (Brugge et al., 2007). Furthermore, CO emissions can also cause damage to the environment, thus affecting the sustainability of road infrastructure.
3 Data and design description
3.1 Case description
For our study, we chose two interchanges to collect traffic flow data. The Baqiao Interchange on the Xi’an Ring Expressway features two lanes in each direction, with a design speed of 120 km/h. On the other hand, the Qujiang Interchange on the Baomao Expressway has four lanes in each direction, also with a design speed of 120 km/h.
3.2 Data collection
Data is collected at merging points at the entrance of the Bao Mao Expressway and Xi’an Ring Expressway. The locations of these two interchanges are shown in Figure 3. Data quantity, vehicle type, and speed are summarized in Table 1. The speed distribution at the merging point of the two interchanges is shown in Figure 4. Based on previous experience, the time of data collection was chosen to be between 11:00 and 16:00 to match the local peak hours in Xi’an.
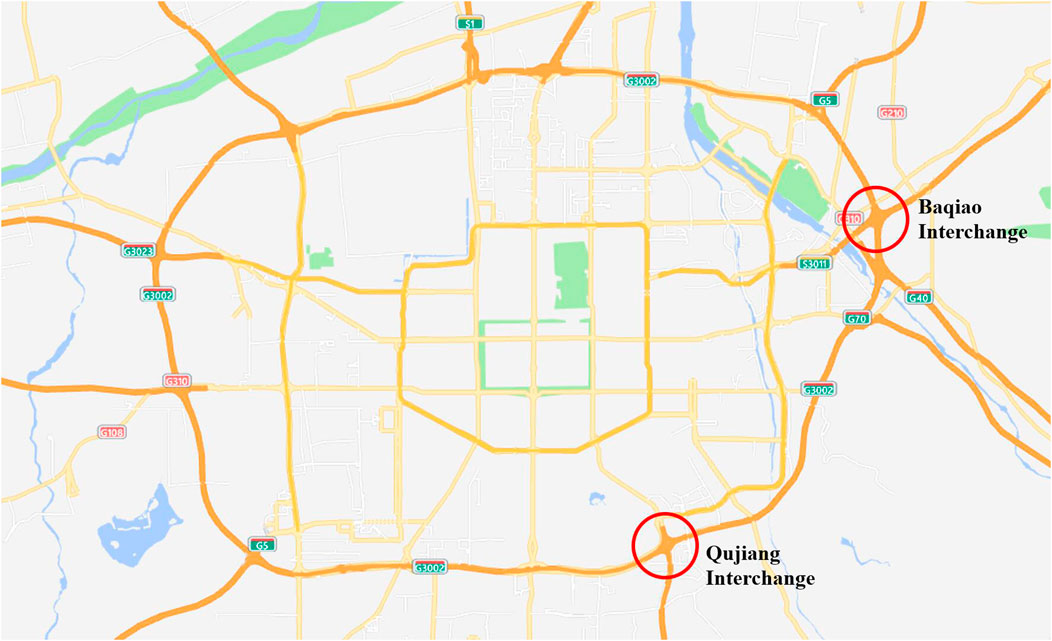
FIGURE 3. Interchange location for data collection.

TABLE 1. Collected vehicle data statistics.
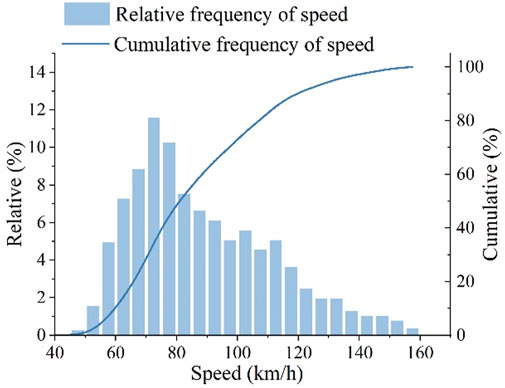
FIGURE 4. Distribution of vehicle speeds.
3.3 Design scheme
3.3.1 CI
The conventional interchange entrance ramp (CI) scheme does not require additional construction work; instead, it only necessitates the addition of specific signs to implement lane restriction measures, making it the most cost-effective option. Lane restriction refers to traffic control measures that restrict specific types of vehicles from traveling in certain lanes. Lane restriction management is relatively flexible, but the selection of its combination methods can be complex. Moreover, the phenomenon of mixing truck and passenger vehicles still exists at interchange entrances and exits, service areas, and other sections.
There are various ways to implement lane restrictions, but they can generally be divided into two types: one is to separate trucks and passenger vehicles into different lanes, with trucks in the truck lanes and passenger vehicles in the passenger vehicle lanes; the other is to designate certain lanes as exclusive lanes for either trucks or passenger vehicles, while the remaining lanes allow mixed traffic of both trucks and passenger vehicles.
To align with the expressway conditions in China and support rigorous research, this paper adopts a prevalent traffic management strategy in China. In this approach, trucks utilize designated lanes, whereas passenger vehicles face no specific lane restrictions.
Since there is no separate ramp for designated vehicle types, trucks, and passenger vehicles will merge from a single ramp into the mainline.
The scheme is illustrated in Figure 5A.
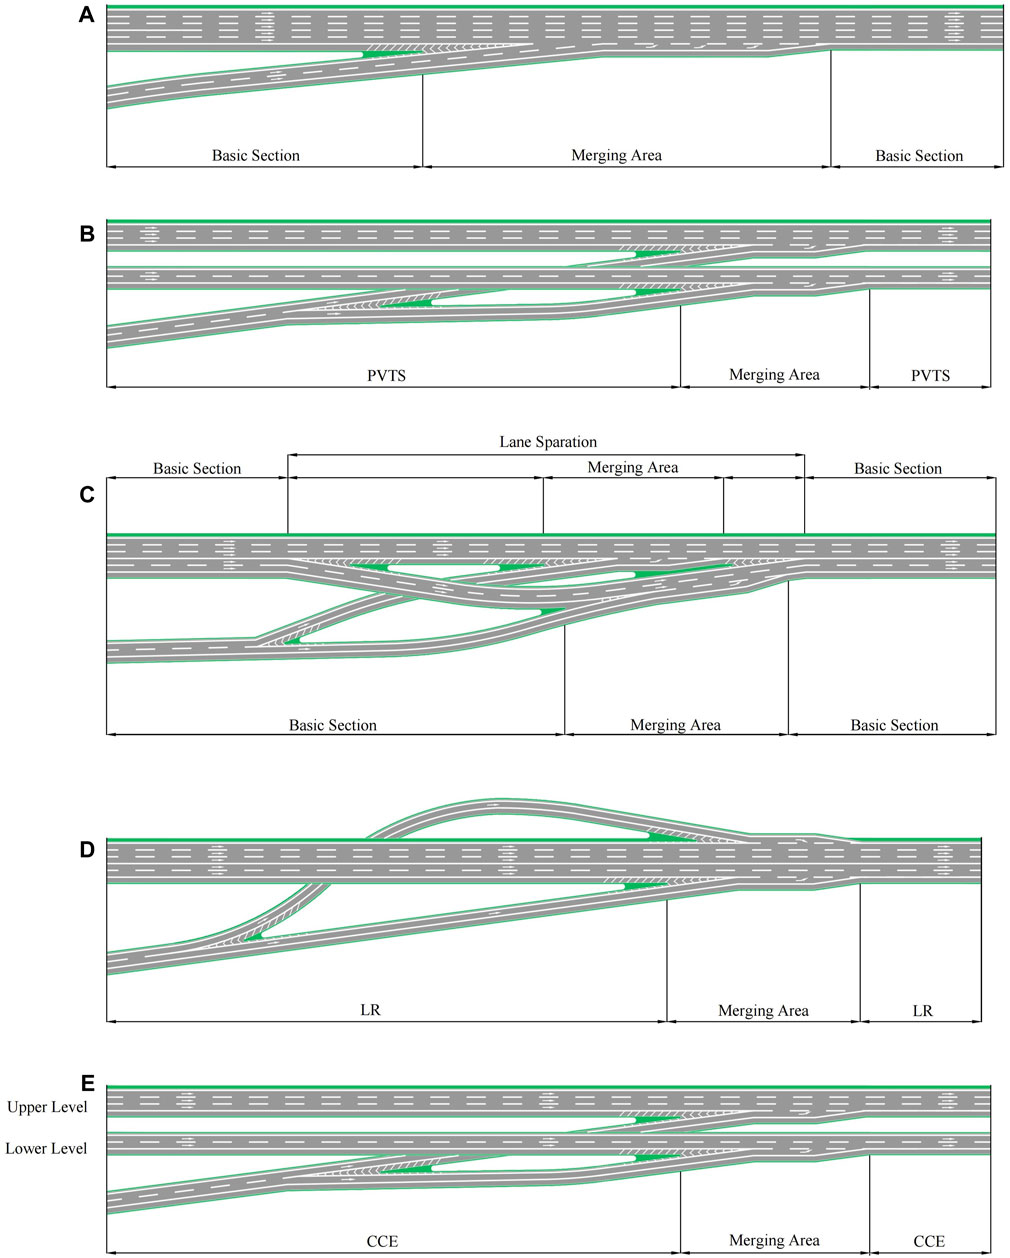
FIGURE 5. Comparative schematic diagrams of various schemes. (A) Schematic diagram of CI Scheme. (B) Schematic diagram of PVTS Scheme. (C) Schematic diagram of LSI Scheme. (D) Schematic diagram of LRER Scheme. (E) Schematic diagram of CCE Scheme.
3.3.2 PVTS
The passenger vehicle and truck separation (PVTS) scheme utilizes physical separation to segregate truck and passenger vehicles, providing both directions with inner and outer lanes that are mutually separated. At the on-ramp, trucks, and passenger vehicles will be separated to enter the mainline through their ramp. This lane management approach physically separates trucks and passenger vehicles, improving the speed of passenger vehicles and reducing accident rates. PVTS can also design road geometry and traffic safety facilities based on the characteristics of truck and passenger vehicles, greatly ensuring the efficiency of large vehicle travel. In complex expressway systems, the PVTS scheme may have broad prospects for application.
In the same direction, there are five lanes, which can be represented as X + Y, where X is the number of lanes dedicated to small vehicles, and Y is the number of lanes dedicated to large vehicles. It is not difficult to understand that under the conditions of X ≥ 1 and Y ≥ 1, there are a total of 4 combinations of lanes dedicated to small and large vehicles in the X + Y format. However, to meet the overtaking needs, the “1 + 4”and “4 + 1”schemes should be excluded. Additionally, in the vast majority of cases, the number of trucks is always less than passenger vehicles. Therefore, in this study, the PVTS scheme employs a more reasonable traffic organization format of “3 lanes for passenger vehicles +2 lanes for trucks.”
It is foreseeable that the scheme will likely be more costly. At the same time, it will likely be less flexible concerning the proportion of trucks, as the physical separation between the passenger vehicle and truck lanes will likely result in some of the five lanes being wasted while others are extremely congested.
The scheme is illustrated in Figure 5B.
3.3.3 LSI
The lanes separation around interchange (LSI) scheme can be considered a cheap alternative to PVTS. The LSI scheme was proposed because of the high cost of the PVTS, which requires the subgrade to be separated or placed in levels above and below. This scheme separates the subgrade only at the exit and entrance sections to place dedicated ramps for passenger vehicles and trucks, while only soft segregation is used on the basic section. This scheme combines the advantages of soft segregation and the PVTS scheme, and the passenger vehicles can also drive in the two lanes on the right side, avoiding the waste of the dedicated lanes for trucks when the percentage of truck traffic is not high and may have better flexibility and adaptability.
The mainline separation position for LSI should match the decision sight distance of 12–14 s at the exit taper start point, which is approximately 1,500 feet (450 m).
The schematic of this scheme is shown in Figure 5C.
3.3.4 LRER
Due to space constraints and other reasons, in some areas where the PVTS scheme is applicable, it is not possible to separate the subgrade to accommodate two right-side entrances. Therefore, both the left-side and right-side entrance ramp (LRER) scheme of allowing passenger vehicles to enter from the left and trucks from the right is adopted. Although LRER occupies less land and has lower construction costs, it should be noted that there may be more serious safety issues associated with this scheme. Under the left-hand driving rules, the left lane is typically used as an overtaking lane, and vehicles on this lane tend to have higher operating speeds. Therefore, entrance vehicles merging onto the mainline may face greater speed differentials and increased collision risks.
The scheme is illustrated in Figure 5D.
3.3.5 CCE
The stacked composite cross-section expressway (CCE), as illustrated in Figure 5E, represents a commonly employed design within complex expressway systems. Instead of separating passenger vehicles from trucks, this design separates transit traffic from short-distance traffic. In situations where the presence of trucks is not predominant, implementing the PVTS scheme may lead to an excessive allocation of lanes for trucks, potentially resulting in underutilization. However adjusting the number of dedicated truck lanes to just one might curtail the ability of trucks to overtake, thereby impeding traffic flow efficiency. Consequently, in such scenarios, the adoption of the CCE scheme proves to be a more suitable alternative.
In this scheme, two auxiliary lanes are situated on the lower level, while three main lanes with a closely geometric design are positioned on the upper level, all in the same direction. To ensure a smooth transition of traffic and efficient traffic management on both main lanes and auxiliary lanes, distinct entrances should be designated for each category.
3.4 Simulation design
For the five design schemes (CI, PVTS, LSI, LRER, CCE) on a ten-lane expressway entrance, this study considers a total of 450 scenarios by examining six total input traffic volumes (5000veh/h, 6000veh/h, 7000veh/h, 8000veh/h, 9000veh/h, 10000veh/h), five passenger-to-freight ratios (0.8:0.2, 0.75:0.25, 0.7:0.3, 0.65:0.35, 0.6:0.4), and three merge rates (10%, 20%, 30%).
Geometric parameters are taken from the current Chinese expressway route design specifications. The length of acceleration lanes is 230 m for single-lane entrances and 400 m for dual-lane entrances. To meet lane balance requirements, dual-lane entrances require the addition of auxiliary lanes, with a length of 400 m. The length of all taper sections is uniformly set to 90 m.
To ensure the accuracy of simulation results, the simulation time for each scenario is set to 3,600 s.
4 Results and analysis
4.1 Calibration result
4.1.1 MAPE results
Both the Baqiao Interchange and the Qujiang Interchange have adopted the CI scheme. Therefore, MAPE values were calculated for this scheme only. The calculation results are shown in Table 2.
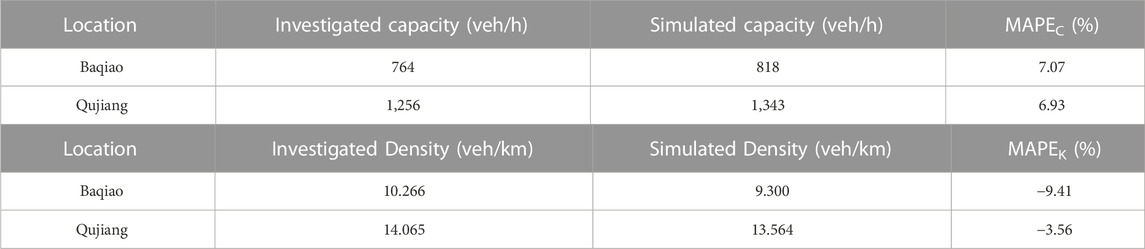
TABLE 2. MAPE calculation results.
This estimation error is acceptable for engineering applications (Xiang et al., 2016).
4.1.2 K-V linear fitting
The input traffic volume for the five schemes is increased from 1000veh/h to 19000veh/h in increments of 1000veh/h, resulting in 19 groups. Each group is simulated 10 times. For each simulation result, density, velocity, and flow are calculated using Eqs 3–5 respectively. The K-V scatterplots for the five design schemes are shown in Figure 6.
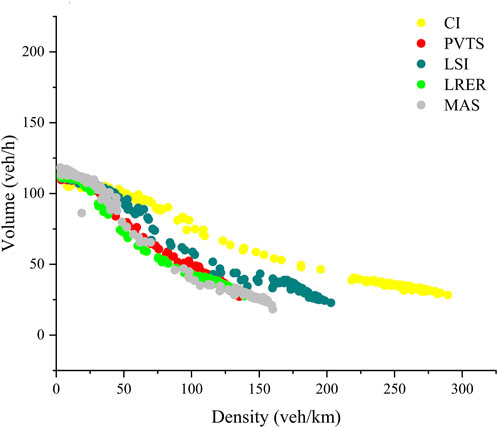
FIGURE 6. K-V scatterplots for the five design schemes.
Linear fits of the K-V relationships are conducted for each of the five design schemes, and the determination R2 is shown in Table 3.
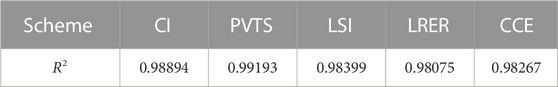
TABLE 3. Linear fitting of R2 values for different design schemes.
The R2 values for the fits are all greater than 0.98, indicating a significant linear relationship between density and velocity in the simulation results. This suggests that the simulation results are valuable for research purposes.
4.2 Sensitivity analysis
Three key evaluation indexes (delay, capacity, CO emissions) were selected for the commonly used and representative 20% merge rate. Four improvement schemes (PVTS, LSI, LRER, CCE) were applied, and their respective improvements over CI were depicted in Figures 7–10.
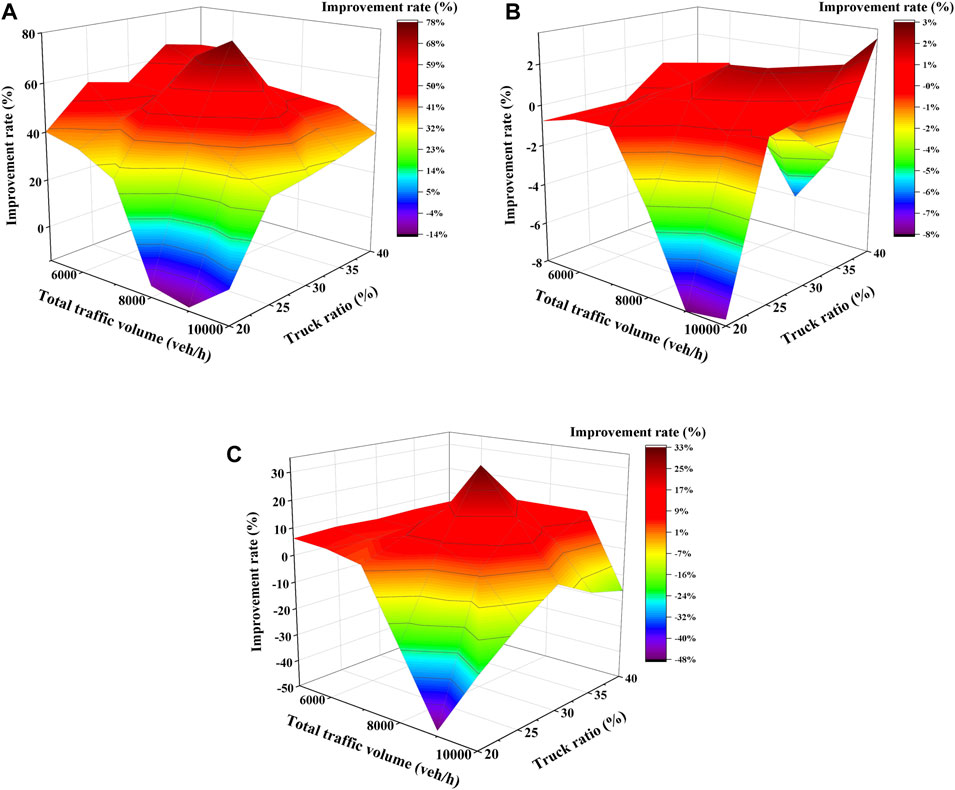
FIGURE 7. PVTS improvement rate of (A) delay (B) capacity (C) CO emission.
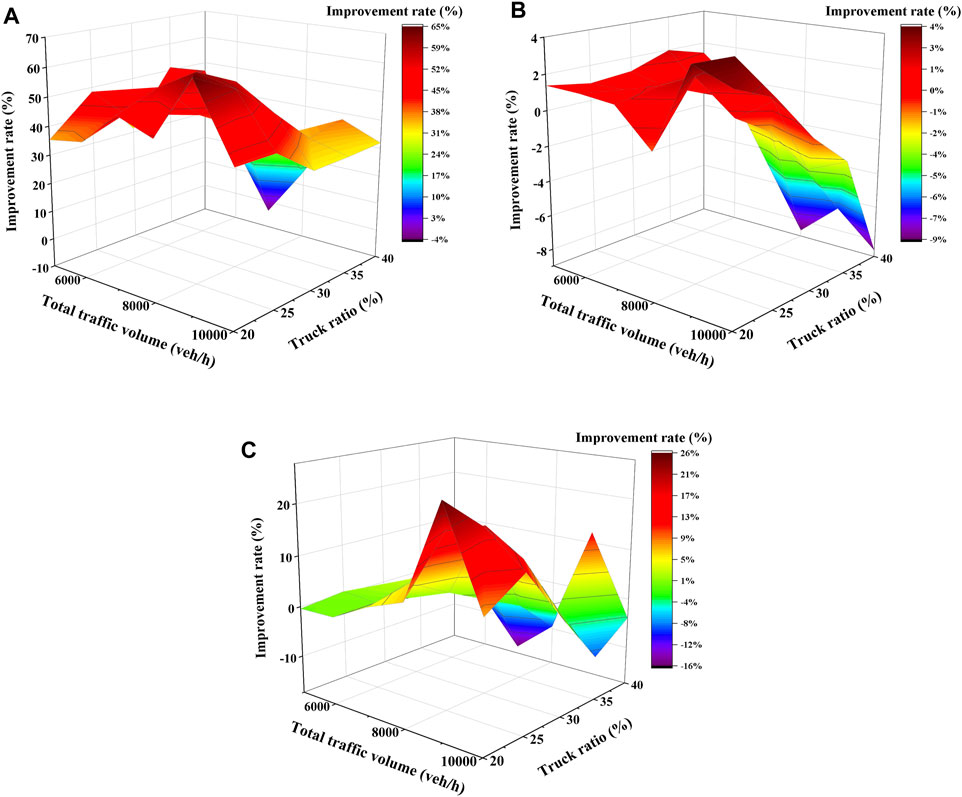
FIGURE 8. LSI improvement rate of (A) delay (B) capacity (C) CO emission.
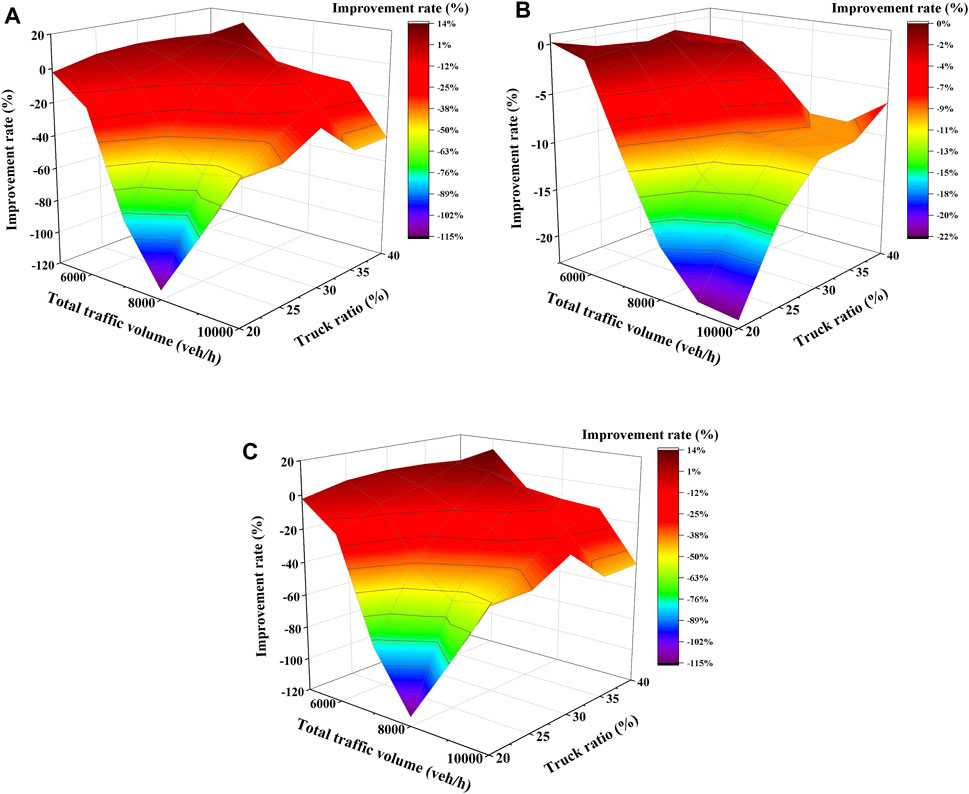
FIGURE 9. LRER improvement rate of (A) delay (B) capacity (C) CO emission.
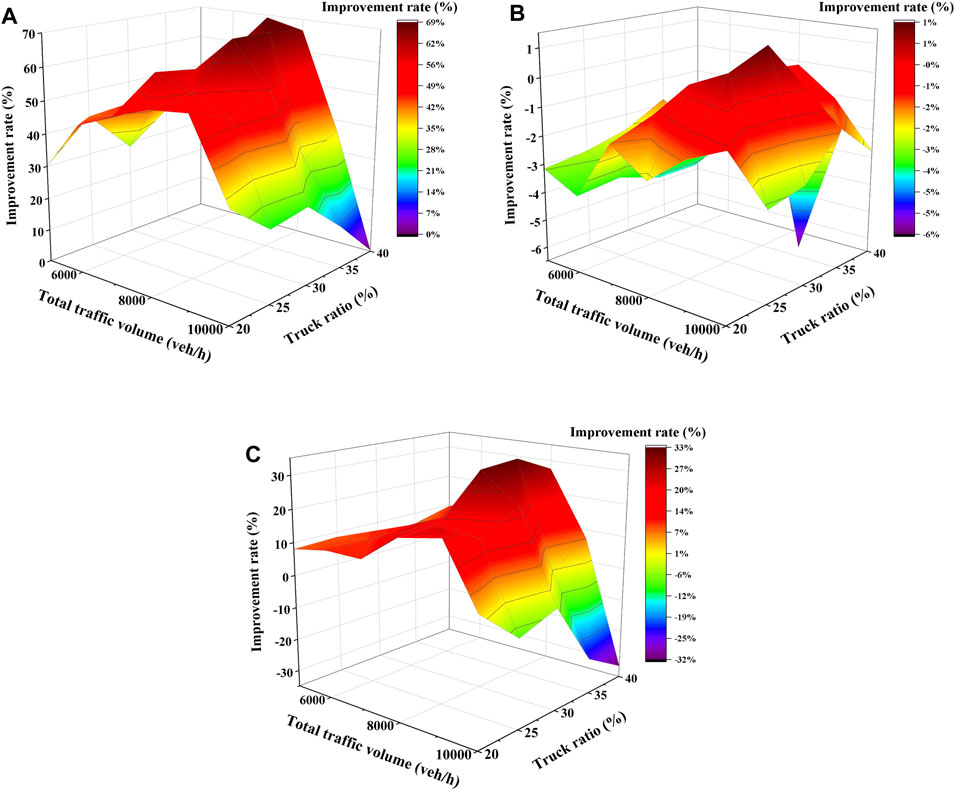
FIGURE 10. CCE improvement rate of (A) delay (B) capacity (C) CO emission.
In some scenarios, the PVTS scheme shows significant improvements in delay and CO emissions compared to the CI scheme, with maximum improvement rates of approximately 78% and 33%, respectively. The highest improvement rates are observed at around a total traffic volume of 8000 veh/h and a 30% truck ratio. However, there is not much variation in terms of capacity compared to CI. It is also worth noting that although the PVTS scheme exhibits improvements in delay and capacity to some extent under high traffic volume and a high truck ratio, it has a negative impact on CO emissions. This may indicate that the scheme is not environmentally friendly.
The LSI scheme generally exhibits significant advantages in terms of delay, capacity, and CO emissions compared to CI when the truck ratio is less than 30%. However, when the truck ratio exceeds 30%, the improvement rates for these factors sharply decrease, resulting in negative improvements.
The LRER scheme effectively reduces delay when the truck ratio is high, but it generally has a negative impact on capacity and CO emissions in most scenarios. It should be noted that LRER may have significant safety issues, and even though it improves delay to some extent in scenarios with a high truck ratio, its usage should still be avoided whenever possible.
The CCE scheme shows improvements in delay compared to CI in most scenarios. However, improvement rates for capacity and CO emissions become negative when the traffic volume is greater than 9000veh/h and the truck ratio exceeds 25%. This suggests the applicable conditions for the two common traffic organization forms on a dual-direction ten-lane expressway: for a single-direction traffic volume exceeding 9000veh/h and a truck ratio greater than 25%, it is advisable to prioritize the PVTS scheme.
4.3 Comprehensive evaluation result
CI is labeled as 1, PVTS as 2, LSI as 3, LRER as 4, and CCE as 5. The scheme with the highest overall evaluation score is considered the optimal scheme. Schematic diagrams of the optimal scheme are created for different traffic volumes and truck ratios at three merge rates (10%, 20%, 30%), as shown in Figure 11.
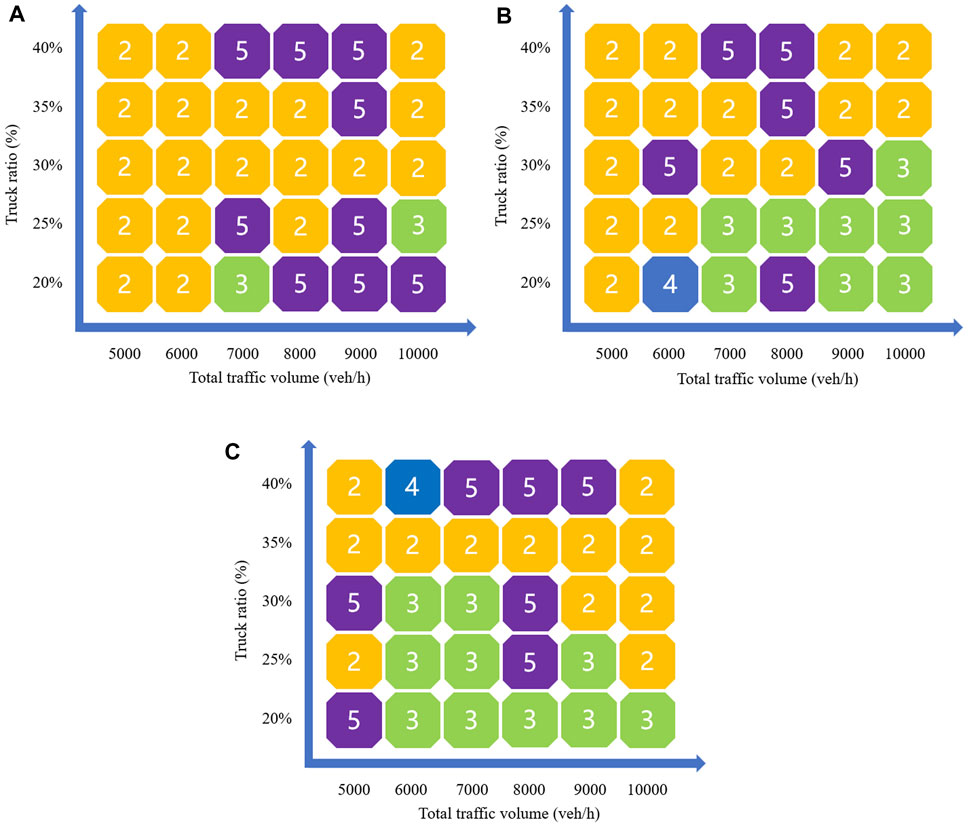
FIGURE 11. The optimal scheme under (A) 10% merge ratio (B) 20% merge ratio (C) 30% merge ratio.
From the figure, it can be observed that PVTS, LSI, and CCE all exhibit a certain degree of competitiveness and often become the optimal solutions. On the other hand, CI and LRER have rarely taken a leading position, especially CI, which is surpassed by other schemes under various conditions.
Under a 10% merge rate, the PVTS scheme exhibits strong competitiveness under both high and low passenger-freight ratios. The remaining positions are predominantly occupied by the CCE scheme, particularly concentrated around 20% and 40% truck ratios.
When the merge rate reaches the more common 20%, the LSI scheme starts to gain an advantage. It partially replaces PVTS and CCE in scenarios with truck ratios between 20% and 30% and traffic volumes exceeding 7000veh/h. It is worth emphasizing once again that LSI, due to its separation of roadbed only at entrance and exit locations and the use of soft barriers elsewhere, has lower costs compared to PVTS and CCE schemes.
Under a 30% merge rate, the traffic volume on ramps increases significantly, and vehicles merging onto the mainline have a greater impact on the mainline traffic flow. In this case, the range of advantages of LSI moves towards lower traffic volumes. That is, when the truck ratio is below 30%, the LSI solution shows more competitiveness. PVTS holds a dominant position under high truck ratios and high traffic volumes.
5 Discussion
Unlike the mandatory lane change at expressway exits, the lane change demand for vehicles at entrances is not as “strong”. Drivers can first merge into the rightmost lane on the mainline and then look for opportunities to merge into the ideal lane. Therefore, the continuous lane-changing behavior at entrances is significantly reduced compared to exits. This can explain to some extent the significant difference in optimal solutions between entrances and exits (Chen et al., 2023b).
From an overall evaluation of various schemes, LSI, with its lower cost and better overall rating at a 30% truck ratio, can be considered a cost-effective alternative to the PVTS scheme. This may be because LSI, with its more relaxed lane restrictions, to some extent, avoids the waste of double truck-exclusive lanes in the PVTS scheme at low truck ratios.
In Figure 11, it can be observed that CCE is not completely overtaken by PVTS at a 40% truck ratio and still maintains a certain advantage. One possible explanation is that at a 40% truck ratio, due to the increased number of trucks, it becomes more difficult for trucks to change lanes and merge into the truck-exclusive lanes at entrance ramps, resulting in more delays, lower traffic capacity, and higher CO emissions at the ramp. In contrast, the CCE scheme, with its mixed traffic organization, allows passenger vehicles and trucks to freely choose between the mainline and auxiliary lanes, reducing lane-changing behavior at the ramps.
It seems that the truck ratio does not have a decisive impact on the superiority of the CCE scheme. This may be because the CCE scheme does not restrict the travel lanes for trucks, resulting in less significant barrier effects from trucks. In contrast, the CI scheme, which imposes lane restrictions on trucks, still results in significantly higher truck ratios in the right lanes, even after removing lane restrictions and adding auxiliary lanes before the entrance. The likely reason is that the left-side passenger vehicle exclusive lane operates at a higher speed, prompting truck drivers to change lanes but still struggling to find suitable merging gaps, leading them to continue in the right lane. This, in turn, hinders the merging of entrance vehicles onto the mainline, causing significant delays and restricting traffic capacity.
The LRER scheme significantly reduces delays when the truck ratio is relatively high. One possible explanation is that the LRER scheme is still based on the PVTS scheme with modifications, and the separation of passenger vehicles and trucks allows for lower delays even at high truck ratios. However, the increase in CO emissions and the decrease in traffic capacity may be due to the significant speed difference between the far-left lane on the passenger vehicle exclusive lane and the entrance ramp, leading to more frequent deceleration and stop-and-go traffic.
Moving on, let’s begin discussing the limitations of this study. The scope and limitations of this research mainly include the following points:
1. Due to the limited availability of fully operational ten-lane highways in China, this study is based on VISSIM traffic simulation, with model calibration and lacking validation from real-world data. Therefore, the simulation results in this study may have a certain margin of error and cannot be entirely equivalent to real-world data.
2. This study only considers the traffic flow characteristics of various schemes under different traffic volumes, truck ratios, and merge ratios, without fully considering safety aspects such as collision probabilities and the severity of accidents. A comparison of safety among the various schemes remains a subject for further research.
In future research, attention may be focused on the following issues:
1. When allocating dedicated lanes, the sensitivity of lane restrictions to the proportion of trucks necessitates a potential increase in the number of lanes dedicated to trucks and a corresponding decrease in those allocated for passenger vehicles as the proportion of trucks increases.
2. Although serious safety issues are anticipated with the LRER scheme, this study did not specifically evaluate the safety of each scheme. Subsequent research can comprehensively consider factors such as the traffic efficiency, safety, environmental impact, and economic aspects of each scheme.
6 Conclusion
Due to the increasing truck ratio, the barrier effect of trucks has exacerbated congestion at expressway entrances. To address this issue, design schemes such as PVTS, LSI, LRER, and CCE are introduced, and VISSIM simulation is used to compare their capacity, delay, and CO emissions under different traffic volumes, truck ratios, and merge ratios. The aim is to find the optimal solution for different scenarios. This study concludes the following findings, providing data support and references for the construction of ten-lane expressways:
1. PVTS and CCE schemes, as the two most important traffic organization forms for composite expressways, have different suitability conditions. In bidirectional ten-lane expressways, when the total one-way traffic volume exceeds 9,000 veh/h and the truck ratio is above 25%, the passenger and freight separation organization should be prioritized.
2. The LSI scheme shows significant advantages when the truck ratio is below 30% and the merge ratio is above 20%. Additionally, due to its relatively low construction cost, it can serve as a good alternative to the PVTS scheme.
3. The LRER scheme, due to its poor traffic capacity, higher CO emissions, and foreseeable safety issues, is not suitable for entrance sections.
Data availability statement
The raw data supporting the conclusion of this article will be made available by the authors, without undue reservation.
Author contributions
HY: Conceptualization, Writing–original draft, Formal Analysis, Investigation, Methodology, Visualization, Writing–review and editing. YL: Conceptualization, Formal Analysis, Methodology, Visualization, Writing–original draft, Writing–review and editing. BP: Conceptualization, Funding acquisition, Methodology, Project administration, Writing–original draft, Writing–review and editing. XR: Formal Analysis, Writing–original draft. JZ: Formal Analysis, Investigation, Writing–original draft. HY: Investigation, Writing–original draft.
Funding
The author(s) declare financial support was received for the research, authorship, and/or publication of this article. This work was supported by the Natural Science Basic Research Program of Shaanxi Province (Program No. 2023-JC-QN-0560), the Scientific Research Program Funded by Shaanxi Provincial Education Department (Program No. 21JK0908).
Acknowledgments
The authors would like to acknowledge the Department of Science and Technology of Shaanxi Province, Shaanxi Provincial Education Department for partially funding this work.
Conflict of interest
The authors declare that the research was conducted in the absence of any commercial or financial relationships that could be construed as a potential conflict of interest.
Publisher’s note
All claims expressed in this article are solely those of the authors and do not necessarily represent those of their affiliated organizations, or those of the publisher, the editors and the reviewers. Any product that may be evaluated in this article, or claim that may be made by its manufacturer, is not guaranteed or endorsed by the publisher.
References
Bloomberg, L., and Dale, J. (2000). Comparison of VISSIM and CORSIM traffic simulation models on a congested network. Transp. Res. Rec. 1727 (1), 52–60. doi:10.3141/1727-07
Borchardt, D. W., Jasek, D. L., and Ballard, A. J. (2004). Monitoring of Texas vehicle lane restrictions. Texas: Texas Transportation Institute.
Bowerman, B., O’Connell, R., and Koehler, A. (2004). Forecasting: methods and applications. Belmont, CA: Thomson Brooks/Cole.
Brugge, D., Durant, J. L., and Rioux, C. (2007). Near-highway pollutants in motor vehicle exhaust: a review of epidemiologic evidence of cardiac and pulmonary health risks. Environ. health 6 (1), 23–12. doi:10.1186/1476-069x-6-23
Chen, F., Xia, M., Chen, Q., and Yang, L. (2023a). Resilience enhancement method against persistent extreme weather with low temperatures in self-sustained highway transportation energy system. IEEE Trans. Industry Appl., 1–14. doi:10.1109/tia.2023.3290569
Chen, Q., Pan, B., and Liu, Y. (2023b). Understanding the performance of multilane expressway exit design and a traffic organization strategy based on VISSIM micro-simulation and a comprehensive evaluation method. Appl. Sci. 13 (12), 7094. doi:10.3390/app13127094
Daganzo, C. F., and Laval, J. A. (2005a). Moving bottlenecks: a numerical method that converges in flows. Transp. Res. Part B Methodol. 39 (9), 855–863. doi:10.1016/j.trb.2004.10.004
Daganzo, C. F., and Laval, J. A. (2005b). On the numerical treatment of moving bottlenecks. Transp. Res. Part B Methodol. 39 (1), 31–46. doi:10.1016/j.trb.2004.02.003
Davis, L. (2012). Mitigation of congestion at a traffic bottleneck with diversion and lane restrictions. Phys. A Stat. Mech. its Appl. 391 (4), 1679–1691. doi:10.1016/j.physa.2011.10.036
Ding, L., Shao, Z., Zhang, H., Xu, C., and Wu, D. (2016). A comprehensive evaluation of urban sustainable development in China based on the TOPSIS-entropy method. Sustainability 8 (8), 746. doi:10.3390/su8080746
El-Tantawy, S., Djavadian, S., Roorda, M. J., and Abdulhai, B. (2009). Safety evaluation of truck lane restriction strategies using microsimulation modeling. Transp. Res. Rec. 2099 (1), 123–131. doi:10.3141/2099-14
Fontaine, M. D., Bhamidipati, C. S., and Dougald, L. E. (2009). Safety impact of truck lane restrictions on multilane freeways. Transp. Res. Rec. 2096 (1), 25–32. doi:10.3141/2096-04
Gan, A., and Jo, S. (2003). Operational performance models for freeway truck-lane restrictions. Florida: Lehman Center for Transportation Research.
Gao, Y. (2008). Calibration and comparison of the VISSIM and INTEGRATION microscopic traffic simulation models. Va. Tech. Available at: http://hdl.handle.net/10919/35005.
Gazis, D. C., and Herman, R. (1992). The moving and “phantom” bottlenecks. Transp. Sci. 26 (3), 223–229. doi:10.1287/trsc.26.3.223
Golob, T. F., Recker, W. W., and Alvarez, V. M. (2004). Safety aspects of freeway weaving sections. Transp. Res. Part A Policy Pract. 38 (1), 35–51. doi:10.1016/j.tra.2003.08.001
Han, Y., and Gao, G. (2010). “Relationship between highway transportation and economy development,” in Proceedings of the 2010 International Conference on Mechanic Automation and Control Engineering (MACE), Wuhan, China, July 2010. doi:10.1109/mace.2010.5535461
Ishak, S., Wolshon, B., Sun, X., Korkut, M., and Qi, Y. (2012). Evaluation of the traffic safety benefits of a lower speed limit and restriction of trucks to use of right lane only on I-10 over the Atchafalaya Basin. Baton Rouge, Louisiana: Louisiana Transportation Research Center.
Jiang, W., Li, P., Sha, A., Li, Y., Yuan, D., Xiao, J., et al. (2023). Research on pavement traffic load state perception based on the piezoelectric effect. IEEE Trans. Intelligent Transp. Syst. 24, 8264–8278. doi:10.1109/tits.2023.3264248
Jo, S., Gan, A., and Bonyani, G. (2003). “Impacts of truck-lane restrictions on freeway traffic operations,” in Proceedings of the 82nd annual meeting of the Transportation Research Board, janv), Washington, DC, January 2003.
Kerner, B. S., and Konhäuser, P. (1993). Cluster effect in initially homogeneous traffic flow. Phys. Rev. E 48 (4), R2335–R2338. doi:10.1103/physreve.48.r2335
Khurshid, A., Khan, K., and Cifuentes-Faura, J. (2023). 2030 Agenda of sustainable transport: can current progress lead towards carbon neutrality? Transp. Res. Part D Transp. Environ. 122, 103869. doi:10.1016/j.trd.2023.103869
Kononov, J., Bailey, B., and Allery, B. K. (2008). Relationships between safety and both congestion and number of lanes on urban freeways. Transp. Res. Rec. 2083 (1), 26–39. doi:10.3141/2083-04
Li, Z., Zhou, B., Teng, D., Yang, W., and Qiu, D. (2018). Comprehensive evaluation method of groundwater environment in a mining area based on fuzzy set theory. Geosystem Eng. 21 (2), 103–112. doi:10.1080/12269328.2017.1386594
Liu, Y., Huang, X., Duan, J., and Zhang, H. (2017). The assessment of traffic accident risk based on grey relational analysis and fuzzy comprehensive evaluation method. Nat. hazards 88, 1409–1422. doi:10.1007/s11069-017-2923-2
Liu, Y., Pan, B., Zhang, Z., Zhang, R., and Shao, Y. (2022). Evaluation of design method for highway adjacent tunnel and exit connection section length based on entropy method. Entropy 24 (12), 1794. doi:10.3390/e24121794
Moen, B., Fitts, J., Carter, D., and Ouyang, Y. (2000). A comparison of the VISSIM model to other widely used traffic simulation and analysis programs. Washington, DC: Institute of Transportation Engineers.
Pan, B., Ying, J., Luo, S., Shao, Y., Liu, S., Li, X., et al. (2021). Evaluation and analysis model of the length of added displaced left-turn lane based on entropy evaluation method. J. Adv. Transp. 2021, 1–22. doi:10.1155/2021/2688788
Patel, K., and Ruparathna, R. (2023). Life cycle sustainability assessment of road infrastructure: a building information modeling-(BIM) based approach. Int. J. Constr. Manag. 23 (11), 1837–1846. doi:10.1080/15623599.2021.2017113
Rrecaj, A. A., and Bombol, K. M. (2015). Calibration and validation of the VISSIM parameters-state of the art. TEM J. 4 (3).
Shaaban, K., and Kim, I. (2015). Comparison of SimTraffic and VISSIM microscopic traffic simulation tools in modeling roundabouts. Procedia Comput. Sci. 52, 43–50. doi:10.1016/j.procs.2015.05.016
Shi, M., Tian, X., Li, X., and Pan, B. (2023). The impact of parallel U-turns on urban intersection: evidence from Chinese cities. Sustainability 15 (19), 14356. doi:10.3390/su151914356
Singh, S., and Santhakumar, S. M. (2022). Platoon-based impact assessment of heavy-duty vehicles on traffic stream characteristics of highway lanes under mixed traffic environment. Int. J. Intelligent Transp. Syst. Res. 20, 29–45. doi:10.1007/s13177-021-00268-z
Stammer, R. E., and Shannon, K. (2010). I-40 trucking operations and safety analyses and strategic planning initiatives.
Sun, C., Dai, X., Luo, J., and Li, C. (2021). “Research on evaluation of construction organization plan of reconstruction and extension of expressway based on fuzzy comprehensive model,” in Proceedings of the 2021 4th International Symposium on Traffic Transportation and Civil Architecture (ISTTCA), Suzhou, China, November 2021 (IEEE), 307–311.
Tian, X., Shi, M., Shao, M., and Pan, B. (2023). Calculation method of deceleration lane length and slope based on reliability theory. Sustainability 15 (17), 13081. doi:10.3390/su151713081
Toledo, T., and Koutsopoulos, H. N. (2004). Statistical validation of traffic simulation models. Transp. Res. Rec. 1876 (1), 142–150. doi:10.3141/1876-15
Vaidya, O. S., and Kumar, S. (2006). Analytic hierarchy process: an overview of applications. Eur. J. operational Res. 169 (1), 1–29. doi:10.1016/j.ejor.2004.04.028
Verma, A. (2016). Review of studies on mixed traffic flow: perspective of developing economies. Transp. Dev. Econ. 2, 1–16. doi:10.1007/s40890-016-0010-0
Weibin, Z., Jianbei, L., Weiwei, L., and Yuanyuan, J. (2021). Study on the setting conditions of high density and small spacing compound interchange in stereo-compound expressway. J. Phys. Conf. Ser. 1972, 012069. doi:10.1088/1742-6596/1972/1/012069
Wu, X., and Hu, F. (2020). Analysis of ecological carrying capacity using a fuzzy comprehensive evaluation method. Ecol. Indic. 113, 106243. doi:10.1016/j.ecolind.2020.106243
Xiang, Y., Li, Z., Wang, W., Chen, J., Wang, H., and Li, Y. (2016). Evaluating the operational features of an unconventional dual-bay U-turn design for intersections. PLoS one 11 (7), e0158914. doi:10.1371/journal.pone.0158914
Yamamoto, S., Hieida, Y., and Tadaki, S.-i. (2006). Effects of bottlenecks on vehicle traffic. J. Phys. Soc. Jpn. 75 (11), 114601. doi:10.1143/jpsj.75.114601
Yuan, D., Jiang, W., Sha, A., Xiao, J., Wu, W., and Wang, T. (2023). Technology method and functional characteristics of road thermoelectric generator system based on Seebeck effect. Appl. Energy 331, 120459. doi:10.1016/j.apenergy.2022.120459
Zhao, H., Yao, L., Mei, G., Liu, T., and Ning, Y. (2017). A fuzzy comprehensive evaluation method based on AHP and entropy for a landslide susceptibility map. Entropy 19 (8), 396. doi:10.3390/e19080396
Zhao, J., Wu, Y., and Zhu, N. (2009). Check and evaluation system on heat metering and energy efficiency retrofit of existing residential buildings in northern heating areas of China based on multi-index comprehensive evaluation method. Energy Policy 37 (6), 2124–2130. doi:10.1016/j.enpol.2008.11.044
Keywords: ten-lane expressway, expressway entrance, design scheme, comprehensive evaluation, traffic suitability
Citation: Yang H, Liu Y, Pan B, Ren X, Zhang J and Yan H (2023) Understanding sustainability effectiveness on design strategy of ten-lane expressway merging areas based on entropy method. Front. Energy Res. 11:1323965. doi: 10.3389/fenrg.2023.1323965
Received: 18 October 2023; Accepted: 06 November 2023;
Published: 20 November 2023.
Edited by:
Meng Jia, Shandong University of Science and Technology, ChinaReviewed by:
Yang Shao, Xi’an University of Post and Telecommunications, ChinaXueao Li, Tongji University, China
Copyright © 2023 Yang, Liu, Pan, Ren, Zhang and Yan. This is an open-access article distributed under the terms of the Creative Commons Attribution License (CC BY). The use, distribution or reproduction in other forums is permitted, provided the original author(s) and the copyright owner(s) are credited and that the original publication in this journal is cited, in accordance with accepted academic practice. No use, distribution or reproduction is permitted which does not comply with these terms.
*Correspondence: Binghong Pan, cGFuYmhAY2hkLmVkdS5jbg==