 Yushuo Chen
 Lu Qu*
 Biao Zhao
 Qian Kang
- Department of Electrical Engineering, Tsinghua University, Beijing, China
High-voltage cascaded energy storage systems have become a major technical direction for the development of large-scale energy storage systems due to the advantages of large unit capacity, high overall efficiency, satisfactory economy, reliable safety, and easy access to grid dispatching. The loss characteristics analysis is the design basis of the water-cooling system of a high-voltage cascaded energy storage system, and its accurate calculation can determine the system’s safe and reliable operation of the system. This paper first introduces the four-quadrant operation principles of a cascaded H-bridge energy storage system, and analyzes the calculation method of the loss of the Integrated Gate-Commutated Thyristor based power module; On this basis, it studies the loss characteristics of the cascaded energy storage system and analyzes the influence of different modulation strategies and third harmonic injection on the loss characteristics of the energy storage system; Finally, this paper has completed the loss test for the engineering prototype module and compared the test results with theoretical calculation results to verify the accuracy of the loss calculation method of the high-voltage cascaded energy storage system.
1 Introduction
As is known to all, large-scale development of new energy sources is an inevitable path to achieve ‘emission peak’ and ‘carbon neutrality’ (Liu et al., 2020a; Li et al., 2021). However, it cannot be ignored that due to the characteristics of renewable energy such as intermittency, fluctuation and randomness, it is difficult to provide stable power after being connected to the grid, and problems such as poor grid stability and deteriorated power quality may also occur (He et al., 2022; Li et al., 2022).
With the maturity of new energy power generation and battery manufacturing, energy storage technology has emerged to provide solutions to problems such as deterioration of power quality and poor stability caused by large-scale new energy sources (Maharjan and InoueAkagi, 2008; Liu et al., 2020b). Among these solutions, high-voltage cascaded energy storage systems have recently attracted the attention of academic and industrial circles due to the strengths of large unit capacity, high overall efficiency, satisfactory economy, reliable safety and easy access to grid dispatching. Literature Chatzinikolaou and Rogers (2016) designed a battery balancing strategy for the H-bridge cascade conversion structure to eliminate the influence of battery internal resistance and transient electrochemical phenomena. Literature Ota et al. (2016) targets a modular cascaded multi-level battery energy storage system with a single star bridge unit component, effectively reducing the use of harmonic filters and AC side transformers. Literature Busarello et al. (2017) proposes a battery energy storage system with 8 H-bridge converter structures. This system can be connected to the distributed distribution network without the need for high-power transformers. Literature Jiang et al. (2018) proposes a hybrid energy storage system and control method, improving the front space vector control technology to achieve direct active power allocation and charge state balance of the capacitor. It can be seen that the current cascaded multi-level chain energy storage system mainly focuses on the optimized design of the cascade structure, energy storage AC and DC control technology, etc., and there is relatively little research on loss characteristics.
With the continuous development of power electronic devices, integrated gate commutated thyristors (IGCTs) have been widely used in large-capacity converter systems and other devices due to their high current-carrying capacity, low on-state loss and high reliability (Filsecker et al., 2013; Zeng et al., 2018). Meanwhile, with the continuous increase in the capacity of energy storage systems, the advantages of IGCTs’, such as large capacity and high reliability, make them quite suitable for the development of high-voltage cascaded energy storage converters with large capacity.
The increase in the capacity of energy storage systems has also led to a significant increase in power devices losses, and the system loss and heat dissipation of the systems play a critical role in the safe and reliable operation of energy storage systems (Zhao et al., 2015; Huang, 2017). Currently, there are a considerable number of studies on the loss of insulated gate bipolar thyristors (IGBTs). Literature (Xu et al., 2002; Rajapakse et al., 2005) established a switching loss model based on the relationship between IGBT transient voltage and current, and the calculation is complicated; Literature (Li et al., 2015) studied the calculation method of the loss of different three-level topology, which has a certain guiding significance; Literature (Luo et al., 2018) studied the calculation of the loss of different three-level modulation strategies, which optimizes the loss characteristics of the converters and the system efficiency. Given the fact that research on the loss characteristics of IGCTs is mostly limited to DC circuit breakers, var compensators, three-level converters, and modular multilevel converters (MMCs) (Meyer and Rufer, 2006; Li et al., 2007; Chen et al., 2016), literature (Guo et al., 2021) adopted the equivalent average method to evaluate the loss of MMCs based on IGCT devices; Literature (Wei et al., 2022a) considered the influence of voltage and current harmonic content on the calculation of loss under high voltage and high current, and analyzed the loss characteristics of high power neutral-point clamped three-level converters based on IGCTs; Literature (Wei et al., 2022b) studied the influence of different test operation conditions on the dynamic characteristic parameters of IGCTs, and presented a numerical model of IGCT loss considering device voltage, current, and temperature. However, since there is still less research on the loss characteristics of IGCTs in large capacity high-voltage cascaded energy storage systems, it is essential to calculate and analyze the loss of high-voltage cascaded energy storage systems based on IGCTs.
This paper is a research on the loss characteristics of high-voltage cascaded energy storage systems based on IGCTs, which first introduces the four quadrant operating principles of a energy storage system and analyzes the calculation method of the loss of the IGCT power device; On this basis, it studies the loss characteristics of the energy storage system and analyzes the influence of different modulation strategies and third harmonic injection on the loss characteristics of the energy storage system; Finally, this paper verifies the accuracy of the calculation method by comparing the numerical examples with the actual engineering data, so as to provide a theoretical reference for the subsequent different topologies of energy storage systems, the efficiency optimization of modulation strategies and the cooling system design.
2 The high-voltage cascaded energy storage system’s basic principles
The topology diagram of a cascaded energy storage system is shown in Figure 1 which presents a three-phase star arrangement. Each phase is cascaded by N power units, and each power unit consists mainly of an H-bridge circuit, a DC filter interface circuit, and a battery pack. The energy storage battery pack is connected in parallel at both ends of the DC capacitor of the H-bridge circuit through the filter interface circuit. By adjusting the amplitude and phase of the output voltage on the AC side of the bridge circuit, the active and reactive power exchange with the AC system can be realized.
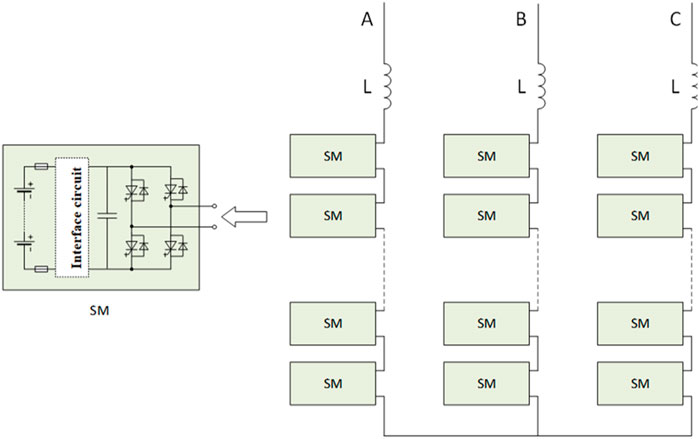
FIGURE 1. Topology diagram of the cascaded energy storage system (star configuration).
Figure 2 shows the four-quadrant operation diagram of the high-voltage cascaded energy storage system, where US is the grid-side voltage, UI is the valve-side voltage, and IL is the inductor current. The cascaded energy storage system which relies on its large number of modules rather than high switching frequency to achieve low harmonic voltage output, avoids the shortcoming of low switching frequency of IGCTs and can fully exploit the advantage of low on-state loss of IGCTs.
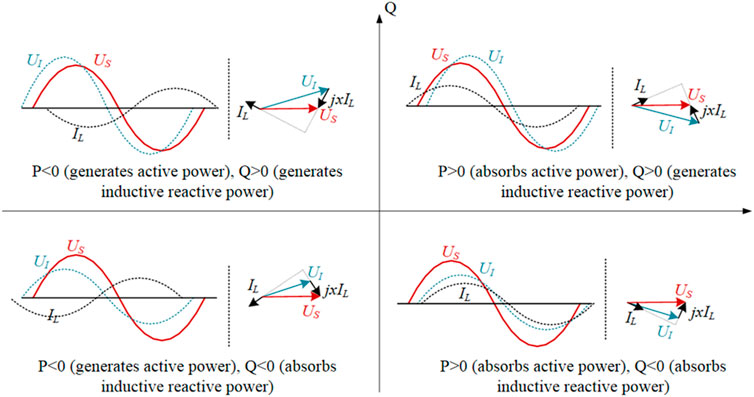
FIGURE 2. Four-quadrant operating diagram of the cascaded energy storage system.
3 Method of calculating the loss of the IGCT power unit
Unlike conventional voltage-controlled IGBT devices, the analysis and calculation process of the IGCT module’s loss is more complicated, this is because the switching process of IGCTs is similar to that of thyristors, whose switching rate cannot be controlled by the gate drive circuit. Therefore, the anode reactor must be connected in series in the conversion loop to limit the rate of current change when the device is switched on, and the RCD clamping circuit should be configured to absorb the inductor’s energy.
The circuit of the IGCT full-bridge module is shown in Figure 3, where CH is the DC-link capacitor and L is the anode inductance. The RCD clamping circuit includes clamping resistance R, clamping capacitance C, and clamping diode D. In the switching circuit part, four IGCT power modules form an H-bridge circuit, T1-T4 are IGCTs and D1-D4 are reverse parallel diodes, and the losses of the switching circuit mainly include on-state loss and switching loss.
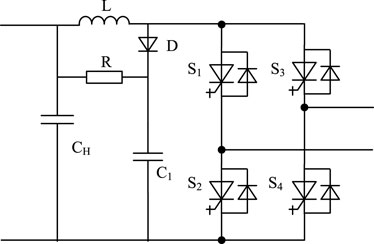
FIGURE 3. The IGCT full-bridge module circuit.
3.1 On-state loss
A single IGCT or a single reverse parallel diode is only responsible for the flow of positive half-wave (or negative half-wave) current, so the on-state loss of a single IGCT or a single reverse parallel diode is:
In the equation, uCE(t) and uF(t) are the voltage of both ends of the IGCT and reverse parallel diode, respectively, iC(t) is the current flowing through the IGCT and reverse parallel diode, and τ(t) is the duty ratio of the IGCT and reverse parallel diode in one period.
uCE(t) and iC(t) have a non-linear relationship with uF(t) and iC(t), and the typical curve is shown in Figure 4. The relationship between uCE(t), iC(t) and uF(t), iC(t) is approximated by a straight line as:
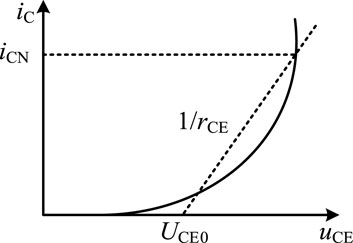
FIGURE 4. Typical curve diagram of uCE and iC.
In the equation, UCE0 and UF are the conduction threshold voltage of the IGCT and the reverse parallel diode, and rCE and rF are the slope resistance of the IGCT and the reverse parallel diode.
3.2 Switching loss
Setting the switching frequency of a single IGCT or a single reverse parallel diode to fsw, then a single IGCT or a single reverse parallel diode should be switched on and off fsw times within half a period. Thus, the switching loss of a single IGCT and a single reverse parallel diode is:
In the equation, EIGCT_sw(on) and EIGCT_sw(off) are the IGCT’s lost energy when switched on and off once, respectively, and EDiode_sw(on) (on) and EDiode_sw(off) are that of the reverse parallel diode.
In General, the energy lost when the IGCT or reverse parallel diode is switched on or off varies non-linearly with the current, which makes it difficult to describe the energy lost accurately and quantitatively with analytical expressions. To simplify the calculation, the energy lost by the IGCT or reverse parallel diode when switched each time is generally expressed as a function of the current and DC voltage flowing through the device, that is:
In the equation, a, b, and c are the polynomial coefficients of the energy and current consumed by each switching, which can be obtained directly from the device data sheet or fitted by the loss curve; UDC is the DC voltage endured by the device in actual operation; UTest is the DC voltage during the loss curve test.
Hence, the switching loss of the IGCT and reverse parallel diode can be expressed as:
4 Method of calculating the loss of the cascaded energy storage system
4.1 H-bridge conversion mode
The conversion method of the H-bridge topology is analyzed based on the circuit diagram of the IGCT full-bridge module shown in Figure 3. The switching status, output voltage uab and output current iab of the IGCT and reverse parallel diode in the H-bridge topology under different operating conditions are shown in Table 1. In Table 1, operating conditions one to eight correspond to Figure 5 (a)-5 (h).
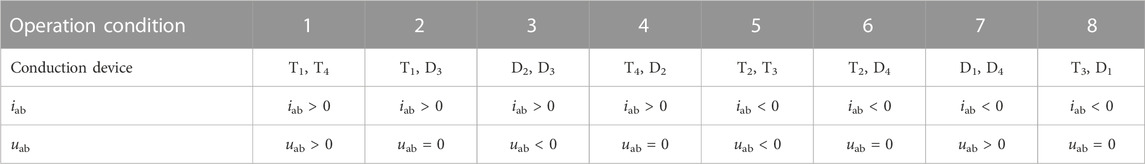
TABLE 1. The H-bridge topology’s switching status.
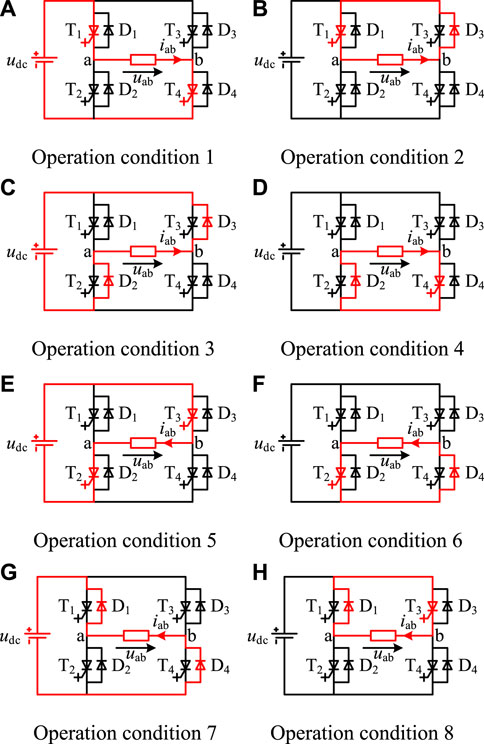
FIGURE 5. The H-bridge topology’s conversion method. (A) Operation condition 1 (B) Operation condition 2 (C) Operation condition 3 (D) Operation condition 4 (E) Operation condition 5 (F) Operation condition 6 (G) Operation condition 7 (H) Operation condition 8.
Figure 6 displays the phase relationship between the modulating wave and the load current when the converter is under inductive load, where φ represents the power factor angle. According to the zero crossing point of voltage and current, a fundamental wave period can be divided into four sections, then by analyzing the current path of each section, the conduction interval of each device can be obtained.
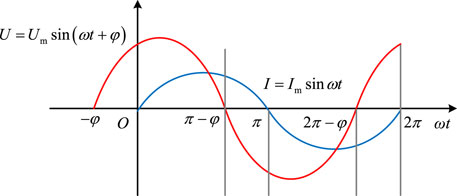
FIGURE 6. Phase relationship between the modulating wave and load current.
The duty ratio of the IGCT and reverse parallel diode in one period of the H-bridge is then analyzed according to different modulation strategies.
4.2 The conduction law of the H-Bridge’s topology with the unipolar modulation method
The schematic diagram of the unipolar modulation method is presented in Figure 7. In the first period, T1 and T2 are alternately conducted for half a period, and T3 and T4 operate at the carrier frequency; In the second period, T3 and T4 are alternately conducted for half a period, and T1 and T2 operate at the carrier frequency. The analysis is performed through taking the first period as an example.
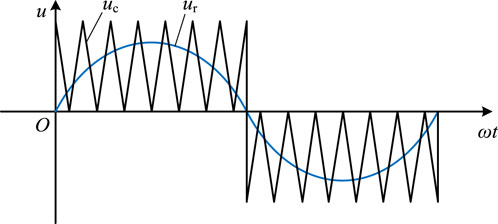
FIGURE 7. The schematic diagram of the unipolar modulation method.
When the H-bridge is operating at [0, π-φ], the modulation voltage is positive and the load current is positive. At this time, the output state of the H-bridge switches between u(t) > 0, i(t) > 0 and u(t) = 0, i(t) > 0. The current flow diagram is shown in Figure 5 (a) and (b). At this moment, there is a switching between T4 and D3, and T1 has been in the on state.
When the H-bridge is operating at [π-φ, π], the modulation voltage is negative and the load current is positive. At this time, the output state of the H-bridge switches between u(t) < 0, i(t) > 0 and u(t) = 0, i(t) > 0. The current flow diagram is shown in Figure 5 (c) and (d). At this moment, there is a switching between T4 and D3, and D2 has been in the on state.
When the H-bridge is operating at [π, 2π-φ], the modulation voltage is negative and the load current is negative. At this time, the output state of the H-bridge switches between u(t) < 0, i(t) < 0 and u(t) = 0, i(t) < 0. The current flow diagram is shown in Figure 5 (e) and (f). At this moment, there is a switching between T3 and D4, and T2 has been in the on state.
When the H-bridge is operating at [2π-φ, 2π], the modulation voltage is positive and the load current is negative. At this time, the output state of the H-bridge switches between u(t) > 0, i(t) < 0 and u(t) = 0, i(t) < 0. The current flow diagram is shown in Figure 5 (g) and (h). At this moment, there is a switching between T3 and D4, and D1 has been in the on state.
4.3 The conduction law of the H-Bridge’s topology with the bipolar modulation method
A schematic diagram of the bipolar modulation method is shown in Figure 8. When the H-bridge is operating at [0, π], the load current is positive and the modulation voltage is positive at [0, π-φ] and negative at [π-φ, π]. The output state of the H-bridge switches between u(t) > 0, i(t) > 0 and u(t) < 0, i(t) > 0. The current flow diagram is shown in Figure 5 (a) and (c). At this moment, T1, T4 and D2, D3 are alternately conducted; When the H-bridge is operating at [π, 2π], the load current is negative and the modulation voltage is negative at [π, 2π-φ] and negative at [2π-φ, 2π]. The output state of the H-bridge switches between u(t) > 0, i(t) < 0, and u(t) < 0, i(t) < 0. The current flow diagram is shown in Figure 6 (e) and (g). At this moment, T2, T3 and D1, D4 are alternately conducted.
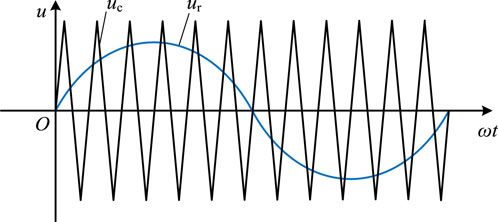
FIGURE 8. The schematic diagram of the bipolar modulation method.
4.4 The conduction law of the H-Bridge’s topology with the unipolar frequency multiplication modulation method
A schematic diagram of the unipolar frequency multiplication modulation method is shown in Figure 9. When the H-bridge is operating at [0, π-φ], the modulation voltage is positive and the load current is positive. At this time, the output state of the H-bridge switches between u(t) > 0,i(t) > 0 and u(t) = 0, i(t) > 0. The current flow diagram is shown in Figure 8 (a), (b), and (d). At this moment, T1 and D3, T1 and T4, T4 and D2 are alternately conducted.
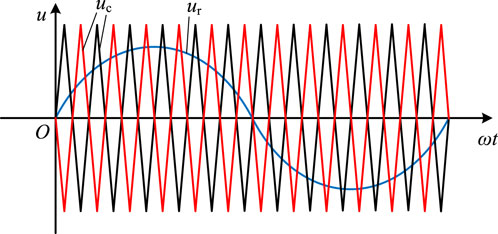
FIGURE 9. The schematic diagram of the unipolar frequency multiplication modulation method.
When the H-bridge is operating at [π-φ, π], the modulation voltage is negative and the load current is positive. At this time, the output state of the H-bridge switches between u(t) < 0, i(t) > 0 and u(t) = 0, i(t) > 0. The current flow diagram is shown in Figure 5 (b), (c), and (d). At this moment, T1 and D3, D2 and D3, T4 and D2 are alternately conducted.
When the H-bridge is operating at [π, 2π-φ], the modulation voltage is negative and the load current is negative. At this time, the output state of the H-bridge switches between u(t) < 0, i(t) < 0 and u(t) = 0, i(t) < 0. The current flow diagram is shown in Figure 5 (e), (f), and (h). At this moment, T3 and D1, T2 and T3, T2 and D4 are alternately conducted.
When the H-bridge is operating at [2π-φ, 2π], the modulation voltage is positive and the load current is negative. At this time, the output state of the H-bridge switches between u(t) > 0, i(t) < 0 and u(t) = 0, i(t) < 0. The current flow diagram is shown in Figure 5 (f), (g), and (h). At this moment, T3 and D1, D1 and D4, T2 and D4 are alternately conducted.
4.5 Calculation of on-state loss of the H-Bridge power unit
After analyzing the conduction law of the H-bridge’s topology with different modulation methods, the duty ratio of different devices can be calculated separately using different modulation strategies. The calculation is performed with T1using the bipolar modulation method as an example.
Figure 10 is the schematic diagram of the bipolar modulation method, and only one carrier period is drawn in the figure. The equations of carrier line 1 and 2 can be obtained from Figure 10:
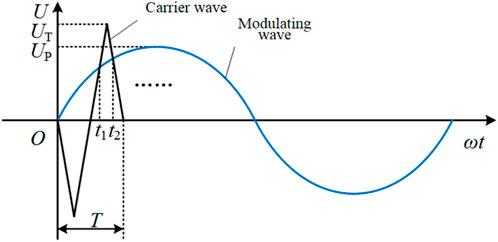
FIGURE 10. The schematic diagram of a carrier period with the bipolar modulation method.
In the equation, T is the carrier period, and UT is the carrier amplitude.
At t1 and t2, it satisfies the equations shown in equation (11):
The duty ratio can be derived from equation (11), see equation (12):
Using the above calculation method, the duty ratio corresponding to the conduction angle of each switching device in the H-bridge circuit can be obtained when applying different modulation strategies. It can be noticed that the duty ratios of the conduction angle corresponding to the bipolar modulation method and the unipolar frequency multiplication modulation method in one period are the same. After averaging with the unipolar modulation method in two periods, the duty ratio of the corresponding conduction angle is the same as that of the bipolar modulation method and unipolar frequency multiplication modulation method. Accordingly, although the conduction states are different when the H-bridge circuit adopts different modulation strategies, the duty ratios corresponding to the conduction angle of each switching device remain the same, as can be seen in Table 2.
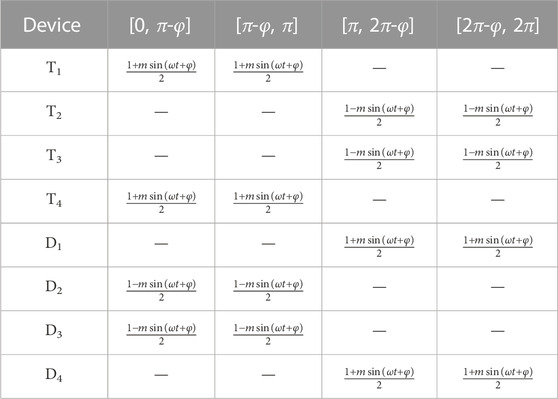
TABLE 2. The duty ratio of the conduction angle corresponding to each device in the H-bridge power unit.
When the power device is in the on-state and there is current flowing through, loss will be generated. In this way, by using the above-mentioned calculation method of the power device’s loss and the calculation of the duty ratio under different modulation methods, the average on-state loss of the switch transistor in one period can be calculated.
By substituting the duty ratio and equations (3) and (4) in Table 1 into equations (1) and (2), after integration, the on-state loss of the IGCT and reverse parallel diode of the H-bridge power device can be obtained and shown as follows:
Therefore, the H-bridge power unit’s on-state loss is:
4.6 Calculation of switching loss of the H-Bridge power unit
According to the analysis of the H-bridge’s conversion mode, it can be found that when the H-bridge modulation strategy is unipolar modulation, T1, T2, D1, and D2 are switched on and off once, and other switch transistors are switched on and off with a switching frequency of fsw; While when the H-bridge operates with the bipolar modulation method and unipolar frequency multiplication modulation method, all switch transistors of the H-bridge are switched on and off with a switching frequency of fsw. Thus, with the unipolar modulation method, the H-bridge’s switching loss is lower. However, under the same carrier frequency, there is higher equivalent output frequency of the unipolar frequency multiplication modulation method and better harmonic performance, so this modulation method is commonly used in engineering. The switching loss of the H-bridge power unit under bipolar modulation and unipolar frequency multiplication modulation is obtained by refering to the calculation method for the switching loss of the IGCT and reverse parallel diode in Section 2:
The H-bridge power unit’s total loss can be expressed as:
4.7 Influence of third harmonic injection modulation on the H-Bridge power unit loss
Considering that the use of sinusoidal signal for the modulating wave will cause the DC voltage utilization rate to decrease, in actual engineering, when the common star arrangement is used on the load side, the third harmonic injection method is usually adopted to improve the defects of low DC voltage utilization (Zhao et al., 2019; Bieber et al., 2023).
The third harmonic injection strategy is to superimpose a sinusoidal wave of three times the frequency on the modulation fundamental wave, and the synthesized modulating waveform is a saddle wave, as shown in Figure 11. After applying third harmonic injection into the sinusoidal modulation signal, the modulation voltage function can be expressed as:
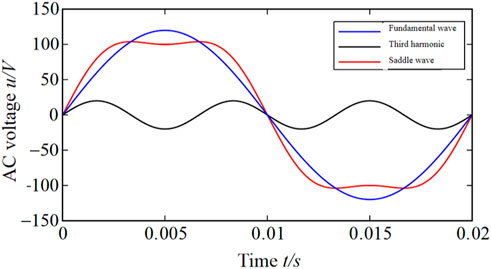
FIGURE 11. Modulating waveform before and after the third harmonic injection.
In the equation, k is the injection amount of the third harmonic, and it is the ratio of the amplitude of the injected third harmonic to the amplitude of the fundamental wave.
According to the superposition theorem, the saddle wave can be devided into the fundamental sinusoidal modulating signal and the third harmonic modulating signal, and then the calculation of loss is performed separately. In this way, the calculation equation of loss after injecting the third harmonic can be obtained. Since the calculation method is the same as the above method, the calculation expression is presented directly in this section without further elaboration. After the third harmonic injection, the on-state loss of the IGCT and the reverse parallel diode of the H-bridge power unit can be expressed as follows:
The switching losses of the IGCT and reverse parallel diode remain unchanged, see equations (8) and (9). Therefore, the total loss of the H-bridge unit after the third harmonic injection is:
From the above analysis, it can be learned that the loss of the power semiconductor unit is not only related to factors such as IGCT parameters, reverse parallel diode parameters, and modulation ratio m, but also related to the third harmonic injection amount k.
5 Numerical example analysis and experiment verification
5.1 Numerical example analysis
From the analysis in Sections 2 and 3, it can be seen that in addition to the characteristic parameters of the IGCT and the reverse parallel diode, the factors that affect the loss of the H-bridge include the modulation ratio m, the third harmonic injection amount k, the power factor φ, the current amplitude Im, and the DC voltage UDC. In order to accurately evaluate the loss characteristics of the power module of the cascaded energy storage system and optimize the design, the loss calculation method needs to be evaluated and verified.
This paper takes the H-bridge that is studied as the analysis object, t Power-SC7. CAC5000-45 Plus is taken as the IGCT module and FYB 2000-45-02 as the reverse parallel diode module based on actual engineering project needs. The input variables of loss calculation in accordance with the device data sheet (the device parameters are extracted with reference to a junction temperature of 125°C) and engineering system parameters are shown in Table 3.
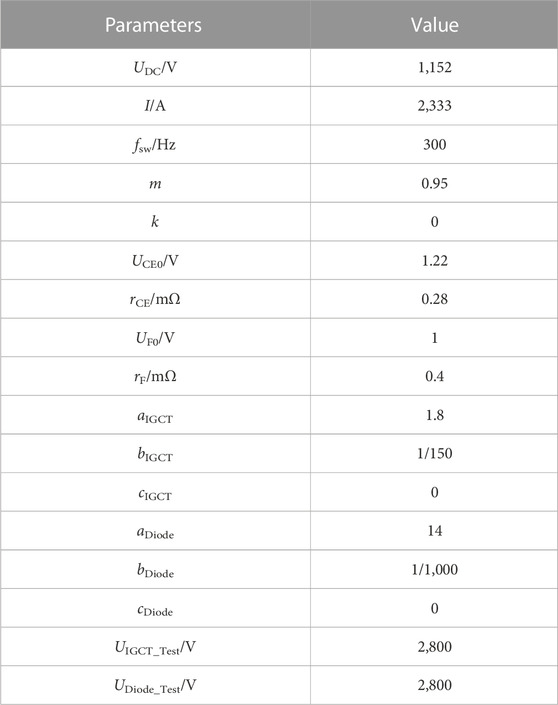
TABLE 3. Device characteristic parameters and system parameters.
Through the parameters in Table 3 and equations (8) and (9), (13) and (14), the on-state loss and switching loss of the IGCT and reverse parallel diode can be calculated separately:
Therefore, the H-bridge power unit’s total loss is:
5.2 Experiment verification
The basic circuit diagram of the experimental platform, shown in Figure 12A, is set up to verify the effectiveness of the loss calculation method in this paper. Module 1 is connected to a DC power supply, and module 2 is the tested module. Module 1 and module 2 are connected by a reactor, and the voltage on the DC side and the current on the AC side of module 2 are adjusted by the control chassis to achieve full load operation between the modules. Module 1 and Module 2 are water cooled. The test modules will generate losses when running, and the measured temperature of the water-cooling system changes with the changes in losses. The loss of the IGCT module can be measured indirectly by measuring the temperature changes in the water-cooling system. The physical image of the prototype is shown in Figure 12 (b), and the loss of the sample module is calculated using the experimental calorimetry method. The experimental results are shown in Table 4.
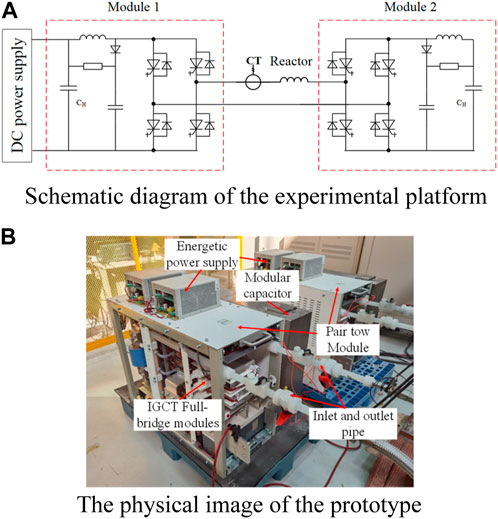
FIGURE 12. The schematic of the experimental platform and the physical image of the prototype. (A) Schematic diagram of the experimental platform (B) The physical image of the prototype.
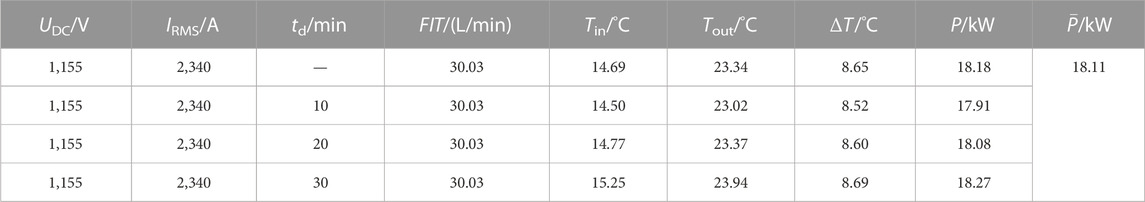
TABLE 4. Loss test results.
The measured waveform is shown in Figure 13. In the figure, u1 and u2 represent the output voltages of module 1 and module 2, iL represents the inductor current, and uc represents the voltage at both ends of the DC-link capacitor CH.
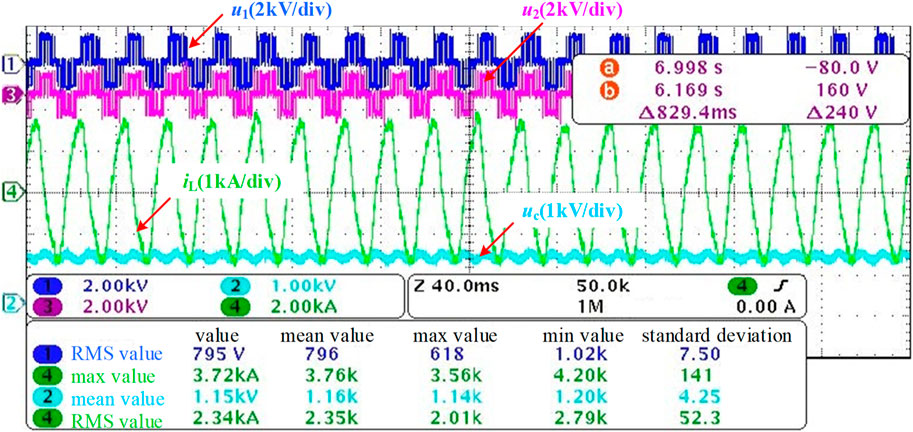
FIGURE 13. Measured waveform diagram.
The measured loss is determined by the following equation:
In the equation, P, kW, is the loss of a single power module; Cp, 4.2 kJ/(kg·°C), is the specific heat capacity of water; FIT, m3/s, is the flow rate of water; ρ, 1,000 kg/m3, is the density of water;
In the calculation example, the loss of a single H-bridge power module is 16.24 kW. However, in the actual loss test, the test module must also take into account the effects of the anode inductance, the RCD clamp circuit and the discharge resistor in the water cooling system. Using the actual engineering parameters, the discrete loss Ps of the anode inductor, RCD clamp circuit and discharge resistor can be determined to be 2.1 kW. Therefore, the loss of an IGCT full-bridge module is 18.34kW, which is consistent with the measured average loss of 18.11 kW shown in Table 4.
6 Conclusion
In this paper, by conducting research on the loss characteristics of high-voltage cascaded energy storage systems based on IGCTs, the following conclusions have been drawn:
(1) By studying the duty ratio after adopting different modulation strategies, the calculation equation for the on-state loss of the IGCT power module under different modulation strategies is obtained. The results show that the on-state loss of the IGCT power module is not highly correlated to the modulation strategy, but is related to factors such as IGCT parameters, reverse parallel diode parameters, and modulation ratio m; The switching loss of the IGCT can be fitted by the equation of the characteristic parameters of the device, and the switching loss is smaller in the unipolar modulation mode. Yet, at the same carrier frequency, the equivalent output frequency of the unipolar frequency multiplication modulation method is higher and the harmonic performance is better. Therefore, the unipolar frequency multiplication modulation method is generally adopted in engineering.
(2) The third harmonic injection method can effectively improve the utilization rate of the voltage on the DC side. Meanwhile, the third harmonic injection amount k will also affect the on-state loss of the power device without affecting the switching loss.
(3) Based on numerical example analysis and engineering measured data, it can be known that the power loss in the theoretical calculation is 18.34 kW, and the measured average loss is 18.11 kW, presenting basically consistent results, which can provide a certain reference value for the subsequent design of the full-bridge module of the high-voltage cascaded energy storage system.
Data availability statement
The original contributions presented in the study are included in the article/Supplementary Material, further inquiries can be directed to the corresponding author.
Author contributions
YC: Investigation, Writing–original draft. LQ: Conceptualization, Writing–review and editing. ZY: Funding acquisition, Writing–review and editing. BZ: Supervision, Writing–review and editing. QK: Validation, Writing–original draft. KC: Data curation, Validation, Writing–review and editing. RZ: Supervision, Writing–review and editing.
Funding
The author(s) declare financial support was received for the research, authorship, and/or publication of this article. The authors declare that financial support was received for the research, authorship, and/or publication of this article. This work was supported by the Inner Mongolia Autonomous Region “Listed and Commanded” Project (grant no. 2023JBGS0013).
Conflict of interest
The authors declare that the research was conducted in the absence of any commercial or financial relationships that could be construed as a potential conflict of interest.
Publisher’s note
All claims expressed in this article are solely those of the authors and do not necessarily represent those of their affiliated organizations, or those of the publisher, the editors and the reviewers. Any product that may be evaluated in this article, or claim that may be made by its manufacturer, is not guaranteed or endorsed by the publisher.
References
Bieber, L. M., Pfannschmidt, J. A., Wang, L., Jatskevich, J., and Li, W. (2023). A hybrid five-level modular multilevel converter with high efficiency and small energy storage requirements for HVDC transmission. IEEE Trans. Industrial Electron. 70 (2), 1597–1608. doi:10.1109/tie.2022.3158006
Busarello, T. D. C., Mortezaei, A., Bubshait, A. S., and Simoes, M. G. (2017). Three-phase battery storage system with transformerless cascaded multilevel inverter for distribution grid applications. IET Renew. Power Gener. 11 (6), 742–749. doi:10.1049/iet-rpg.2016.0629
Chatzinikolaou, E., and Rogers, D. J. (2016). Cell SoC balancing using a cascaded full-bridge multilevel converter in battery energy storage systems. IEEE Trans. Industrial Electron. 63 (9), 5394–5402. doi:10.1109/tie.2016.2565463
Chen, Z. Y., Yu, Z. Q., Lv, G., Huang, Y. L., Zeng, R., Chen, M., et al. (2016). Research on 10 kV DC hybrid circuit breakers based on IGCT series connection. Proc. CSEE 36 (2), 317–326.
Filsecker, F., Alvarez, R., and Bernet, S. (2013). Comparison of 4.5-kV press-pack IGBTs and IGCTs for medium-voltage converters. IEEE Trans. Industrial Electron. 60 (2), 440–449. doi:10.1109/tie.2012.2187417
Guo, M. Z., Bai, R. H., Tang, B. J., Zhao, B., Zhou, X. D., Yu, Z. Q., et al. (2021). Analysis and calculation of loss characteristics of IGCT-MMC based on equivalent average. South. Power Syst. Technol. 15 (03), 8–14.
He, P., Li, Z., Li, C. S., Fang, Q. Y., and Zheng, M. M. (2022). Modeling of energy storage electromechanical transient characteristics based on virtual synchronous machine technology. Power Syst. Prot. Control 50 (07), 11–22.
Huang, A. Q. (2017). Power semiconductor devices for smart grid and renewable energy systems. Proc. IEEE 105 (11), 2019–2047. doi:10.1109/jproc.2017.2687701
Jiang, W., Xue, S., Zhang, L., Xu, W., Yu, K., Chen, W., et al. (2018). Flexible power distribution control in an asymmetrical-cascaded-multilevel-converter-based hybrid energy storage system. IEEE Trans. Industrial Electron. 65 (8), 6150–6159. doi:10.1109/tie.2017.2787557
Li, G. D., Mao, C. X., Lu, J. M., and Cui, Y. Y. (2007). Research on the DC link of three-level high-voltage inverters based on IGCT series connection. Proc. CSEE 27 (1), 82–87.
Li, J. H., Zhang, J. H., Li, C. P., Chen, G. H., and Zhang, H. T. (2021). The configuration plan and economic analysis of the energy storage system involved in peak regulation. Electr. Eng. Mag. 36 (19), 4148–4160. doi:10.19595/j.cnki.1000-6753.tces.200678
Li, J. Q., Wang, D., Fan, H., Yang, D. J., Fang, R. C., and Sang, Z. X. (2022). The hierarchical optimization and control method of active distribution network with mobile energy storage. Automation Electr. Power Syst. 46 (10), 189–198.
Li, X. S., Zhang, X. W., Chang, Y. F., and Cheng, Z. P. (2015). Research on the reliability of small wind power converters based on semiconductor power loss. Power Syst. Prot. Control 43 (19), 15–21.
Liu, C., Sun, T., Cai, G. W., Ge, C. W., Ge, Y. F., Yan, Y. H., et al. (2020). Analysis of the active support control and primary frequency modulation contribution of battery energy storage power stations based on the third-stage model of synchronous machines. Proc. CSEE 40 (15), 4854–4866.
Liu, C., Zhuo, J. K., Zhao, D. M., Li, S. Q., Chen, J. S., Wang, J. X., et al. (2020). Research review of the application of energy storage systems to achieve the flexible and safe operation of renewable energy microgrids. Proc. CSEE 40 (1), 1–18.
Luo, R., He, Y. J., Chen, H., and Liu, J. J. (2018). SVPWM strategy for neutral-point balancing and low switching loss of three-level converters. Electr. Eng. Mag. 33 (14), 3245–3254.
Maharjan, L., Inoue, S., and Akagi, H. (2008). A transformerless energy storage system based on a cascade multilevel PWM converter with star configuration. IEEE Trans. Industry Appl. 44 (5), 1621–1630. doi:10.1109/tia.2008.2002180
Meyer, J. M., and Rufer, A. (2006). A DC hybrid circuit breaker with ultra-fast contact opening and integrated gate-commutated thyristors (IGCTs). IEEE Trans. Power Deliv. 21 (2), 646–651. doi:10.1109/tpwrd.2006.870981
Ota, J. I. Y., Sato, T., and Akagi, H. (2016). Enhancement of performance, availability, and flexibility of a battery energy storage system based on a modular multilevel cascaded converter (MMCC-SSBC). IEEE Trans. Power Electron. 31 (4), 2791–2799. doi:10.1109/tpel.2015.2450757
Rajapakse, A. D., Gole, A. M., and Wilson, P. L. (2005). Electromagnetic transients simulation models for accurate representation of switching losses and thermal performance in power electronic systems. IEEE Trans. Power Deliv. 20 (1), 319–327.
Wei, W., Ge, Q. X., Li, Y. H., Zhao, L., and Zhang, B. (2022). Analysis of loss characteristics of high-power three-level neutral-point clamped converters. Micromotors 55 (07), 37–44.
Wei, W., Ge, Q. X., Li, Y. H., Zhao, L., and Zhang, B. (2022). Loss model of IGCT devices of high-power traction converters. Electr. Drive 52 (19), 11–18.
Xu, D., Lu, H., Huang, L., Azuma, S., Kimata, M., and Uchida, R. (2002). Power loss and junction temperature analysis of power semiconductor devices. IEEE Trans. Industry Appl. 38 (5), 1426–1431. doi:10.1109/tia.2002.802995
Zeng, R., Zhao, B., Yu, Z. Q., Song, Q., Huang, Y. L., Chen, Z. Y., et al. (2018). Application prospects for IGCTs in DC grids. Proc. CSEE 38 (15), 4307–4317.
Zhao, C., Hu, Y., Luan, K., Xu, F., Li, Z., Wang, P., et al. (2019). Energy storage requirements optimization of full-bridge MMC with third-order harmonic voltage injection. IEEE Trans. Power Electron. 34 (12), 11661–11678. doi:10.1109/tpel.2019.2906349
Keywords: high-voltage cascade H-bridge, direct-mounted, energy storage system, IGCT, loss characteristics
Citation: Chen Y, Qu L, Yu Z, Zhao B, Kang Q, Cui K and Zeng R (2023) Research on the loss characteristics of high-voltage cascaded energy storage systems based on IGCTs. Front. Energy Res. 11:1308750. doi: 10.3389/fenrg.2023.1308750
Received: 07 October 2023; Accepted: 26 October 2023;
Published: 15 November 2023.
Edited by:
Muhammad Zeeshan Malik, Taizhou University, ChinaReviewed by:
Liansong Xiong, Xi’an Jiaotong University, ChinaQinglei Bu, Xi’an Jiaotong-Liverpool University, China
Copyright © 2023 Chen, Qu, Yu, Zhao, Kang, Cui and Zeng. This is an open-access article distributed under the terms of the Creative Commons Attribution License (CC BY). The use, distribution or reproduction in other forums is permitted, provided the original author(s) and the copyright owner(s) are credited and that the original publication in this journal is cited, in accordance with accepted academic practice. No use, distribution or reproduction is permitted which does not comply with these terms.
*Correspondence: Lu Qu, cXVsdUB0c2luZ2h1YS5lZHUuY24=