 Caijuan Qi1
 Zhilei Hua
94% of researchers rate our articles as excellent or good
Learn more about the work of our research integrity team to safeguard the quality of each article we publish.
Find out more
ORIGINAL RESEARCH article
Front. Energy Res. , 27 November 2023
Sec. Sustainable Energy Systems
Volume 11 - 2023 | https://doi.org/10.3389/fenrg.2023.1305885
This article is part of the Research Topic Modeling Practice and Mechanism Design of Green Energy Systems towards Sustainable Development View all 18 articles
China’s commitment to decarbonization has become a foundational principle guiding policymaking at national, provincial, and local levels across diverse sectors. This commitment is especially evident in the active promotion of low-carbon energy transitions by all provinces, aligning with the national goal of carbon neutrality. This paper focuses on Ningxia Province and constructs five scenarios for low-carbon energy transition, adopting the multi-level perspective. These scenarios include the business-as-usual scenario (BAU), high electrification scenario (HES), high outward electricity scenario (HOS), low carbon scenario (LCS), and energy saving scenario (ESS). Utilizing the LEAP-Ningxia model, we simulate energy demand across various sectors until 2060. The quantitative analysis covers primary energy production, secondary energy conversion, final energy consumption, and CO2 emissions. Notably, under scenarios incorporating carbon capture and storage (CCS) and carbon credits, the total CO2 emissions in Ningxia are projected to decrease to 17∼23 Mt CO2 until 2060 under BAU, HES, and HOS. In LCS and ESS, a remarkable achievement is forecasted with 6∼93 Mt CO2 of negative emissions from the energy sector in Ningxia until 2060. The findings underscore the importance of diverse CO2 reduction measures and their impacts on achieving a zero-carbon energy transition in Ningxia. The implications of scenarios with CCS and carbon credits showcase significant reductions in CO2 emissions, aligning with China’s broader decarbonization goals. The results provide valuable scientific support and insights for policymakers and stakeholders involved in steering Ningxia towards a sustainable and low-carbon future.
1) Achieving a zero-carbon energy transition in Ningxia requires coupling and balancing multiple sectors and energy sources.
2) The zero-carbon energy transition in Ningxia Province requires the integration and cooperation of a series of factors, including technology, economy, policies and social regime.
3) If carbon capture and storage and carbon credits are ignored, Ningxia can realize carbon peaking by 2030, but cannot realize the carbon neutrality goal by 2060.
In September 2020, Chinese President Xi Jinping declared China’s commitment to achieve carbon neutrality before 2060 in the United Nations General Assembly (Zhao, 2022). He then further announced China’s intention to submit its updated Intended Nationally Determined Contributions (NDC) soon. In October 2021, the leadership group of CPC Central Committee launched the “1 + N” climate policy system for carbon peak and carbon neutrality. This initiative began with one top-level guideline document and several additional core documents, each outlining detailed measures for achieving sector-specific decarbonization (Wu, 2023). The Central Government has proposed that regions, sectors and enterprises equipped with the conditions should proactively lead efforts. Both sectors and local governments are encouraged to formulate plans for carbon peak and carbon reduction (Qi et al., 2023).
Global efforts to address climate change have undergone significant transformations. China’s commitment to carbon neutrality goal signifies a long-term economic vision centered around decarbonization. In the post-COVID era, numerous countries have turned to the green stimulus packages. The global green recovery initiative has prioritized the development of renewable energy, clean transportation, green buildings, low-carbon technologies, etc., aiming to stimulate economy recovery and CO2 emission reduction simultaneously. China has developed policies such as “dual-carbon” goals, the national 14th Five-Year Plan and the provincial carbon peaking action plan, signaling the acceleration of the inclusive low-carbon transition in Ningxia.
Ningxia, as China’s first national-level comprehensive new energy demonstration zone, enjoys the unique advantage of abundant wind and solar resources within a small land area, coupled with reliable power grid and stable transmission infrastructure. Moreover, Ningxia’s energy consumption used to rely on coal resources heavily, posing a challenge to sustainable practices and the low-carbon energy transition (Gan et al., 2021). In 2021, coal resources constituted over 85% of Ningxia’s energy consumption (compared to the national level of 57%), and the GDP per unit of energy consumption was four times higher than the national average. To achieve the “dual-carbon” goal, Ningxia Province must expedite the development of a new energy-dominated system which is clean, low-carbon, safe and efficient. This involves not only controlling total energy consumption but also decoupling energy CO2 emissions from economic growth, ensuring a continuous decline in both GDP per unit of energy consumption and carbon emissions. Shifting towards cleaner and renewable energy sources is instrumental in securing the sustainability of Ningxia’s economy. This transition not only bolsters local energy security but also has the potential to attract additional investments, fostering job creation. Conversely, an excessive dependence on conventional energy sources may result in environmental pollution and resource exhaustion. Energy transition plays a pivotal role in ameliorating Ningxia’s environmental quality and mitigating adverse impacts on the ecosystem. Through the modeling of the zero-carbon energy system transition path and the mechanism design of CO2 reduction measures, practical guidance can be provided to promote the development of green energy systems towards sustainable growth in Ningxia Province.
The paper is organized as follows. Section 2 reviews the perspectives and models of the energy transition in the literature. Section 3 describes the methodology we use to analyze the low-carbon energy transition in Ningxia Province. Section 4 describes the data and scenario setting. Section 5 presents the results, and Section 6 concludes.
To achieve the goal of carbon neutrality, in recent years, the process of the low-carbon energy transition has been accelerated both in China and abroad (Tian et al., 2022). Globally, numerous countries are advocating for a transition from fossil fuel-dominated energy system to those dominated by non-fossil fuels. Various measures have been adopted to incentivize a gradual shift from coal, oil, natural gas to renewable sources such as wind, solar and hydro. (Wang et al., 2016). Achieving a feasible and economically viable energy transition characterized by a high proportion of renewables involves shifting primary energy consumption to an energy system dominated by renewable energy. This requires coordinated efforts across various energy sectors, including electricity, heating, transportation and industrial sectors (Hansen et al., 2019). Consequently, various countries and regions have implemented pertinent energy transition strategies. The European Commission has put forward a series of policy initiatives in the European Green Deal, aiming to achieve climate neutrality in Europe by 2050 (Kougias et al., 2021). Germany has stated it would shift from fossil fuels and older technologies to the new fuels and technologies, and would gradually phase out nuclear and coal power stations (Bartholdsen et al., 2019). The United Kingdom has passed legislation with the aim of reducing greenhouse gas emissions to net zero by 2050 (Yang et al., 2022). Meanwhile, various local governments are practicing local low-carbon energy initiatives by regulation adjustment and policy innovation, in alignment with the efforts to combat climate change and to avoid carbon lock-in (Warbroek and Hoppe, 2017).
Based on the imperative to mitigate the impact of climate change and the heightened significance of energy security and independence under geopolitical warfare (Sovacool et al., 2023), the world’s major economies are aware of the necessity of a rapid transition to a low- or zero-carbon energy system. China’s proposal of a “dual-carbon” goal is not only a national commitment, but also an urgent requirement for the transformation of its domestic economy. It has demonstrated the development concept of “lucid waters and lush mountains are invaluable assets”, indicating that China’s future economic and energy development must be restructured (Xu and Liu, 2019). Towards achieving the “dual-carbon” goal, China has to address long-term issues, including encouraging energy users to adopt renewable energy, establishing a new energy-dominated power system, and reducing emissions while guaranteeing the safe energy supply (Abbasi et al., 2022).
Low-carbon energy transition is a multifaceted and intricate process, encompassing various dimensions such as technology, market, policy, and environment (Geels et al., 2016). In terms of technology, recent years have witnessed the emergence of renewable energy, energy storage and electric vehicles as pivotal technologies (King and Van Den Bergh, 2018). Technological innovations have spurred investment in renewable energy. The continuous progress in renewable energy technologies (Kobo et al., 2016) has witnessed significant decreases of cost, as well as exponential growth in renewable energy power capacity (De La Peña et al., 2022). Market mechanism plays a crucial role in facilitating low-carbon energy transition. The design of electricity, carbon and green finance markets all contribute to shaping the trajectory of low-carbon energy transition. The electricity market and carbon market have accelerated the phase-out of fossil fuels and provided business-friendly conditions for renewable energy (Wainstein and Bumpus, 2016; Mo et al., 2021). Policy interventions are pivotal, and it is essential to provide financial support and opportunities for emerging low-carbon technologies (Tu et al., 2018). Green financial support and private capital are particularly influential in driving renewable energy deployment, especially in developing countries (Rogge and Johnstone, 2017; Anbumozhi et al.,. 2018). Environmental considerations are integral to the discourse on low-carbon energy transition. Attention has been directed towards developing CO2 emissions accounting tools and implementing measures for CO2 emissions reduction (Pichancourt et al., 2018).
The energy system is complicated, featuring in a huge number of branches, multiple energy categories and sectors, interaction among branches, and high correlation among society, economy and environment (Zou et al., 2023). Existing modeling techniques for energy system complexity include top-down energy model, bottom-up energy model and mixed-energy model from hierarchical perspective (Feng et al., 2023). Top-down models are usually based on economic models, with energy prices and economic elasticity as the main economic indicators (Ismail et al., 2023). Focusing on the energy consumption and energy production, top-down models are used for macroeconomic analysis and energy policy design. Examples include CGE, ARE, etc., but such models usually neglect the potential of technological advances (Rhodes et al., 2022). Bottom-up models are usually based on engineering models, which explain and simulate the technologies used in the process of energy consumption and energy production (Chatterjee et al., 2022), but require a large amount of data. Examples include LEAP, WEM, etc. Mixed energy models include both top-down models that consider macroeconomics and bottom-up models that consider energy supply and demand (Liu, 2023). Examples include GCAM, TIMES, etc. Given the model difficulty and data complexity, the mixed energy model is less compatible (Wilson and Swisher, 1993).
Most existing studies have modelled energy transition pathways from a techno-economic perspective, and then analyzed the potential CO2 emission reduction of key sectors (Wang et al., 2007; Lin and Xie, 2014; Zhou et al., 2018; Wu et al., 2020), pointing out that power and transportation are vital for CO2 emission reduction in the future (Huang et al., 2022). However, there is a lack of analysis regarding the contribution of feasible CO2 emissions reduction measures in microregions from the multi-level perspective. This paper provides an empirical analysis of the energy transition in Ningxia from the multi-level perspective, which is crucial for the region to determine effective strategies for the application of CO2 emission reduction measures. In this study, we introduce economic, environmental, and energy factors into the LEAP-Ningxia model, setting up five scenarios for the different feasible measures through the multi-level perspective. Subsequently, we simulate the zero-carbon energy transition pathways in Ningxia based on the scenarios, and analyze the contribution of CO2 emissions reduction drivers.
The multi-level perspective (MLP) is an important analytical framework in the theory of socio-technical system transformation (Geels, 2011). Schot and Kanger, (2018) explored the concept of “deep transitions” and how it extends MLP to understand transformative changes in societal systems. It is argued that the transformation is not a simple cause-and-effect relationship caused by a single factor or driving force (Markard and Truffer, 2008), but rather an evolutionary process formed by the interaction of three aspects: the policy landscape at the macro-level, the socio-technical paradigm at the meso-level, and the niche technology at the micro-level. It is an evolutionary process formed by the interaction of these three aspects. A framework for analyzing the regional energy transition from a multilevel perspective is given in terms of the synergistic effects of policy, socio-technical and techno-economic, as shown in Figure 1.
(1) Policy perspective refers to issues and policies related to energy, such as achieving national modernization, bolstering energy independence, or alleviating energy poverty (Cherp et al., 2018). In terms of policy, a facet of energy transition involves measures undertaken by the government to pursue the national interest. These measures aim to maintain internal order by achieving the supply-demand balance of energy, ensuring a reliable power supply, securing the independence on the external energy by minimizing energy imports or maximizing exports, and guaranteeing industrial competitiveness. Additionally, they contribute to increasing employment and achieving economic growth through energy development. Secondly, policymakers establish rules and institutional mechanisms that both support and constrain energy development. These mechanisms aim to aggregate the actions of market participants, facilitate the efficient allocation of energy resources, enhance international influence, and achieve carbon neutrality goal.
(2) Socio-technical perspective refers to information flows such as knowledge and practices related to energy extraction, conversion and utilization. A primary focus lies in the emergence and diffusion of new technologies, which usually first appear in the core countries, and then diffuse to other countries. Technology development follows an “S-curve”, delineating a cycle encompassing infancy, growth, maturity and decline (Grodal et al., 2023). Another focus is on assessing the established energy innovation system. For example, the expansion of newly introduced elements within the existing system may either foster innovation or clash with prevailing interests, hindering innovation, and leading to technology lock-in. However, typically, new elements have the potential to overcome technology lock-in, propelling new technologies toward maturity and competitiveness. This entails the development of energy systems with more flexible participants, rules and practices.
(3) Techno-economic perspective refers to the energy flows associated with the processes of energy exploitation, conversion, production, and consumption, primarily coordinated by the energy market. On the one hand, it focuses on the energy supply side, involving the exploitation of resources such as wind, solar, hydro, oil and natural gas. On the other hand, the focus is on the energy demand side, such as the electrification of transportation and building (Zhou et al., 2019). The techno-economic perspective necessitates achieving a balance between supply and demand through the intelligent information system. This means that any alteration in the supply or utilization of one particular type of resources must be counterbalanced by other types of resource with a matching amount of energy. For example, the expansion of renewable energy generation creates an increase in energy supply, necessitating a corresponding increase in electricity consumption demand, a gradual phase-out of fossil fuels, or an elevation in the outward electricity transmission to sustain the balance (Ma et al., 2023).
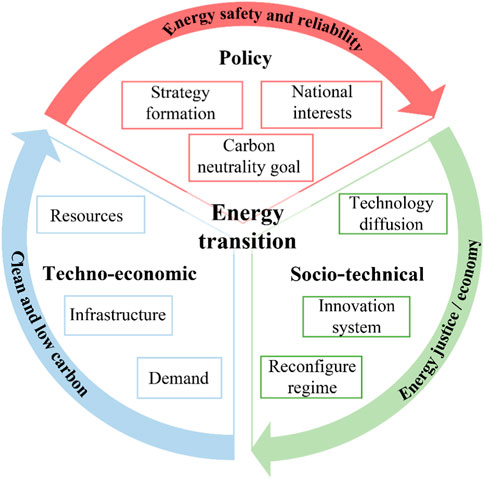
FIGURE 1. Three perspectives related to energy transition.
The new energy development landscape proposed by the government is giving pressure to the existing energy system. However, it also presents an opportunity for new technologies, propelling the transformation of the socio-technical system. Breakthrough innovations stemming from micro-technologies, coupled with continuous learning and efficiency improvements will garner growing intrinsic motivations and exert an impact on the existing socio-technical system. The system is undergoing gradual change, with resource development shifting towards decentralized and distributed. Customers are increasingly opting for more economical and environmental friendly energy choices, while energy technology and infrastructure are becoming more flexible and low-carbon. As shown in Figure 2, driven by the integration of policy, socio-technical and techno-economic factors, a new socio-technical regime is expected to be gradually established. This will facilitate the transition to the new energy-dominated system and contribute to the realization of national development goals.
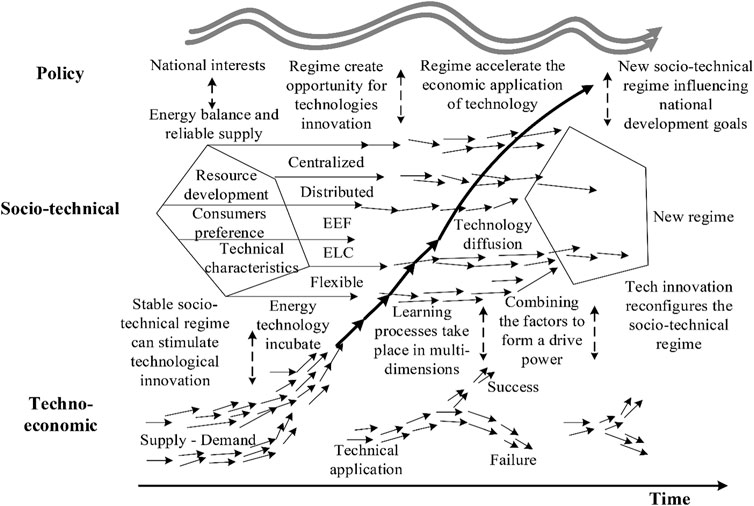
FIGURE 2. Analytical framework of energy transition from the multi-level perspective.
The LEAP (Low Emissions Analysis Platform) energy model is a system designed for mid- and long-term planning, encompassing energy, economy, and environmental considerations. It serves as a valuable tool for long-term energy alternatives planning, policy analysis and climate change mitigation assessment. It is a comprehensive “bottom-up” energy environment accounting tool based on scenario analysis, as shown in Figure 3. This method predicts the energy demand, supply and environmental impact of various sectors through mathematical models. Furthermore, the LEAP model offers comparative cost-benefit analyses under different scenarios, enhancing its utility in informed decision-making.
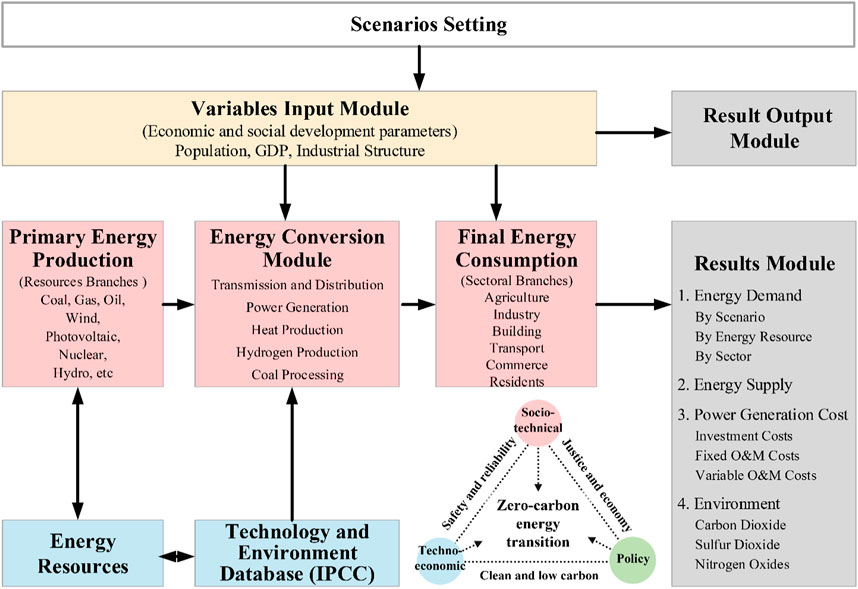
FIGURE 3. The LEAP-Ningxia model under the multi-level perspective.
In this paper, the LEAP-Ningxia model is based on the characteristics of energy supply and consumption in Ningxia Province. There are four core modules: socio-economic development, final energy demand, primary energy production and environmental emissions.
(1) Socio economic development module
The socio-economic development module captures the socio-economic factors influencing energy dynamics in Ningxia Province, including the industrialization and urbanization. It forecasts the population, economic value added and other major macro-economic indicators, mainly including population growth rate and the economic value added by sectors, which are the basic data for the next-step prediction.
Where,
Where,
Where
(2) Final energy demand module
The final energy demand module takes account of economic and social development, energy and technological progress, energy policies and other factors. It forecasts final energy demand by sectors and types of energy in the future. First, it predicts the final energy use intensity of per-GDP economic value added of different sectors and per capita household energy use intensity. Secondly, based on the results of economic value added of different sectors and
Where,
Where,
Where,
Considering the potential, utilization technology and economic benefits of different types of energy, this module predicts the proportion of energy consumption by sectors and by types of energy. Based on the final energy demand of different sectors, the module projects the final energy consumption of different sectors and different types of energy.
Where,
(3) Primary energy production module
The primary energy production module takes account of the balance between energy supply and demand, processing and conversion efficiency, factor endowments, etc., to forecast the sum of primary energy production by sectors and types of energy in the future.
The gradual shift of an energy system dominated by fossil fuels to one dominated by new energy means that the power sector will be the core of pursuing the carbon neutrality goal. Therefore, the energy balance focuses on plans and policies related to power and energy. The power supply structure is predicted through the balance of electricity and power, which is bas.ed on Eq. 8. Equations 9, 10, representing the constraints of electricity balance and power balance, respectively. Then, the power generated by each energy type is converted to the standard unit of energy according to the power conversion factor, thus calculating the primary energy consumption required for power generation.
Where,
Where,
Where,
Where,
Where,
Next, the paper calculates the total primary energy consumption including the primary energy consumption of power generation, intermediate conversion and final fossil fuel.
(4) Environmental emission module
LEAP-Ningxia model includes a tool with emission factors corresponding to various energy types to calculate the emissions of greenhouse gases and air pollutants. This paper uses IPCC reference value to calculate carbon dioxide emissions. Carbon dioxide emitted in the whole society is counted by the scope of energy activities, including direct carbon dioxide emissions from fossil fuel consumption in Ningxia Province and indirect emissions from power transmission.
Where
The population growth in Ningxia Province is decelerating and is projected to turn negative after 2030. Furthermore, the economic growth engine will shift from demographic dividend to talent dividend. Referring to the data from the seventh census and the historical population growth rate, China’s overall population growth has notably decelerated, and forecasts indicate a peak around 2030 (NDRC, 2017). The implementation of the new birth policies and other supportive measures related to education and taxation may alleviate the downward population trend in the future. Since 2021, the average annual population growth rate every 5 years of Ningxia will reach 0.3%, 0.1%, −0.1%, −0.1%, −0.2%, −0.3%, −0.3%, −0.3%. The total population in 2060 will fall back to the level of 2016 (refer to Figure 4), reaching 6.94 million. In 2020, population with tertiary education accounted for 20%–30% in Ningxia. With the spread and improvement of education, the quality of the population is expected to enhance further. Additionally, the working-age population will play a crucial role in providing support for innovation and human resources for industrial upgrading and economic development. As a result, it is anticipated to bring a counterbalance or potential surpass of the negative impact on economic development resulting from negative population growth.
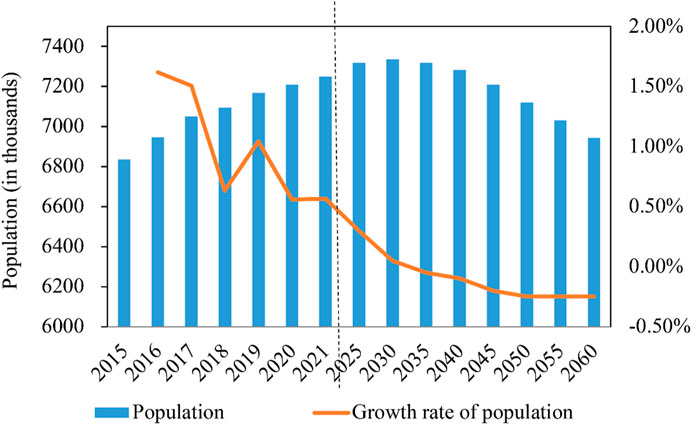
FIGURE 4. The population outlook in Ningxia.
The economic development of Ningxia has embraced two tasks: stock adjustment and growth optimization. Achieving this necessitates a shift in the driving force, aiming to restructure the modern industrial system and establish the economic growth as its foundation. As the quality of population improves in Ningxia, the momentum of economic growth in the future will shift from being resource-driven to being innovation-driven. Leveraging its advantages in energy resources and geography, Ningxia will efficiently develop and utilize clean energy. Additionally, there will be a strong emphasis on promoting industries with local features, such as tourism and organic food (Ningxia and NX, 2021; Ningxia and NX, 2022). The target is to double Ningxia’s GDP (gross domestic product) in 2035 and quadruple in 2060 compared to 2020. Since 2020, the projected average annual growth rate of GDP every 5 years will be 6.0%, 5.5%, 5%, 4.5%, 3.9%, 3.3%, 3.0% and 2.7%. Consequently, the GDP is expected to reach 2 trillion CNY by 2060.
The industrial structure plays a pivotal role in influencing environmental quality and CO2 emissions. With the development of economy and society, the industrial structure of Ningxia is expected to undergo further optimization. Examining the primary industry (agriculture, forestry, animal husbandry and fishery, below referred to as agriculture), since agriculture is the fundamental guarantee of food security, it is anticipated to maintain a share of around 5% by 2060. Considering the secondary industry (industry and buildings), the scale of the industrial sector generally correlates directly with CO2 emissions. The correlation between CO2 emissions and per capita GDP resembles an inverted U shape, which is similar to that between industrial sector and per capita GDP. Currently, the proportion of value added from industrial output in most developed countries ranges between 15% and 25%. Consequently, the proportion of Ningxia’s value added from industrial output is projected to reach 21% by 2060. The value added from building output of Ningxia is anticipated to be 5.5% by 2060. This projection is based on factors such as the declining total population, the deceleration of urbanization rates, and an aging population, all contributing to a reduced the demand for building sector. In terms of the tertiary industry, with the continuous growth of income, the demand for service-oriented products will rise, which will also increase the value added from the tertiary industry. The proportion of value added from commerce in Ningxia is targeted to be 61% by 2060. The proportion of value added from different sectors and the outlook of Ningxia are shown in Supplementary Table S2 and Figure 5.

FIGURE 5. The GDP outlook in Ningxia.
Considering the socio-economic indicators such as economic development objectives, industrial restructuring, population growth changes, and urbanization progress in Ningxia, this study sets two scenarios of final energy consumption (FEC), namely, the baseline scenario and energy saving scenario.
(1) In the baseline scenario, with reference to historical energy use intensity and taking account of utilization efficiency improvements, the proportion of the FEC by sectors at key time points is set in this paper. Since 2020, the average annual growth rate of total FEC every 5 years will be 4.5%, 2%, 0.5%, 0.2%, −1%, −2%, −3% and −3%, reaching a peak of 81.08Mtce by 2040, and declining to 51.4Mtce by 2060, reverting to the 2019 level, as shown in Supplementary Table S3.
(2) In the energy saving scenario, with the development of the socio-technical system, the terminal infrastructure will reduce energy use intensity through adopting energy-saving technologies. The energy conversion process will further improve the efficiency of energy conversion and utilization. Since 2020, the average annual growth rate of total FEC every 5 years will be 3.5%, 1.8%, 0.5%, −0.3%, −1.0%, −2.0%, −3.0% and −3.5%, peaking at 75.76Mtce in 2035, and 46.1Mtce in 2060, dropping back to the level in 2018, as detailed in Supplementary Table S4.
As urbanization and electrification accelerate and people’s living standards improve, the potential for substantial growth in per capita electricity consumption in Ningxia Province persists. Based on Ningxia’s economic development and benchmarked against electricity consumption in developed countries, the electricity demand in Ningxia is predicted, delineating two scenarios, namely, the general scenario and the electrification scenario.
(1) In the general scenario, with Ningxia persistently promoting electricity substitution and adapting conventional energy-using technologies on the demand side, the energy efficiency is anticipated to gradually plateau. Electrification across various energy-using sector is expected to increase steadily. The gas-fired power supply will increase, the development of coal-fired power will slow down, but the increase of new energy power generation will accelerate. It is estimated that public electricity consumption will reach 250 TWh, with the peak load reaching 40 GW in 2060, as detailed in Supplementary Table S5.
(2) In the electrification scenario, with improved people’s living standards in Ningxia, electricity substitution on the demand side sees a substantial increase. The widespread use of electrical equipment, such as electric heating, electric vehicles and smart home devices, contributes to a significant enhancement of societal electrification. On the supply side, power generation from conventional energy faces limited energy-efficiency improvement, while new energy substitution is expected to accelerate. The cost of new technologies is projected to decrease with more experience. The full potential of distributed energy will be harnessed, and the interconnection of electricity will be further enhanced. It is estimated that the public electricity consumption will reach 260 TWh, with the peak load reaching 42 GW in 2060, as detailed in Supplementary Table S6.
The main outward electricity transmission lines in Ningxia Province encompass Yindong DC (银东直流), Lingshao DC (灵绍直流), Zhaoyi DC (昭沂直流), and Ningxiang DC (宁湘直流). Ningxiang DC is expected to become operational around 2025 (BJX.Peoples Republic Of China, 2023).
Before 2025, the scale of outward electricity transmission from Ningxia will basically remain unchanged, at about 9.5 TWh. After 2025, with the completion of the Ningxiang DC (also named Tiandushan DC) project, the outward electricity transmission will be divided into the low scenario and high scenario, the annual outward electricity transmission will amount to 12 TWh under the low scenario, and 13 TWh under the high scenario, as detailed in Supplementary Tables S7, S8. The distribution of the outward electricity transmission line is set as follows: before 2030, the proportion of direct current transmission from thermal power in operation is 80%, and the proportion of transmission from newly constructed lines is 50%. After 2030, the proportion of all direct current transmission from thermal power will gradually decline.
Based on the multi-level perspective analysis framework, the transition to a zero-carbon energy system in Ningxia Province necessitates the integration of key elements, including technology, economics, policy and social system, as shown in Figure 6. From the perspective of policy, Ningxia Province needs to continuously ensure energy safety and reliable supply, continue to implement the national “West-East Power Transmission (WEPT)” project, and promote energy development to enhance industrial competitiveness, increase jobs and economic growth, and achieve carbon neutrality goal. From the socio-technical perspective, Ningxia needs to stimulate the diffusion of new energy technologies, shift the coal-based energy system to a new energy-based one, and get rid of “carbon lock-in”. From the techno-economic perspective, Ningxia needs to increase efficient infrastructure with clean energy on the supply side, encourage electricity substitution and accelerate electrification of final energy consumption on the demand side. Thus, through the interaction of the three perspectives of micro-level niche technology, meso-level socio-technical paradigm and macro-level policy landscape, Ningxia Province will become independent of coal consumption, realize the transition to a system dominated by new energy.
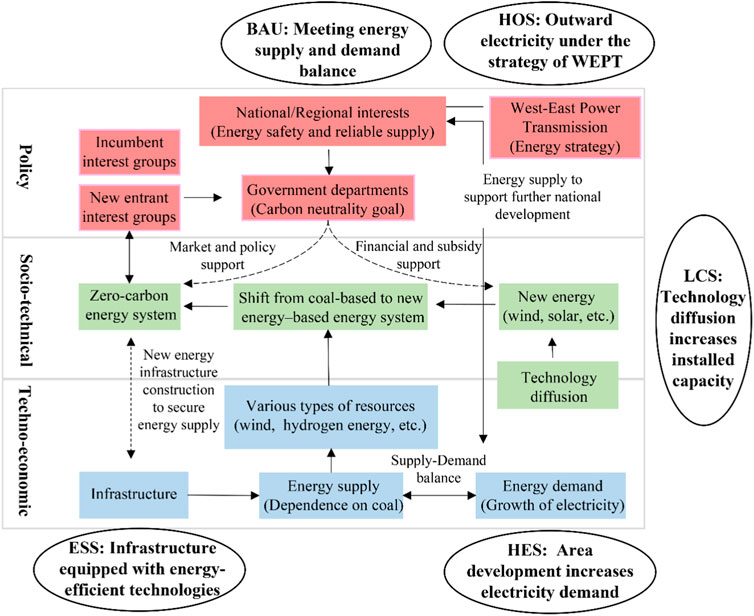
FIGURE 6. Scenario setting of energy transition in Ningxia from the multi-level perspective.
According to the differences of public electricity demand, outward electricity demand, energy, power capacity supply and final energy consumption, this paper sets up five scenarios (see Table 1) and describes the specific scenarios according to their characteristics.
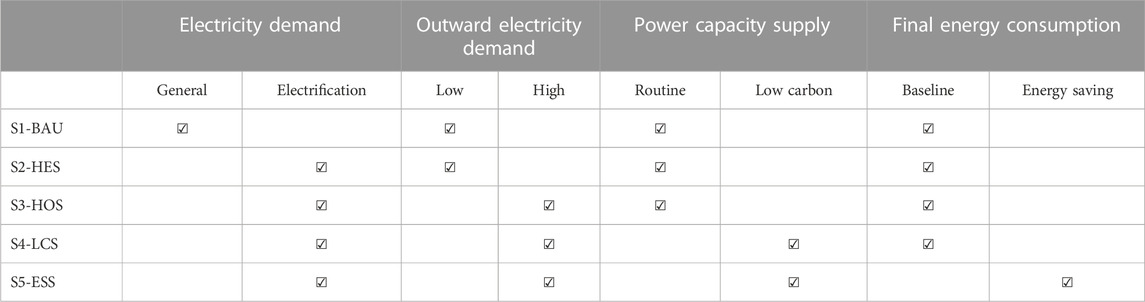
TABLE 1. Scenario setting.
Scenario 1- Business-as-usual scenario (BAU): Considering the impact from the policy perspective, the zero-carbon energy transition is required to meet the balance of supply and demand for energy safety and reliable supply. According to relevant policies and plans in Ningxia Province, BAU, scenario is set with reference to the historical level and policy intensity. The sectoral primary energy consumption data are obtained from China Energy Statistical Yearbooks (2009–2021). The proportion of electricity and hydrogen in final energy consumption in 2060 will be 55% and 7%, respectively, and the proportion of renewable energy in heat and hydrogen supply will be 10% and 80%, respectively.
Scenario 2- High electrification scenario (HES): Based on scenario 1, considering the impacts on the demand side from the techno-economic perspective, HES reflects an additional electricity consumption from the whole society, an improvement of terminal electrification, and an increasing proportion of electricity and hydrogen in the energy conversion process. The proportion of electricity and hydrogen in final energy consumption in 2060 will be 60% and 8%, respectively, and the proportion of renewable energy in the heat and hydrogen supply will be 20% and 90%, respectively.
Scenario 3- High outward electricity scenario (HOS): Based on scenario 2, considering the impacts on the demand side from the techno-economic perspective, transmission of outward electricity is increased in HOS, in which the proportion of final energy consumption is increased. The proportion of electricity in the final energy consumption will be 65% in 2060.
Scenario 4- Low carbon scenario (LCS): Based on scenario 3, considering the impacts on the supply side from the techno-economic perspective, the proportion of power, heat and hydrogen supply from green energy is increased in LCS. The installed capacity of new energy power generation such as wind power and photovoltaic power will increase, and the rate of electrification will be 70%. Heat and hydrogen supply from renewable energy will be 20% and 90% in 2060, respectively.
Scenario 5- Energy saving scenario (ESS): Based on scenario 4, considering the impact on the development of energy-saving technologies from the socio-technical perspective, through the application of enhanced energy-saving technologies, in ESS, the intensity of final energy consumption will be further reduced, the efficiency of energy conversion and utilization will be improved, and the total amount of final energy consumption will be reduced.
According to different scenario settings, the total amount of final energy consumption and the proportion of different types of energy are set (see Figure 7). The total amount of final energy consumption remains consistent from S1 to S4, while in S5, the Energy saving scenario, the total final energy consumption is relatively lower. But the proportions of different types of energy in S4 and S5 remain consistent.
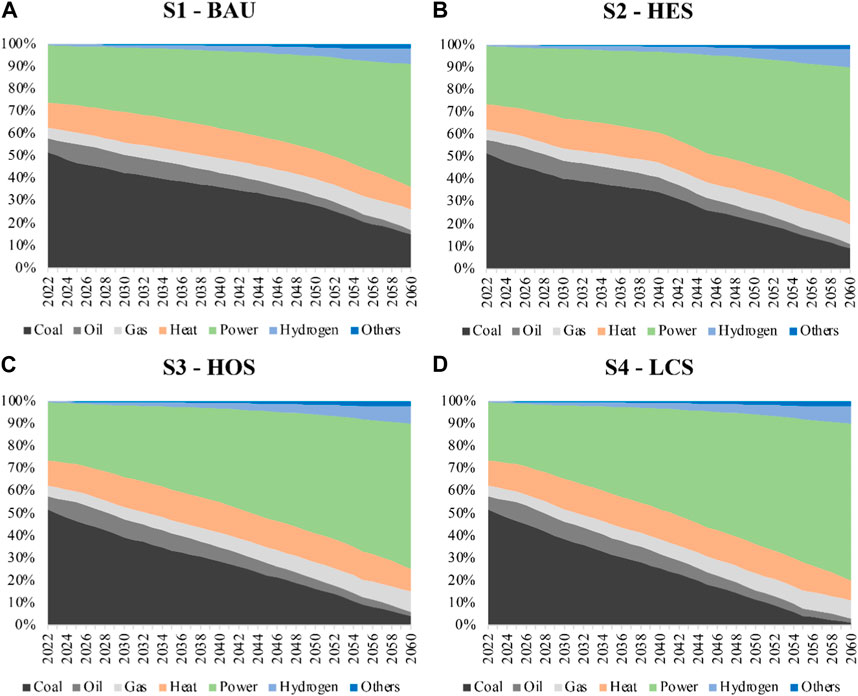
FIGURE 7. Proportion of final energy consumption by energy types.
The design of BAU is crafted upon the existing energy reform and development policies in Ningxia Province, meticulously benchmarked against international advanced standards. It takes into account various critical factors, including China’s national requirements on carbon peaking and carbon neutrality, the ongoing accelerated electrification process in Ningxia Province, the large amount of outward electricity, the rapid development of clean energy alternatives and non-fossil energy, as well as the anticipation of vigorous promotion of user-end energy-saving measures. In this paper, based on data availability and the effective time period of related plans, 2021 is identified as the base period and 2022-2060 as the forecast period. The LEAP-Ningxia model is applied to generate the results of PEP, SEC, FEC, and CO2 emissions for scenarios including BAU, HES, HOS, LCS and ESS.
PEP in Ningxia Province by sectors under different scenarios until 2060 is shown in Figure 8. PEP is mainly derived from the industrial sector, reaching the maximum in HOS. This is due to the increasing demand for primary energy triggered by the increase of both local electricity demand and the outward transmission. As more power supply comes from new energy and the user-end energy-saving technologies are being applied, PEP will experience a relatively large decline. Compared with HOS, the total PEP in LCS and ESS will drop by 1.8% and 8.9% respectively.
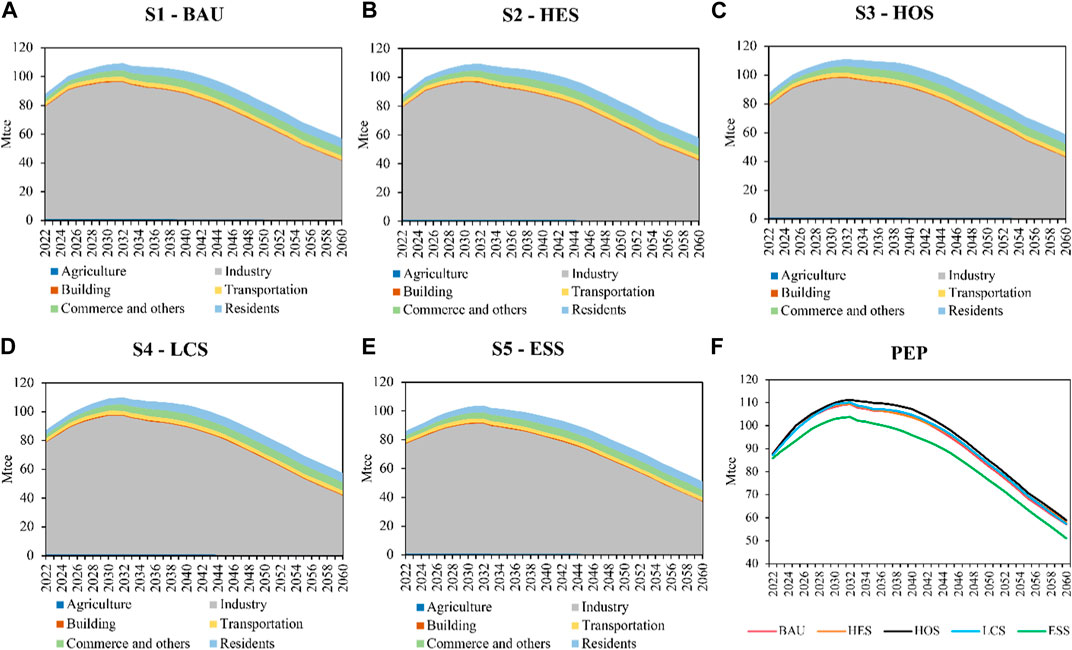
FIGURE 8. PEP by sectors under different scenarios.
SEC in Ningxia Province by energy types under different scenarios until 2060 is shown in Figure 9. From the aspect of power supply, with a 15% of reserve margin and another 15% of margin for uncertainty in new energy output, the available power supply in Ningxia will rise from about 215 to 225 TWh/a in 2022 to about 360–400 TWh/a in 2060. From the aspect of the power supply structure, the power supply from wind and solar will grow significantly in the future, reaching 222–236 TWh/a by 2060, accounting for 57%–62% of the total power supply. The power supply from coal will increase from about 142 to 159 TWh/a in 2022 to about 187–200 TWh/a in 2030, then gradually decrease to about 69–128 TWh/a in 2060. For power supply from coal applying BECCS to reduce CO2 emissions, 76% will be achieved in HOS, 83% in HES, and over 90% in LCS and ESS. From the aspect of heat supply, after reaching its peak, the population will gradually decrease, and the total heat supply will increase from about 215 to 221 million GJ/a in 2022 to about 311–332 million GJ/a in 2037, then gradually decrease to about 125–139 million GJ/a in 2060. From the aspect of hydrogen supply, the production will gradually increase from 2023 to 2060, with the total production reaching about 130–145 million GJ/a in 2060, of which the green hydrogen will account for 88%–97%.
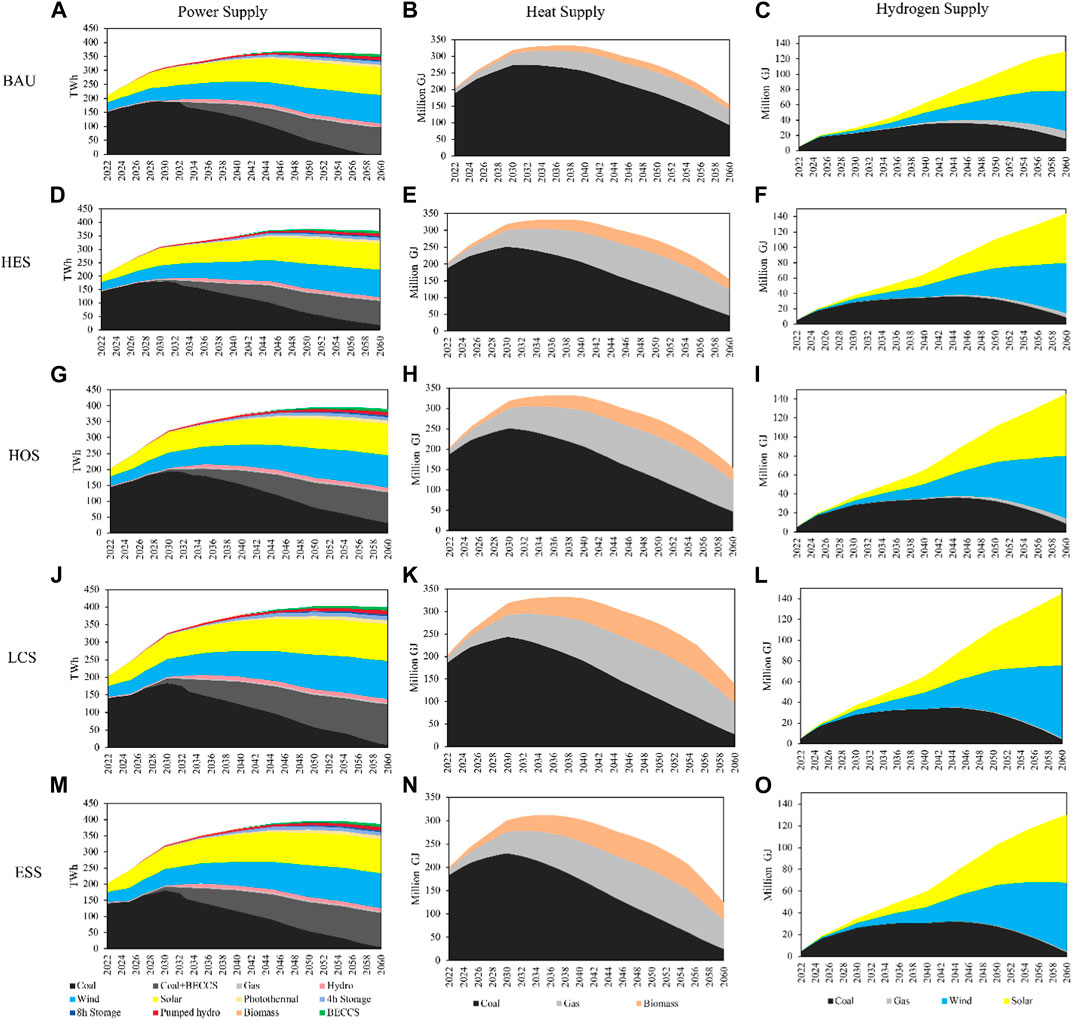
FIGURE 9. SEC by energy types under different scenarios.
FEC in Ningxia Province by energy types under different scenarios until 2060 is shown in Figure 10. The total FEC remains consistent in S1 to S4, only each energy type making up different proportions. In S5, namely, the Energy Saving Scenario, a lower total FEC is projected compared with other scenarios.

FIGURE 10. FEC by energy types under different scenarios.
The total CO2 emissions without CCS and carbon credits under different scenarios, as illustrated in Figure 11, are calculated based on primary energy production, the CO2 emission intensity of different types of energy in power sector (refer to Figure 12), and the CO2 emission factor of coal, oil and gas. It is evident from the analysis that under the five scenarios, disregarding CCS and carbon credits, Ningxia will achieve carbon peaking in 2030, but it seems unattainable to meet the carbon neutrality goal in 2060. The total CO2 emissions of the province in 2060 will reach about 74–101 Mt, signifying a considerable gap from attaining the zero-carbon energy system. Despite the progress towards carbon peaking, substantial efforts and additional measures are imperative to bridge this significant distance.

FIGURE 11. CO2 emissions under different scenarios (without CCS and carbon credits).
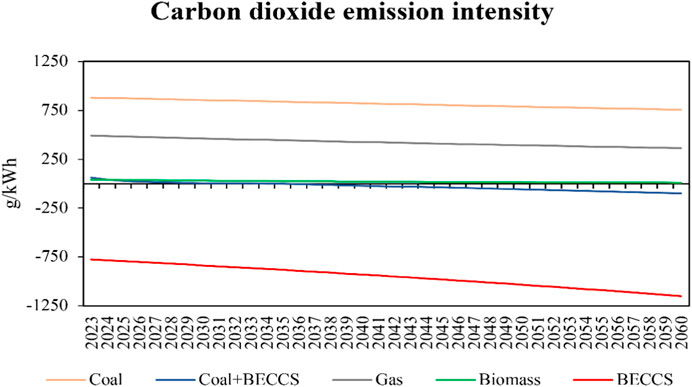
FIGURE 12. CO2 emission intensity of different types of energy in power sector.
By implementing biomass and coal co-firing with carbon capture devices and utilizing BECCS in power sector, significant reductions in CO2 emission intensity and the attainment of negative emissions are achievable, as depicted in Figure 13. Generally, the energy contained within 1 tonne of biomass equals 0.5 tonnes of coal equivalent, and 1 tonne of biomass fully combusted emits about 1.33 tonnes of CO2. Therefore, the total biomass available in Ningxia corresponds to a carbon sink of 14.1 MtCO2, as detailed in Supplementary Table S9 (Wei et al., 2021). According to the total CO2 emissions with CCS and carbon credits under different scenarios in Figure 13, it can be found that the total CO2 emissions in Ningxia can be decreased gradually since carbon capture and storage (CCS) and carbon credits are contributing to the reduction of CO2 concentration in the atmosphere. In scenarios such as BAU, HES and HOS, the total CO2 emissions in Ningxia are projected to decrease to a range of 17–23 MtCO2 until 2060. In scenarios LCS and ESS, the energy sector in Ningxia could achieve 6–9 Mt of negative CO2 emissions until 2060.
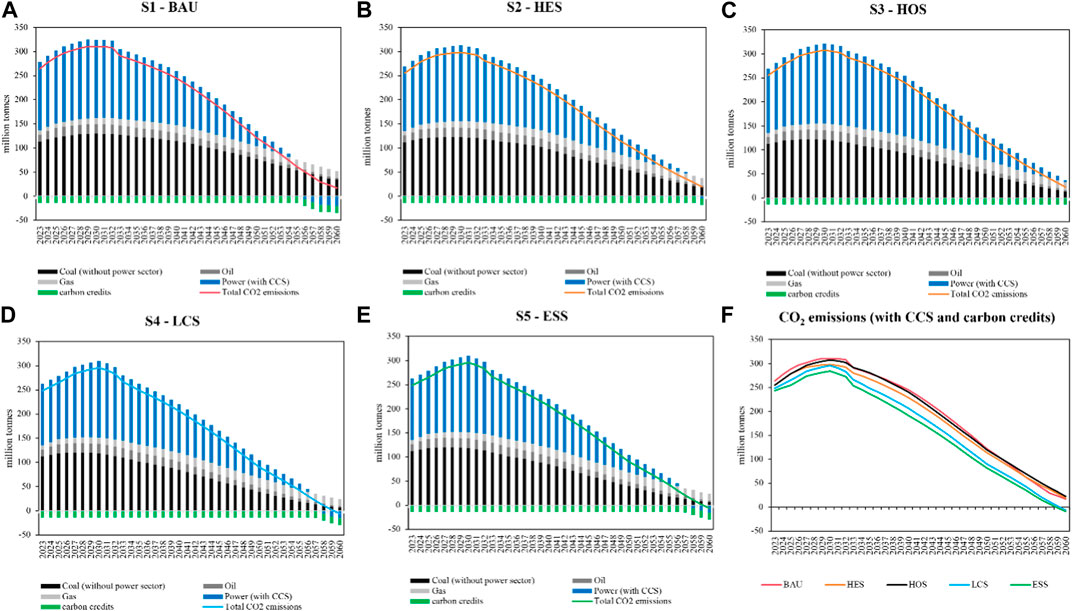
FIGURE 13. CO2 emissions under different scenarios (with CCS and carbon credits).
Further analysis is conducted on the contribution of various CO2 emission reduction measures from different aspects, as illustrated in Figure 14. From the policy perspective, main measures are from outward electricity and carbon credit, and the reduction contribution will decrease from 29% in 2025 to 21% in 2060. In the mid- and long-term, Ningxia Province will continue to play a vital role in guaranteeing China’s West-East Power Transmission Project. Over the period from 2023 to 2060, an additional 655 TWh outward electricity will be produced compared with BAU, generating about another 314 MtCO2. But as the proportion of outward electricity from thermal power gradually decreases, the corresponding CO2 emissions are also gradually decreasing. Ningxia Province continues to strengthen the protection of biomass diversity. Through measures such as afforestation and vegetation restoration, as well as processes, activities or mechanisms that can reduce the concentration of greenhouse gases in the atmosphere, about 14.1 MtCO2 of carbon credits can be generated per year based on the existing amount of biomass in Ningxia.
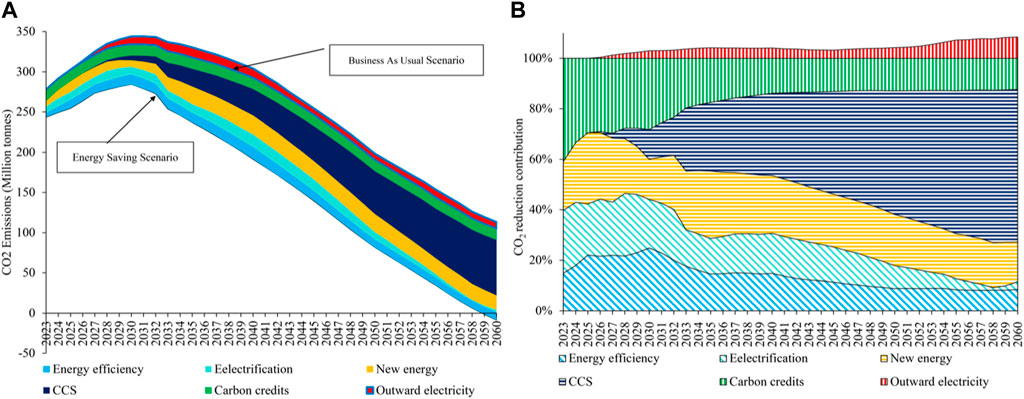
FIGURE 14. CO2 reduction contribution evolution of various measures (A) represents the absolute amount and (B) represents the contribution degree.
From the socio-technical perspective, measures are mainly from new energy and CCS technologies, with a reduction contribution increasing from 28% in 2025 to 76% in 2060. Through accelerating the progress to harness renewable energy and gradually making it a main source of electricity and hydrogen, 703 MtCO2 can be reduced compared with BAU. Embedding CCS equipment in electricity infrastructure is the most effective measure in reducing CO2 emissions. The reduction of 1,304 MtCO2 from 2023 to 2060 is the key to achieve zero or even negative carbon emissions in Ningxia by 2060.
From the techno-economic perspective, main measures are from electrification and energy saving, with a reduction contribution decreasing from 42% in 2025 to 12% in 2060. Despite the increase in the demand for electricity, the total CO2 emissions will decrease to some extent, by about 400 MtCO2 compared with BAU. Meanwhile, through the energy efficient technologies equipped in the infrastructure, about 189Mtce of energy consumption and about 422 MtCO2 can be reduced from 2023 to 2060 compared with BAU.
Achieving carbon peaking and neutrality necessitates a unified effort spanning various sectors and energy sources. It is crucial to succinctly outline the evolution and patterns of the zero-carbon energy transition, starting from the multi-level perspectives to balance the triangle paradox of “safety and reliability, cleaning and low carbon, as well as energy justice”. The formulation of a scientifically grounded path for CO2 emissions reduction holds paramount significance. This study, rooted in Ningxia’s present energy landscape, projects low-carbon transition scenarios by considering future trends in population, economy, and industrial structure adjustments from 2023 to 2060. Leveraging the LEAP-Ningxia model and employing multi-level perspectives, the analysis encompasses PEP, SEC, FEC, and CO2 emissions simulations.
The imperative for a successful zero-carbon energy transition in Ningxia Province lies in the intricate integration and collaboration of various factors, encompassing technology, economy, policies, and societal structures. A nuanced examination under five low-carbon energy transition scenarios reveals crucial dynamics, firstly, without considering Carbon Capture and Storage (CCS) and carbon credits, Ningxia is poised to achieve carbon peaking by 2030. However, the ambitious goal of carbon neutrality by 2060 remains unattainable. Secondly, under scenarios with CCS and carbon credits, in BAU, HES and HOS, the total CO2 emissions in Ningxia will drop to 17–23 MtCO2 until 2060. In LCS and ESS, 6–9 MtCO2 of negative emissions from the energy sector in Ningxia can be achieved until 2060. Overall, high outward electricity will increase local CO2 emissions in Ningxia, while measures such as adopting terminal energy-saving technologies, raising electrification rate, increasing the supply of new energy, installing CCS equipment and conserving biomass resources can reduce CO2 emissions.
From the techno-economic perspective, the energy transition in Ningxia encounters challenges related to economic growth, carbon budgets and technologies advancements. The current financial support for CO2 reduction is deemed insufficient, necessitating a delicate equilibrium between stable economic growth, cost reduction and fostering innovation. From the socio-technical perspective, Ningxia’s energy development used to depend on coals, as well as the entire coal industry chain, i.e., the existing energy suppliers, deeply ingrained in the coal sector, play a pivotal role in Ningxia’s industrial development. To realize Ningxia’s energy transition requires dismantling the monopoly held by local traditional industries. Market mechanisms, such as the carbon market, stand out as vital tools to incentivize and facilitate the green and low-carbon transition. From the policy perspective, as an important province in the West-East Power Transmission project, Ningxia bears the responsibility of ensuring secure energy supply while balance regional development. Policymakers must navigate the dual objectives to foster a sustainable and equitable energy transition in the region.
Towards the zero-carbon energy transition, Ningxia Province should delineate clear milestones for distinct periods, fostering coordinated interactions across the multi-level perspective. In the short term (2023–2025), the focus lies on transforming and optimizing the existing status through the implementation of terminal energy-saving technologies, coupled with increased investment to spur technological innovation. Moving into the medium term (2025–2035), the emphasis shifts to technological substitution, systematically upgrading existing mechanisms with the integration of new energy sources, while also recognizing the impact on the social landscape and systems. Looking ahead to the long term (2035–2060), the strategic focus turns to reconfiguration, involving gradual adjustments and restructuring to seamlessly integrate emerging innovations into the existing system. This includes introducing novel technologies, such as combining biomass and coal co-firing with Carbon Capture and Storage (CCS) equipment and green hydrogen initiatives, as supplements or replacements. This triphasic strategy ensures a progressive, adaptive, and holistic zero-carbon energy transition for Ningxia Province.
The rapid evolution in energy sector has significant implications for the ongoing research. Currently, the studies may not have kept pace with the latest technological advancements and innovations, which, in turn, can hinder our ability to accurately predict potential changes in the future. Furthermore, it is important to note that our present research is based on a specific moment in time, focusing on the prevailing policies. However, it is crucial to recognize that policy adjustments in the future may impact the effectiveness of energy transition efforts profoundly. This underscores the need for a more comprehensive consideration of these factors in the upcoming research endeavors. Accordingly, additional research is indispensable. This research aims to assess the effectiveness of various policy instruments and practices from Ningxia government to support the zero-carbon energy transition. A specific area of focus is to evaluate the subsidies and their impact on the energy transition. While the LEAP-Ningxia modeling tool has proven valuable in assisting the region in its pursuit of climate mitigation goals, it is essential to acknowledge there are limitations in terms of technology options and underlying assumptions of the tool. For the success of Ningxia’s zero-carbon energy transition initiatives, it is imperative to further enhance and refine both policy measures and modeling capabilities. This will ensure that the region is better equipped to navigate the evolving energy landscape and achieve its sustainable development.
The original contributions presented in the study are included in the article/Supplementary Material, further inquiries can be directed to the corresponding author.
CQ: Conceptualization, Visualization, Writing–original draft, Writing–review and editing. JM: Methodology, Writing–review and editing. BC: Data curation, Writing–review and editing. JK: Data curation, Writing–original draft. YZ: Data curation, Writing–review and editing. ZH: Conceptualization, Methodology, Software, Visualization, Writing–original draft, Writing–review and editing.
The author(s) declare financial support was received for the research, authorship, and/or publication of this article. In this paper, the research was sponsored by the funding of the Science and Technology Project from State Grid Ningxia Electric Power Co., Ltd. (Project Name: Research and application on carbon emission calculation model of power sector in Ningxia under the “dual carbon” goal, 5229JY230003). The funder was not involved in the study design, collection, analysis, interpretation of data, the writing of this article, or the decision to submit it for publication.
Authors CQ, JM, and BC were employed by State Grid Ningxia Electric Power Co., Ltd.
The remaining authors declare that the research was conducted in the absence of any commercial or financial relationships that could be construed as a potential conflict of interest.
All claims expressed in this article are solely those of the authors and do not necessarily represent those of their affiliated organizations, or those of the publisher, the editors and the reviewers. Any product that may be evaluated in this article, or claim that may be made by its manufacturer, is not guaranteed or endorsed by the publisher.
The Supplementary Material for this article can be found online at: https://www.frontiersin.org/articles/10.3389/fenrg.2023.1305885/full#supplementary-material
Abbasi, K. R., Shahbaz, M., Zhang, J., Irfan, M., and Alvarado, R. (2022). Analyze the environmental sustainability factors of China: the role of fossil fuel energy and renewable energy. Renew. Energy 187, 390–402. doi:10.1016/j.renene.2022.01.066
Anbumozhi, V., Kimura, F., and Kalirajan, K. (2018). “Unlocking the potentials of private financing for accelerated low-carbon energy transition: an overview,” in Financing for low-carbon energy transition: unlocking the potential of private capital, 1–13. doi:10.1007/978-981-10-8582-6_1
Bartholdsen, H. K., Eidens, A., Löffler, K., Seehaus, F., Wejda, F., Burandt, T., et al. (2019). Pathways for Germany’s low-carbon energy transformation towards 2050. Energies 12 (15), 2988. doi:10.3390/en12152988
BJX. Peoples Republic of China (2023). The first ‘Desert-Gobi-Wasteland’ new energy power generation mega-base's ultra-high-voltage transmission project has entered a comprehensive construction phase. https://guangfu.bjx.com.cn/news/20231020/1338024.shtml (Accessed October 20, 2023).
Chatterjee, S., Stavrakas, V., Oreggioni, G., Süsser, D., Staffell, I., Lilliestam, J., et al. (2022). Existing tools, user needs and required model adjustments for energy demand modelling of a carbon-neutral Europe. Energy Res. Soc. Sci. 90, 102662. doi:10.1016/J.ERSS.2022.102662
Cherp, A., Vinichenko, V., Jewell, J., Brutschin, E., and Sovacool, B. (2018). Integrating techno-economic, socio-technical and political perspectives on national energy transitions: a meta-theoretical framework. Energy Res. Soc. Sci. 37, 175–190. doi:10.1016/j.erss.2017.09.015
De La Peña, L., Guo, R., Cao, X., Ni, X., and Zhang, W. (2022). Accelerating the energy transition to achieve carbon neutrality. Resour. Conservation Recycl. 177, 105957. doi:10.1016/J.RESCONREC.2021.105957
Feng, S., Ren, H., and Zhou, W. (2023). A review of uncertain factors and analytic methods in long-term energy system optimization models. Glob. Energy Interconnect. 6 (4), 450–466. doi:10.1016/J.GLOEI.2023.08.006
Gan, Y., Lu, Z., He, X., Hao, C., Wang, Y., Cai, H., et al. (2021). Provincial greenhouse gas emissions of gasoline and plug-in electric vehicles in China: comparison from the consumption-based electricity perspective. Environ. Sci. Technol. 55 (10), 6944–6956. doi:10.1021/ACS.EST.0C08217
Geels, F. W. (2011). The multi-level perspective on sustainability transitions: responses to seven criticisms. Environ. innovation Soc. transitions 1 (1), 24–40. doi:10.1016/j.eist.2011.02.002
Geels, F. W., Kern, F., Fuchs, G., Hinderer, N., Kungl, G., Mylan, J., et al. (2016). The enactment of socio-technical transition pathways: a reformulated typology and a comparative multi-level analysis of the German and UK low-carbon electricity transitions (1990–2014). Res. policy 45 (4), 896–913. doi:10.1016/j.respol.2016.01.015
Grodal, S., Krabbe, A. D., and Chang-Zunino, M. (2023). The evolution of technology. Acad. Manag. Ann. 17 (1), 141–180. doi:10.5465/annals.2021.0086
Hansen, K., Breyer, C., and Lund, H. (2019). Status and perspectives on 100% renewable energy systems. Energy 175, 471–480. doi:10.1016/j.energy.2019.03.092
Huang, R., Zhang, S., and Wang, P. (2022). Key areas and pathways for carbon emissions reduction in Beijing for the “Dual Carbon” targets. Energy Policy 164, 112873. doi:10.2139/ssrn.4007225
Ismail, K., Lubwama, M., Kirabira, J. B., and Sebbit, A. (2023). Development of a sustainable low-carbon footprint for the Greater Kampala Metropolitan Area: the efficacy of a TIMES/CGE hybrid framework. Energy Rep. 9, 19–36. doi:10.1016/J.EGYR.2022.11.144
King, L. C., and Van Den Bergh, J. C. (2018). Implications of net energy-return-on-investment for a low-carbon energy transition. Nat. energy 3 (4), 334–340. doi:10.1038/s41560-018-0116-1
Kobos, P. H., Erickson, J. D., and Drennen, T. E. (2006). Technological learning and renewable energy costs: implications for US renewable energy policy. Energy policy 34 (13), 1645–1658. doi:10.1016/j.enpol.2004.12.008
Kougias, I., Taylor, N., Kakoulaki, G., and Jäger-Waldau, A. (2021). The role of photovoltaics for the European Green Deal and the recovery plan. Renew. Sustain. Energy Rev. 144, 111017. doi:10.1016/j.rser.2021.111017
Lin, B., and Xie, C. (2014). Reduction potential of CO2 emissions in China׳ s transport industry. Renew. Sustain. Energy Rev. 33, 689–700. doi:10.1016/j.rser.2014.02.017
Liu, Y. (2023). CO2 emissions of constructing China’s power grid towards carbon–neutral target: based on top-down and bottom-up integrated model. Environ. Sci. Pollut. Res. 30, 82083–82093. doi:10.1007/s11356-023-28135-2
Ma, H., Sun, Q., Chen, L., Chen, Q., Zhao, T., He, K., et al. (2023). Cogeneration transition for energy system decarbonization: from basic to flexible and complementary multi-energy sources. Renew. Sustain. Energy Rev. 187, 113709. doi:10.1016/J.RSER.2023.113709
Markard, J., and Truffer, B. (2008). Technological innovation systems and the multi-level perspective: towards an integrated framework. Res. policy 37 (4), 596–615. doi:10.1016/j.respol.2008.01.004
Mo, J., Zhang, W., Tu, Q., Yuan, J., Duan, H., Fan, Y., et al. (2021). The role of national carbon pricing in phasing out China's coal power. IScience 24 (6), 102655. doi:10.1016/j.isci.2021.102655
National Development and Reform Commission (NDRC), People´s Republic of China., “China: National Population Development Plan,” (2017). https://www.ndrc.gov.cn/fggz/fzzlgh/gjjzxgh/201705/t20170502_1196730.html [Accessed May 02, 2017]
Ningxia, G. O. V., and Nx, G. O. V. (2021). The outline of the 14th five-year plan and 2035 vision for the national economic and social development of the Ningxia hui autonomous region. https://www.nx.gov.cn/zwgk/qzfwj/202103/t20210309_2620843.html (Accessed March 09, 2021).
Ningxia, G. O. V., and Nx, G. O. V. (2022). The 14th five-year plan for energy development of Ningxia hui autonomous region. https://www.nx.gov.cn/zwxx_11337/zcjd/zcjd/202212/t20221213_3886695.html (Accessed December 13, 2022).
Pichancourt, J. B., Manso, R., Ningre, F., Ningre, F., and Fortin, M. (2018). A carbon accounting tool for complex and uncertain greenhouse gas emission life cycles. Environ. Model. Softw. 107, 158–174. doi:10.1016/j.envsoft.2018.06.005
Qi, R., Shi, C., and Wang, M. Y. (2023). Carbon emission rush in response to the carbon reduction policy in China. China Inf. 37 (1), 100–122. doi:10.1177/0920203X221093188
Rhodes, E., Hoyle, A., McPherson, M., and Craig, K. (2022). Understanding climate policy projections: a scoping review of energy-economy models in Canada. Renew. Sustain. Energy Rev. 153, 111739. doi:10.1016/J.RSER.2021.111739
Rogge, K. S., and Johnstone, P. (2017). Exploring the role of phase-out policies for low-carbon energy transitions: the case of the German Energiewende. Energy Res. Soc. Sci. 33, 128–137. doi:10.1016/j.erss.2017.10.004
Schot, J., and Kanger, L. (2018). Deep transitions: emergence, acceleration, stabilization and directionality. Res. Policy 47 (6), 1045–1059. doi:10.1016/j.respol.2018.03.009
Sovacool, B. K., Baum, C., and Low, S. (2023). The next climate war? Statecraft, security, and weaponization in the geopolitics of a low-carbon future. Energy Strategy Rev. 45, 101031. doi:10.1016/j.esr.2022.101031
Tian, J., Yu, L., Xue, R., Zhuang, S., and Shan, Y. (2022). Global low-carbon energy transition in the post-COVID-19 era. Appl. energy 307, 118205. doi:10.1016/J.APENERGY.2021.118205
Tu, Q., Betz, R., Mo, J., Fan, Y., and Liu, Y. (2018). Can carbon pricing support onshore wind power development in China? An assessment based on a large sample project dataset. J. Clean. Prod. 198, 24–36. doi:10.1016/j.jclepro.2018.06.292
Wainstein, M. E., and Bumpus, A. G. (2016). Business models as drivers of the low carbon power system transition: a multi-level perspective. J. Clean. Prod. 126, 572–585. doi:10.1016/j.jclepro.2016.02.095
Wang, K., Wang, C., Lu, X., and Chen, J. (2007). Scenario analysis on CO2 emissions reduction potential in China's iron and steel industry. Energy Policy 35 (4), 2320–2335. doi:10.1016/j.enpol.2006.08.007
Wang, L., Patel, P. L., Yu, S., Liu, B., McLeod, J., Clarke, L. E., et al. (2016). Win–win strategies to promote air pollutant control policies and non-fossil energy target regulation in China. Appl. energy 163, 244–253. doi:10.1016/j.apenergy.2015.10.189
Warbroek, B., and Hoppe, T. (2017). Modes of governing and policy of local and regional governments supporting local low-carbon energy initiatives; exploring the cases of the Dutch regions of Overijssel and Fryslân. Sustainability 9 (1), 75. doi:10.3390/su9010075
Wei, N., Jiao, Z., Ellett, K., Ku, A. Y., Liu, S., Middleton, R., et al. (2021). Decarbonizing the coal-fired power sector in China via carbon capture, geological utilization, and storage technology. Environ. Sci. Technol. 55 (19), 13164–13173. doi:10.1021/acs.est.1c01144
Wilson, D., and Swisher, J. (1993). Exploring the gap: top-down versus bottom-up analyses of the cost of mitigating global warming. Energy policy 21 (3), 249–263. doi:10.1016/0301-4215(93)90247-D
Wu, F., Huang, N., Zhang, F., Niu, L., and Zhang, Y. (2020). Analysis of the carbon emission reduction potential of China's key industries under the IPCC 2 °C and 1.5 °C limits. Technol. Forecast. Soc. Change 159, 120198. doi:10.1016/j.techfore.2020.120198
Wu, S. (2023). A systematic review of climate policies in China: evolution, effectiveness, and challenges. Environ. Impact Assess. Rev. 99, 107030. doi:10.1016/J.EIAR.2022.107030
Xu, H., and Liu, J. (2019). Implications of “two mountains” theory on China’s green development. Chin. J. Urban Environ. Stud. 7 (02), 1975008. doi:10.1142/S2345748119750083
Yang, J., Zhang, W., Zhao, D., Zhao, C., and Yuan, J. (2022). What can China learn from the UK's transition to a low-carbon power sector? A multi-level perspective. Resour. Conservation Recycl. 179, 106127. doi:10.1016/j.resconrec.2021.106127
Zhao, W. J. (2022). China's goal of achieving carbon neutrality before 2060: experts explain how. Natl. Sci. Rev. 9 (8), 115. doi:10.1093/nsr/nwac115
Zhou, N., Khanna, N., Feng, W., Ke, J., and Levine, M. (2018). Scenarios of energy efficiency and CO2 emissions reduction potential in the buildings sector in China to year 2050. Nat. Energy 3 (11), 978–984. doi:10.1038/s41560-018-0253-6
Zhou, Y., Cao, S., Hensen, J. L., and Lund, P. D. (2019). Energy integration and interaction between buildings and vehicles: a state-of-the-art review. Renew. Sustain. Energy Rev. 114, 109337. doi:10.1016/j.rser.2019.109337
Zou, C., Ma, M., Zhou, N., Feng, W., You, K., and Zhang, S. (2023). Toward carbon free by 2060: a decarbonization roadmap of operational residential buildings in China. Energy 277, 127689. doi:10.1016/J.ENERGY.2023.127689
Keywords: energy transition, decarbonization, multi-level perspective, carbon neutrality, CO2 reduction measures
Citation: Qi C, Meng J, Che B, Kang J, Zhao Y and Hua Z (2023) Transition to a zero-carbon energy system in the Ningxia area: integrated CO2 reduction measures from the multi-level perspective. Front. Energy Res. 11:1305885. doi: 10.3389/fenrg.2023.1305885
Received: 02 October 2023; Accepted: 16 November 2023;
Published: 27 November 2023.
Edited by:
Jianli Zhou, Xinjiang University, ChinaReviewed by:
Jianlei Mo, Chinese Academy of Sciences (CAS), ChinaCopyright © 2023 Qi, Meng, Che, Kang, Zhao and Hua. This is an open-access article distributed under the terms of the Creative Commons Attribution License (CC BY). The use, distribution or reproduction in other forums is permitted, provided the original author(s) and the copyright owner(s) are credited and that the original publication in this journal is cited, in accordance with accepted academic practice. No use, distribution or reproduction is permitted which does not comply with these terms.
*Correspondence: Zhilei Hua, MTM5MTA1MDc3ODBAMTYzLmNvbQ==
Disclaimer: All claims expressed in this article are solely those of the authors and do not necessarily represent those of their affiliated organizations, or those of the publisher, the editors and the reviewers. Any product that may be evaluated in this article or claim that may be made by its manufacturer is not guaranteed or endorsed by the publisher.
Research integrity at Frontiers
Learn more about the work of our research integrity team to safeguard the quality of each article we publish.