 Xu Deng
 Junpei Nan
 Jieran Feng2
 Hao Zhou
- 1School of Electric Power Engineering, South China University of Technology, Guangzhou, China
- 2College of Electrical Engineering, Zhejiang University, Hangzhou, China
- 3Grid Planning and Research Center, Guangdong Power Grid Corporation, China Southern Power Grid Company Limited, Guangzhou, China
The rapid development of low-carbon energy technologies and energy storage technologies has provided an important and feasible path to decarbonizing the power system. In this context, there is an increasing number of studies on renewable energy, carbon capture, utilization and storage (CCUS) and energy storage expansion planning. However, most of the existing studies attribute the carbon responsibilities to the source side and a small number to the load side. Expansion planning studies that consider the overall carbon emissions of the system to be shared between the source and the load side are still relatively few. Therefore, it is necessary for the source and the load side to share the responsibility for the total system carbon emissions. To fill this research gap, this paper proposes a source-load bilateral carbon incentive mechanism for wind-CCUS-battery power systems based on the carbon emission flow theory. Besides, a bi-layer wind-CCUS-battery expansion stochastic planning framework considering wind and load uncertainties is constructed. The first layer takes the minimum expectation of power generation costs, fixed investment costs of wind turbines and CCUS units and carbon incentive costs as the objective function from a source-side perspective. The second layer takes the minimum battery investment cost and the expectation of electricity purchasing costs and load-side carbon incentive costs as the objective function from a load-side perspective. Finally, the proposed model is tested on the IEEE 24 bus power system for validity and advantage. The results show that the current high investment cost is not favorable to CCUS construction. At this time, the bilateral carbon incentive mechanism is more conducive to promoting system carbon reduction than the unilateral carbon incentive mechanism. In the future, as the cost of CCUS decreases, the source-side carbon incentive mechanism is more conducive to system carbon reduction than the bilateral carbon incentive mechanism. Due to the consideration of the stochastic uncertainty of wind turbines and loads, the research in this paper is closer to the reality, which can provide a reference for the future carbon emission reduction path of the power system, especially for the quantitative analysis of carbon emission reduction of CCUS, which is an important guiding significance for the promotion of the engineering practice of CCUS.
1 Introduction
Climate change is a common challenge faced by mankind, and the Paris Agreement, adopted at the Paris Climate Change Conference in 2015, signals the urgency of addressing the climate crisis to all countries in the world by setting targets (Ostberg et al., 2018; Wang Y. et al., 2022; Meinshausen et al., 2022). To cope with global warming, countries are advocating a “low-carbon economy”, such as China has put forward the goal of “carbon peak and carbon neutrality”, committing to strive to peak carbon dioxide emissions by 2030, and strive for carbon neutrality by 2060 (Zhuo et al., 2022). In 2021, the European Commission announced a climate package called “Fit for 55”, committing to a 55% reduction in greenhouse gas emissions by the end of 2030 compared to 1990 (Sun et al., 2022a). Russian claimed a carbon emission reduction of 30% by 2030 (Guo et al., 2022). As a main fossil fuel industry, the carbon emissions from the power sector account for about 40% of the total carbon emissions from energy consumption in China (Guo et al., 2022). With the rapid development of electric vehicles and smart homes in recent years, electricity carbon emissions are expected to account for a higher proportion of the total energy carbon emissions in the future. Therefore, carbon emission reduction in the power sector is of great significance to carbon emission reduction in the whole energy system. Carbon emissions from the power sector come mainly from coal-fired and gas-fired power plants, while clean energy power generation, such as wind power, solar power, hydroelectric power and nuclear power, produces almost no carbon dioxide emissions. Thus, there are three main carbon reduction pathways for the power sector (Algarni et al., 2021; Deng et al., 2023): the first is to reduce the use of coal-fired generators, the second is to increase the generation of electricity from renewable energy sources, and the third is to impose carbon capture, utilization and storage (CCUS) technology on coal-fired power plants. Since coal-fired generators usually meet baseload, reducing the use of coal-fired generators has risk implications for power system security, and morever there is limited scope for reducing coal consumption per unit of electricity generation. Thus, the latter two pathways are more worthy of study. In addition, renewable energy sources with intermittent output drive the development of energy storage. The time-shift characteristic of energy storage facilitates the system accommodation of renewable energy, which in turn reduces system carbon emissions (Li et al., 2019; Pourakbari-Kasmaei et al., 2020; Li et al., 2021; Guo et al., 2022). Therefore, low-carbon oriented coordinated planning of renewable energy, energy storage and CCUS is a direction worth exploring.
Currently, the expansion planning for renewable energy mainly focuses on two aspects: capacity expansion planning and incentive policy. In terms of renewable energy capacity expansion planning, Moreira et al. (2017) proposed a two-stage min-max-min model for co-optimizing the expansion of the transmission system and renewable generation capacity to meet renewable targets under high security standards and renewable uncertainty. A large number of studies have focused on the optimal planning of integrated energy systems (Huang et al., 2019; Gabbar et al., 2020; Liu and Wang, 2020; Shi et al., 2020; Liu et al., 2021; Lin et al., 2022). Huang et al. (2019) proposed a two-stage mixed-integer linear programming approach for multi-energy system planning considering distributed renewable energy integration. Liu et al. (2021) proposed a novel multi-objective interval optimization framework for the energy hub planning problem from the perspective of source-load synergy, taking into account the supply- and demand-side uncertainty. Gabbar et al. (2020) studied the optimal planning of nuclear-renewable micro-hybrid energy system. Liu and Wang (2020) developed a two-stage optimization model to study the energy storage and renewable energy planning, with the investment, operation, and maintenance costs of energy storage and wind turbines, as well as the annual network loss costs as the objective function. Shi et al. (2020) proposed a hierarchical optimization algorithm to simultaneously optimize the capacity of renewable energy and energy storage capacity. Lin et al. (2022) established a multi-scenario stochastic programming model of an integrated energy system by considering the multiple uncertainties of wind and solar power output, load demands, energy prices, and pollutant emission factors. It can be seen that the above studies basically take the economic cost sucn as investment cost, operation and maintenace cost as the objective function, and part of the literature also takes into account the utilization rate of renewable energy, renewable energy power generation, annual network loss costs and other indexes in the objective function. But basically they do not take into account the environmental benefits of renewable energy, and they do not consider the emission reduction benefits of new energy access to the system from the perspective of “low-carbon power”.
Since the cost of renewable energy generation is higher than the cost of conventional energy generation, incentive policies are essential in renewable energy generation expansion planning. To promote the development of clean energy, each country has adopted certain supportive policies, mainly of two kinds: one is to give certain subsidies to support, and the other is to promote through market-oriented trading incentives. The first policy is mainly realized in the form of subsidies or tax breaks. Helm and Mier (2021) studied the optimal subsidies and tax policies for renewable energy and storage energy. Martelli et al. (2020) proposed a renewable energy subsidy and carbon tax optimization method for multi-energy systems based on bilevel planning, and determined the optimal renewable energy subsidy and carbon tax for small-medium multi-energy systems. Masoumzadeh et al. (2020) proposed a novel interactive tax/subsidy incentive framework on both emission reduction and resource adequacy in competitive electricity markets. Wu et al. (2020) and Luo et al. (2021) studied the impact of government subsidies on renewable energy generation based on actual data in China.
Government subsidies are more common in the early stage of renewable energy development, and with the rapid development of renewable energy, government subsidy policy is not sustainable (Wu et al., 2020). The design of market-oriented carbon trading incentive mechanisms to promote the development of renewable energy has received more and more attention. Since carbon emissions are directly related to power generation, traditional research on power system carbon trading incentive mechanisms focuses on the power generation side. Tan et al. (2021) and Wang R. et al. (2022) have studied carbon trading incentive mechanisms for the expansion planing of new energy units on the power generation side. In recent years, with the in-depth study of demand-side response, some scholars have put forward the theory of carbon emission flow, then the carbon emission of loads can be quantitatively analyzed, so as to establish a carbon trading incentive mechanism on the load side. Feng and Zhou (2022) and Yan et al. (2023) have studied the carbon trading incentive mechanism on the load side. It can be seen that the current design of the carbon trading incentive mechanism is mainly for the generation side or the load side. However, in the power system, both generators and loads have the potential to reduce carbon emissions. Designing carbon trading incentive mechanism only on one side cannot fully stimulate the carbon reduction potential of both sides. Nan et al. (2022a); Nan et al. (2022b). also established two-side carbon trading mechanisms, but did not consider the effect of CCUS on carbon emission reduction. While as the current energy structure of the power system is still dominated by coal-fired power units with high carbon emissions, and the low-carbon operational potential of the integrated energy system cannot be fully tapped through carbon trading incentives alone. As a result, retrofit technologies such as Carbon Capture and Storage Utilization (CCUS) for high carbon emitting coal-fired units are receiving increasing attention.
CCUS technology is currently the only key technology that can realize the low-carbon use of fossil energy (Liu Z. X. et al., 2023; Liu E. et al., 2023). The Intergovernmental Panel on Climate Change (IPCC) Fifth Assessment Report concluded that if there is no CCUS, then the vast majority of climate routes will not be able to achieve the 1.5°C/2°C temperature control target (Li et al., 2022). Hence, research on CCUS has received increasing attention. Current research on CCUS mainly focuses on the analysis of investment cost. Yang et al. (2019) used the real option approach to compare the impacts of different subsidy schemes on the investment benefit of CCUS projects in China. Yao et al. (2023) analyzed the cost and benefit of applying CCUS to thermal power units. Gowd et al. (2023) analyzed the sustainable development of CCUS at the economic and policy insights. Liu S. et al. (2023) quantitatively evaluated the techno-economic feature and potential of CCUS in China Energy Group by using systematical source-sink matching and carbon reduction contribution methods. It can be seen that the existing studies mainly focus on the modeling, operation mechanism and investment benefit analysis of CCUS itself, and there are fewer studies on the quantitative analysis of CCUS to promote carbon emission reduction, and even fewer studies on the renewable energy expansion planning considering CCUS. At present, the studies on renewable energy expansion planning basically do not take into account the carbon emission reduction effect of CCUS, and there are no studies on the capacity planning of CCUS.
To make up for the shortcomings of the above studies, this paper proposes a bilateral carbon incentive (BCI) mechanism, which equally shares the responsibility of carbon emissions to the generation side and load side. Meanwhile, a bi-layer wind-CCUS-battery expansion stochastic planning framework is constructed. The main contributions are as follows:
1) A bi-layer wind-CCUS-battery expansion stochastic planning framework considering both wind and load uncertainties is built. The model co-plans the capacity of wind turbine generators (WTG), CCUS devices retrofitted to coal-fired units, and demand-side battery (DSB).
2) Based on the carbon emission flow theory, a bilateral step-type carbon incentive mechanism is proposed. The incentive mechanism takes into account the carbon responsibility of both the generating units and the loads to fully stimulate the carbon reduction potential of both the source and the load side.
3) The constructed bi-layer planning framework is transformed into a mixed integer linear programming problem. The model is solved by invoking the Gurobi optimization solver and the validity and superiority of the model is verified by case analysis.
The article is organized as follows: Section 2 presents the problem description. Section 3 describes uncertainty modeling, CCUS modeling and bilateral carbon incentive mechanism. Section 4 illustrates the proposed bi-layer stochastic planning framework. Section 5 demonstrates the case analysis. Finally, the work of this paper is summarized in Section 6.
2 Problem description
The schematic diagram of the system studied in this paper is shown in Figure 1, where the source side consists of coal-fired power plant and wind power plant, and the load side consists of loads and demand-side batteries. From the perspective of carbon emissions, coal-fired power plants emit large amounts of carbon dioxide through the combustion of coal, while some coal-fired power plants retrofitted with CCUS have reduced net carbon emissions because some of the carbon dioxide produced is absorbed. Wind power plants produce clean energy with no carbon emissions. According to the carbon emission flow theory, there is a dependency relationship between the carbon flow and power flow. Virtual carbon emission flows can be viewed as accompanying the power flow from the power plant through the electricity network to the consumer side. Thus, physically, the carbon emissions of the entire system are net emissions from the power plants and are not directly related to the users. However, in terms of carbon liability, demand-side consumption of electric energy drives the generation of carbon emissions from power plants. Therefore, both the demand side and the source side should share the responsibility for system carbon emissions.
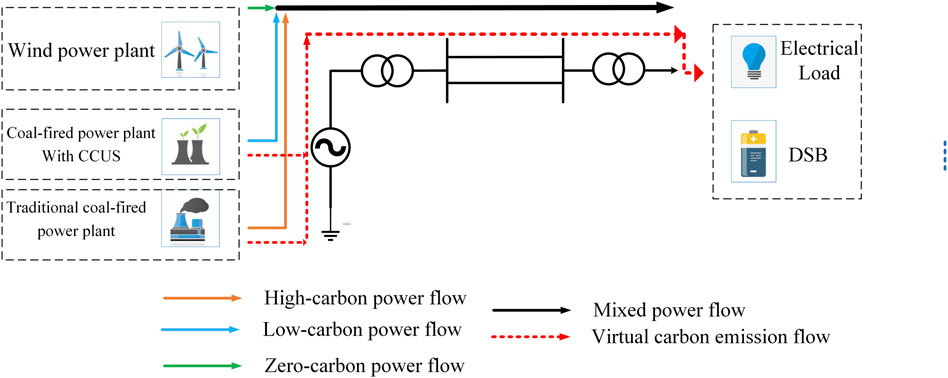
FIGURE 1. Wind-CCUS-battery expansion planning system structure diagram.
Based on the carbon emission flow theory, this paper shares the system carbon emission responsibility between the source side and the demand side, and constructs a bilateral carbon incentive mechanism. Then, this paper simultaneously considers wind power and load uncertainties, and a bi-layer stochastic planning framework with the proposed bilateral carbon incentive mechanism is constructed to determine the wind turbine and CCUS device capacities at the source side, and the battery storage capacities at the load side. The main challenges faced in the research of this paper (Meinshausen et al., 2022): wind and load uncertainty modeling, and CCUS modeling (Ostberg et al., 2018); bilateral carbon incentive mechanism construction (Wang Y. et al., 2022); capacity synergistic planning of wind turbines, CCUS devices, and demand-side batteries. These are elaborated upon subsequently.
3 Modeling methodology
3.1 Stochastic uncertainty model of wind power and load
The output of generators is adjusted in real time according to the load demand, and the output of wind turbines is subject to the change of wind speed. Since both wind speed and load demand have a large uncertainty, to study the capacity planning of the wind turbine, demand-side energy storage and CCUS, it is necessary to model the uncertainty of wind speed and load.
3.1.1 Stochastic fuzzy modelling of wind power
Since wind speed is usually affected by season, temperature, atmosphere, geographical location and other natural laws with strong randomness, the probability distribution parameters of wind speed are fuzzy due to the restriction of finite wind speed statistics. To effectively solve the problem that the traditional wind speed uncertainty model is unable to take into account the coexistence of randomness and fuzzy, a stochastic fuzzy uncertainty model of daily wind speed is adopted in this paper (Ma Rui et al., 2015; Chen et al., 2021). The shape parameter
Then invert (Wang Y. et al., 2022) to obtain the value of the stochastic fuzzy variable wind speed.
After obtaining the value of wind speed
where
3.1.2 Uncertainty modelling of power load
For load modeling, typical daily load curves are usually used in conventional planning optimization models without considering the load uncertainty. To model load uncertainty more accurately, random load deviations that satisfy the normal distribution are taken into account. The stochastic power demand curve can be obtained from Eq. 6.
where
3.1.3 Scenario generation
Scenario-based analysis is a common method to solve the uncertainty problem, including two steps: scenario generation and scenario reduction. According to the chance measure distribution function of wind power and probability distribution function of load deviations, scenarios can be generated by stochastic simulation. To improve the solving efficiency, the backward scenario reduction is adopted to obtain representative scenarios. The specific steps of the scenario generation and reduction methods adopted in this paper are as follows:
1) Scenario generation
a) Based on Latin hypercube sampling and affiliation functions as (Meinshausen et al., 2022) and (Ostberg et al., 2018), randomly obtain N sets of stochastic fuzzy variables
b) By Latin hypercubic sampling, F(v) that satisfies a Weibull distribution function is sampled T times between [0,1].
c) Based on the inverse transformation shown as Eq. 5, the wind speeds at T different moments in N scenarios are obtained, which is denoted as
2) Scenario reduction
The backward scenario reduction method is adopted in this paper to obtain the most representative fewer scenarios. According to the N scenarios of wind power obtained in first step, the Euclidean distances between each scenario can be calculated as:
The probabilistic distance between scenarios Si and Sj is:
a) Calculate the sum of probability distances between each scenario and the remaining scenarios. The sum of probability distances between scenario i and the set of remaining scenarios J is as follows:
Then find the scenario in which the probability distance sum is the smallest, denoted as
b) Find the scenario with the smallest Euclidean distance from scenario
c) Eliminate the scenario
d) Repeat the above steps and keep iteratively eliminating the scenarios until the number of scenarios satisfying the requirements, and a new set of scenarios
Using the same method described above, the corresponding loaded scenes can be obtained.
3.2 CCUS modeling
CCUS device can capture and separate CO2 from the flue gas emitted by coal power units, including three links: CO2 capture, utilization and storage, is currently the key technology to achieve low-carbon coal power units. Although the current cost of CCUS technology is very high, it can be foreseen that with the large-scale application in the future, the cost of the CCUS device will be reduced, which can significantly reduce the overall emission reduction costs of power plants (Liu Z. X. et al., 2023; Han et al., 2023). To this end, this paper analyzes the emission reduction effect of CCUS using the post-combustion capture method installed in traditional thermal power plants. This paper focuses on the carbon capture link, the principle of which is shown as Figure 2:
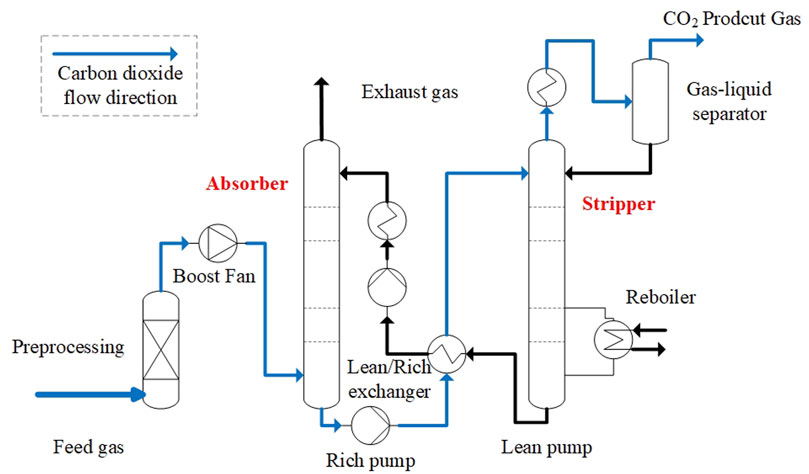
FIGURE 2. CCUS model diagram.
The mathematical model is as follows:
1) The actual carbon emissions from thermal power units at moment t are:
where
2) The carbon dioxide content in the lean-rich liquid storage at time t is:
where
3) Power consumption of the CCUS device at moment t:
This equation represents the power consumed by the CCUS in relation to the amount of carbon in and out at a given moment;
4) The net power output of the thermal unit to the system at time t is:
5) The cost of carbon capture equipment deployment is:
where
3.3 Bilateral carbon incentive trading mechanisms
3.3.1 Carbon flow theory
In the power system, the carbon emission is emitted in the generation side along with the electric power generation. However, the production of electric power is caused by power consumption at the load side. Therefore, in a sense, the load is the source of carbon emissions from generating units. In order to incentivize load-side users to consume more low-carbon electricity, it is necessary to let the users understand the composition of the sources of electricity they consume and the corresponding carbon emission responsibility. For this purpose, it is necessary to find the relationship between the carbon emissions and the power flow in the power system. This problem can be solved by the carbon emission flow theory (Wang C. et al., 2022; Liu et al., 2022; Huang et al., 2023), which establishes the correspondence between the carbon emission responsibilities and the flow of each bus and branch in the power system, as follows:
According to the theory of flow tracing, each load is supplied by all the power sources in the network based on the principle of “proportional sharing”, and then we can get the power contribution of any generating unit to any outgoing line load. For carbon emission flow analysis as well, the carbon emission flow of each incoming line of the node is uniformly mixed at the node, and the carbon emission flowing through each outgoing line is a proportional mix of each incoming line with equal branch carbon intensity. Thus, the power contribution from any generating unit to any load can be obtained by constantly tracing the power flow, as shown in Eq. 18).
where
By the same token, based on the analogous relationship between carbon flow rate in carbon emission flow analysis and active power in flow analysis, the relationship between generator carbon flow rate and load carbon flow rate can be obtained:
Therefore, by calculating the carbon emission responsibility of each generator, the carbon emission responsibility of each load can be obtained by utilizing Eq. 22. The carbon emission responsibility of generators is calculated as Eq. 24.
As Eq. 24 shows, the carbon emission responsibility of generators is equal to the carbon emission factor of the generating unit multiplied by the output of the generating unit. In this paper, since some thermal power units are installed with CCUS equipment, the carbon emissions of thermal power units are net carbon dioxide emissions, which can be calculated by Eq. 11. Because the source and load side play equally important roles in carbon emission reduction under the bilateral carbon incentive mechanism, the carbon emission responsibility of the source and load side is shared equally in this paper, i.e., the source and load side each share 50% of the carbon emission responsibility.
To further characterize the carbon emission of each bus in the system, the bus carbon flow rate can be obtained through Eq. 25, then the carbon emission intensity of each node is shown in Eq. 26.
3.3.2 Carbon emission allowance at source and load side
To get the carbon emission quota for the source and load side, this paper firstly obtains original carbon emissions through economic dispatch after planning. According to the principle of equalization, the source side and the load side share 50% of the carbon emission respectively. Then obtains the carbon emissions
where
3.3.3 Bilateral stepped carbon incentive mechanism
This paper proposes a double-end stepped carbon incentive mechanism. Compared with the traditional single-end carbon incentive mechanism, the proposed double-end stepped carbon incentive mechanism shares the carbon emissions equally between the source side and the load side, and carry out carbon incentive at both sides. The details are as follows: firstly, the net carbon emission of each generating unit is calculated under the planning model, and the responsibility of carbon emission is equally shared by the source side and load side. Then, based on the carbon emission flow theory, the carbon emission responsibility of each load is obtained to participate in the carbon trading market. Finally, the carbon emission of the source side and load side participate in the stepped carbon incentive respectively. Under the stepped carbon incentive mechanism, the carbon emissions trading volume is divided into multiple intervals. The more carbon emission responsibility, the higher the corresponding carbon incentive price. When the carbon emission responsibility is lower than the free carbon allowance, the power plant can make a profit in the carbon trading market; When the carbon emission responsibility is higher than the free carbon allowance, the power plant will pay for the carbon incentive cost. The carbon incentive cost of a unit or load is calculated as follows:
where
4 Two-layer stochastic source-load expansion planning model
The planning problem studied in this paper involves both wind power capacity and CCUS capacity expansion planning at the source side and energy storage capacity expansion planning at the load side, and the connection between the source end and the load end is established through the carbon emission flow theory. To solve such planning problems, a two-layer stochastic source-load expansion planning model is proposed in this paper. The two-layer cooperative planning is used to achieve the optimal arrangement of the capacity of wind turbines, CCUS and energy storage. The source-side optimization results are obtained through the optimization of the upper layer, and then through the carbon emission flow theory, the carbon emission responsibility of the load side is obtained, which in turn participates in the lower layer optimization model. The details are described as follows: the upper layer optimizes the installed capacity of wind power and CCUS with the objective of minimizing the total cost of wind power investment cost, CCUS investment cost, power generation cost and carbon incentive cost at the source side. The actual carbon emission of each generator at the source side is also obtained after the optimization of the upper layer. Then the carbon emission intensities of the load is determined based on the carbon emission flow theory, which is then entered into the lower layer. The lower layer aims to minimize the total cost of energy storage investment cost, power purchase cost and load-side carbon incentive cost, obtains the optimal energy storage capacity, and returns the charging and discharging power of the energy storage device as the load demand response to the upper layer. Then the next loop of optimization is carried out in the upper layer. Finally, the optimal planning results are obtained through repeated optimization of the upper and lower layers until the results converge. The convergence condition of the proposed model is that the difference between the demand responses after two consecutive optimizations is smaller enough and small than a predefined threshold parameter. Based on the two-layer stochastic source-load expansion planning model developed in this paper, the economic operation of the whole system and carbon emission reduction targets can be achieved by optimally configure wind power, CCUS and energy storage capacities.
4.1 Upper layer: source-side wind turbine and, CCUS capacity planning model
4.1.1 Objective function
The upper layer is mainly to optimize the wind power capacity and CCUS capacity at the source end. According to Section 3.1.1, it can be seen that the wind turbine at the source end is a stochastic fuzzy uncertain model, for this reason, the upper layer optimization belongs to the stochastic optimization model, which is divided into two phases: tactical layer and operational layer. The upper layer takes the total economic cost at the source side as the objective function, including the investment cost of wind power, the investment cost of CCUS, and the expected value of power generation cost and carbon incentive cost. The decision variables of the tactical layer are the capacities of the WTG and CCUS. The decision variables of the operational layer are the outputs of each generator, and the objective is to minimize the expected value of power generation cost and carbon incentive cost. The complete objective function of the upper level can be expressed as Eqs 29, 30.
where
4.1.2 Constraints
In this paper, the DC power flow model is adopted to model the power system constraints:
1) Power flow constraints
where
2) Generator output constraints
where
3) Phase angle constraints
where
4) Wind power capacity constraints
5) CCUS operational constraints
a) Carbon capture equipment capacity constraints
b) Incoming and outgoing carbon constraints
where
c) Carbon capture rate limitations
where the carbon capture rate
4.2 Lower level: load-side energy storage capacity planning model
4.2.1 Objective function
The lower layer is mainly to plan the energy storage capacity at the load side. According to the previous analysis, it is known that the load also has stochastic uncertainty, so like the source-side planning, the planning of the load side is also divided into two stage: tactical level and operational level. The objective function is to minimize the total economic cost at the load side, which includes the investment cost of energy storage, the expected value of power purchase cost and carbon incentive cost at the load side. The decision variables of the tactical layer are the energy storage capacity configured for each load. The decision variables of the operational layer are the charging and discharging power of the storage device, and the objective is to minimize the expected value of power purchase cost and carbon incentive cost. The complete objective function of the lower level can be expressed as Eqs 42, 43.
where
4.2.2 Constraints
1) energy storage state of charge constraints
where
2) Upper and lower limits of charge/discharge rate constraints
where
3) Charging and discharging state constraints
The energy storage device cannot be in the charging state and the discharging state at the same time. The constraints can be expressed as the following equations, which are nonlinear constraints that need to be linearized by big-M method (Xue et al., 2022).
4) The ratio of rated capacity to rated power constraints
4.3 Optimization procedure for bi-layer co-optimization
Sections 4.1 and 4.2 introduce the optimization models at the source and load sides, respectively. The bi-layer co-optimization optimization procedure of both two sides is elaborated in this section as follows:
Step 1: Initial parameter setting: Firstly, set the initial system parameters, and then generate the wind power load scenario through the methods introduced in 3.1.1 and 3.1.2.
Step 2: Upper layer planning model: source-side wind power capacity and CCUS capacity optimization. Based on the planning model introduced in Section 4.1, the optimized capacities of wind turbines and CCUS are obtained, and the initial carbon emission profile and net carbon emission profile of each generator at the source side are calculated.
Step 3: Load bus carbon intensity calculation: Based on the step 2, the bus carbon intensity of each load can be calculated according to the carbon emission flow theory introduced in Section 3.3.1.
Step 4: Lower level planning model: Through the planning model introduced in Section 4.2, the optimized capacity of the load-side energy storage device is obtained, and the charging and discharging quantity situation of the energy storage device is calculated.
Step 5: Demand-side response: The energy storage charging and discharging amount obtained in step 4 is taken as the demand-side response and returned to the upper optimization model in step 2, and go to the next loop.
Step 6: Iterative optimization: The convergence condition of the optimization is that the change in the demand-side response between two times is less than a given threshold. Then the optimization procedure is terminated, and the termination condition is as shown in Eq. 52.
Step7: Output the final optimal planning results.
The flowchart of the whole optimization model is shown in Figure 3.

FIGURE 3. Bi-layer co-optimization framework.
5 CASE studies
In this section, cases with different carbon incentive mechanisms and working condition were tested on the IEEE 24 bus power system for validity and advantage. The wind-CCUS-battery power system planning framework with source-load bilateral carbon incentive mechanism was optimized on the MATLAB and YALMIP platform with Gurobi solver.
5.1 Basic parameters
The modified IEEE 24-bus power system is shown in Figure 4 (Zimmerman et al., 2011). The modified power system contains 10 generators, 24 buses, 34 transmission branches and 12 power loads, in which including seven coal-fired power generators and three expansion planning wind turbine generators. Besides, the expansion planning CCUS will be placed at three predetermined coal-fired power plants, and DSB are placed at each load bus. The predetermined positions of WTG and CCUS are shown in Figure 4. The parameters for each device are set as follows.
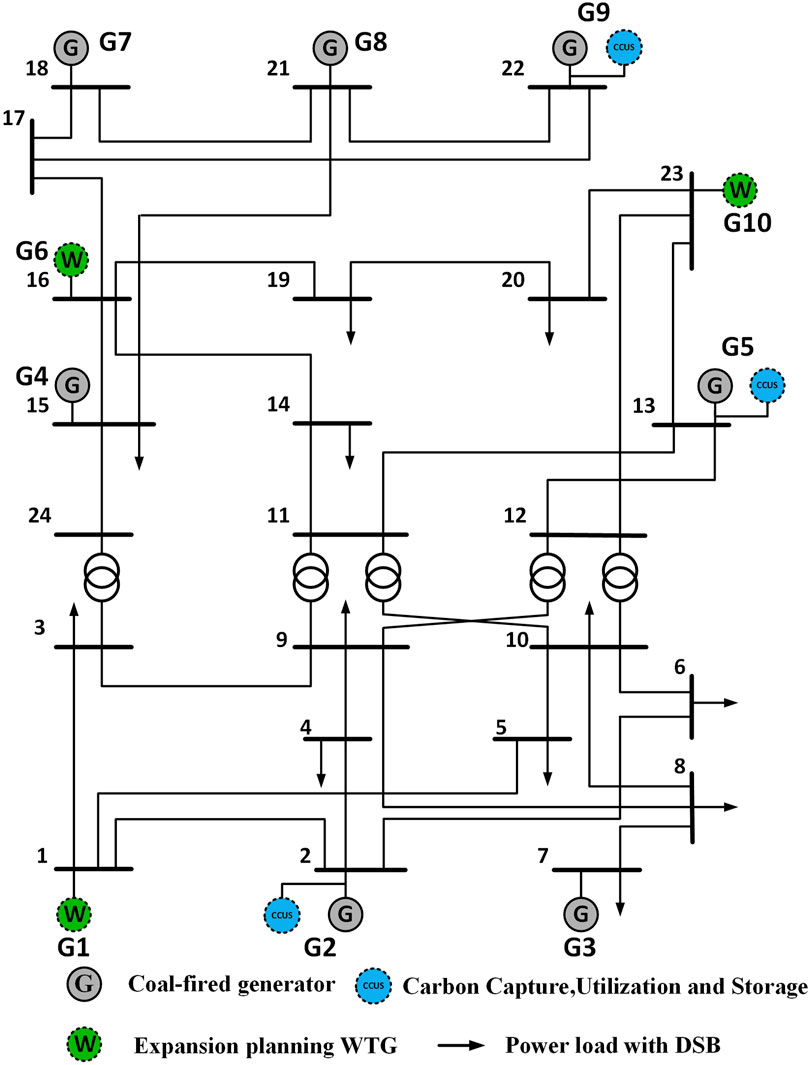
FIGURE 4. The modified IEEE 24-bus power system.
5.1.1 Equipment parameters
The detailed parameters of each generator such as generator type, capacity, cost coefficient, can carbon emission intensity are shown in Table 1 (Zimmerman et al., 2011; Nan et al., 2022a). The parameters of the WTG, CCUS and DSB to be planed are shown in Tables 2 (Mei et al., 2021; Zhong et al., 2021; Sun et al., 2022b; Gowd et al., 2023).
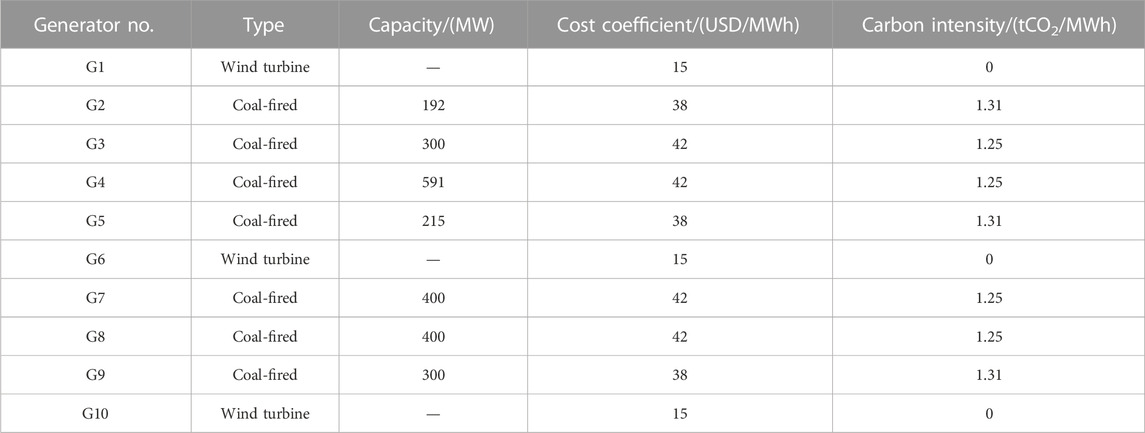
TABLE 1. Parameters of each generator.
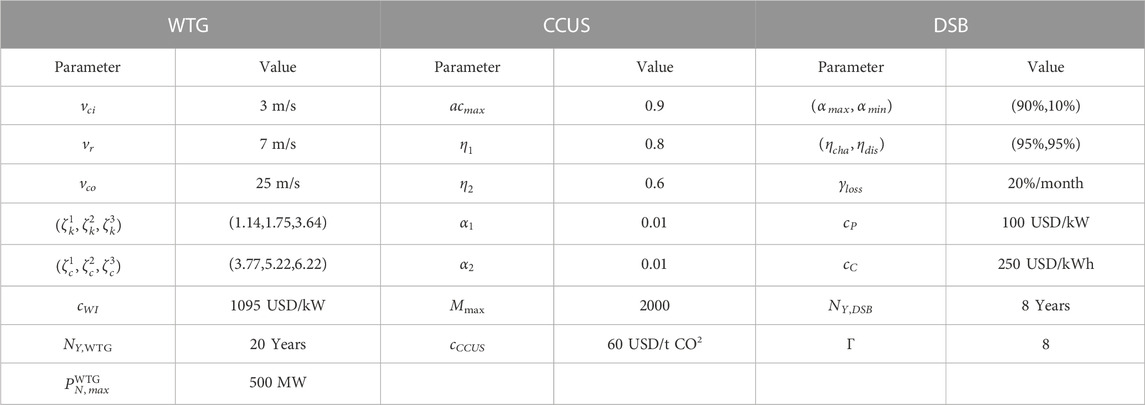
TABLE 2. Parameters of the WTG, CCUS and DSB to be planned.
5.1.2 Operating parameters
As described in Section 3, the wind power output can be obtained by wind speed, and the wind speed can be simulated by stochastic fuzzy modelling and scenario generation method. It is known that in order to solve the computational time and efficiency problems caused by large-scale scenarios, the scenario reduction approach is used to obtain several typical scenarios so as to achieve the effect of reducing the computational complexity. In the simulation analysis of this paper, the target number of scenes is set to 5 in order to reduce the computation time. The number of target scenes can also be set to other values as needed. Thus we can simulate the wind speed variation curve for 1 day by using the method described earlier, as shown in Figure 5A. Then the power output curve can be obtained, as shown in Figure 5B. The power load deviations before and after the scenario reduction can be simulated by applying the same method, as shown in Figure 6A. The per-unit power load curves of reduced scenarios are shown in Figure 6B. Table 3 represents the benchmark power for all loads.
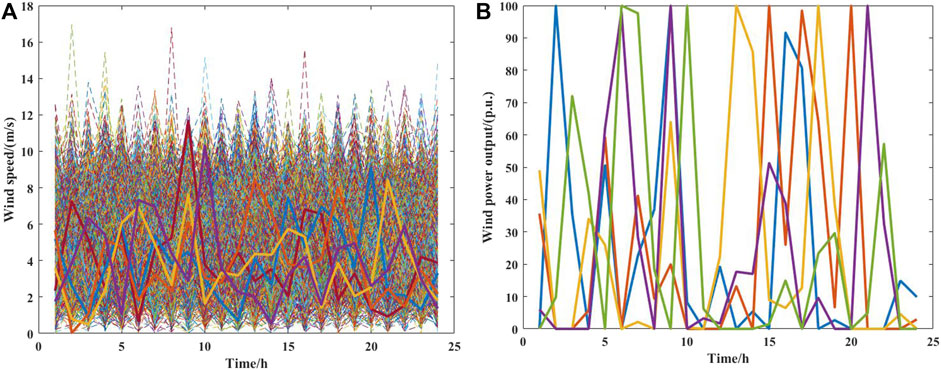
FIGURE 5. Wind speed simulation results. (A) the wind speed variation before and after scenario for one day. (B) the wind power output of reduced scenarios for one day.
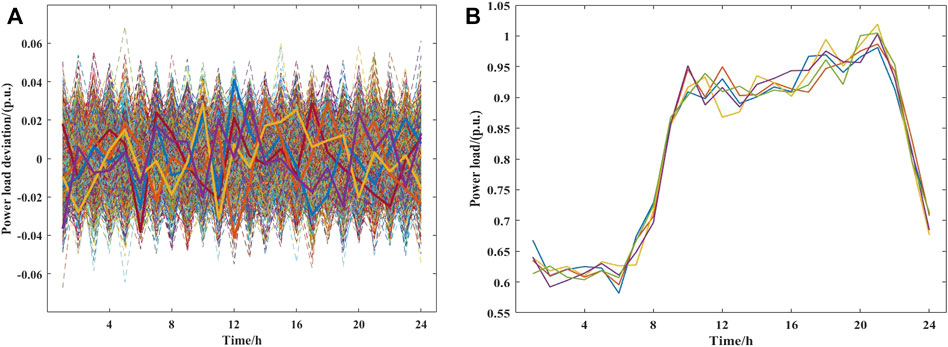
FIGURE 6. Power load simulation results.
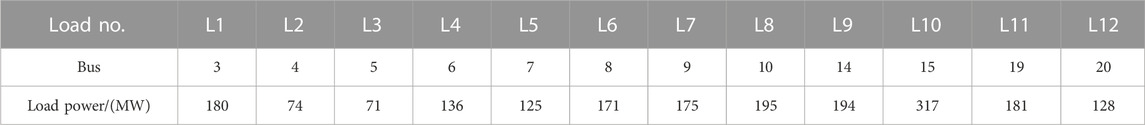
TABLE 3. The benchmark data of each power load.
5.1.3 Time-of-use tariffs and carbon incentive parameters
The time-of-use tariffs and parameters of the proposed bilateral carbon incentive (BCI) mechanism are shown in Table 4. Besides, the carbon allowances allocated for source side can obtained by the initial economic dispatch results, and load-side carbon allowances can be obtained based on carbon emission flow theory, are shown in Table 5.
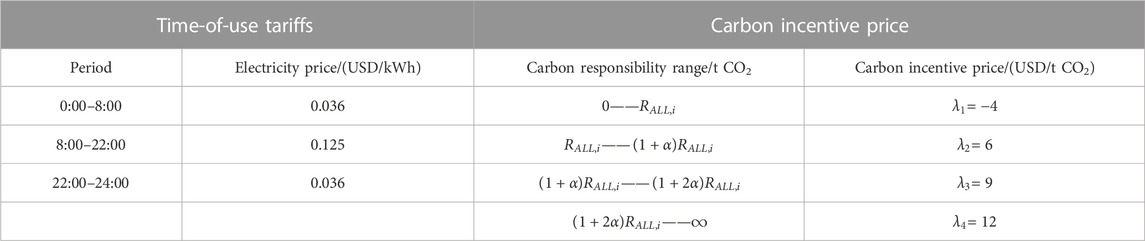
TABLE 4. Time-of-use tariffs and parameters of the proposed BCI mechanism.

TABLE 5. The carbon allowances allocated for source side and load side.
5.2 Analysis of results under different carbon incentive mechanisms
To illustrate the effectiveness of the bilateral carbon incentive (BCI) mechanism proposed in this paper, this paper compares and analyzes the carbon emission reduction under three incentive mechanisms, which are source-load bilateral carbon incentive mechanism (source-load BCI), source-side unilateral carbon incentive mechanism (source-side UCI), and load-side unilateral carbon incentive mechanism (load-side UCI), as follows:
Case 1: source-load BCI, i.e., the carbon emissions responsibility of the generators is shared equally by the power generation side and the load side, with each side bearing 50% of the carbon emissions responsibility (Nan et al., 2022a; Nan et al., 2022b).
Case 2: source-side UCI, i.e., the carbon emissions responsibility of the generators is fully borne by the power generation side (Tan et al., 2021; Wang et al., 2022b).
Case 3: load-side UCI, i.e., the responsibility of carbon emissions from generators is borne by users (Feng and Zhou, 2022; Yan et al., 2023).
The simulations under three incentive mechanisms are carried out to obtain the system planning results, and the specific analysis is shown in the following sections.
5.2.1 Analysis of wind power, CCUS, and energy storage planning capacity
The results of capacity planning for wind turbines, energy storage and CCUS in three cases are shown in Table 6; Figure 7.
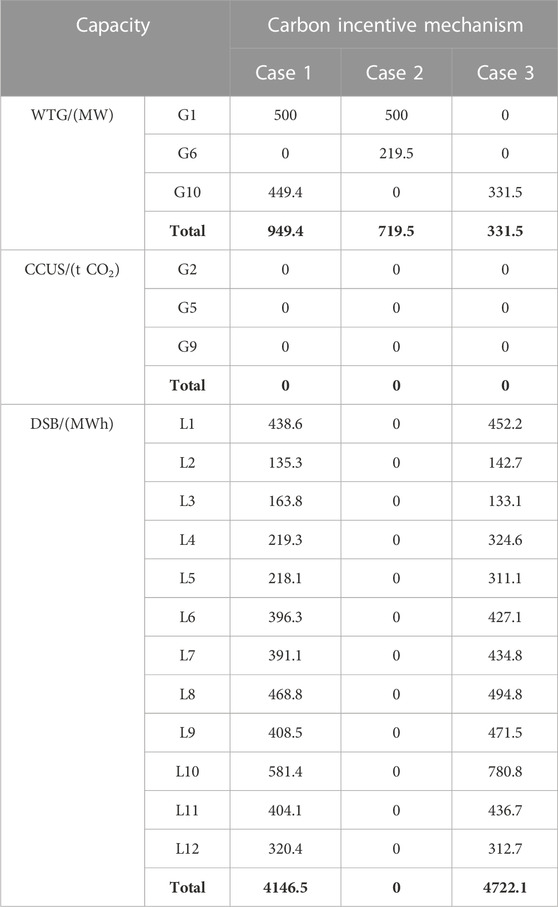
TABLE 6. Results of WTG, CCUS and DSB capacity planning in three different carbon incentive mechanisms.
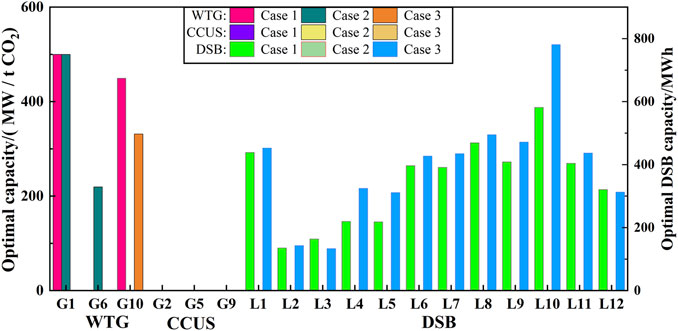
FIGURE 7. Capacity planning results of WTG, CCUS and DSB in three cases.
The planning capacity of CCUS under the three incentive mechanisms is 0. This is mainly because the current investment cost of CCUS is too large, and the carbon emission reduction benefit brought by installing CCUS is not enough to offset the investment cost. This is also the common problem in the actual project, i.e., under the existing technical conditions, after the enterprise invests a huge amount of money on CCUS, it cannot realize the benefit of emission reduction. This problem is expected to be solved gradually with the progress of CCUS technology, large-scale application and carbon incentive price rising in the future.
The planning capacity of wind turbines under Case 1 is the largest, and the total planning capacity of wind power reaches 949.4 MW. Unit 1 reaches the maximum capacity, 500 MW. The capacity of load-side energy storage devices reaches 4,146.5 MWh. The planning capacity of load-side energy storage under Case 2 is all 0, because at this time, all the responsibility for the carbon emissions of generating units is borne by the source side. There is no incentive for load-side carbon reduction, so installing energy storage devices will not only cannot reduce the carbon emission cost, but also increase the additional investment cost. Therefore, no energy storage device is installed at the load side under this incentive mechanism. For the capacity planning of wind turbines, since the carbon emission incentive under Case 2 is at the source side, carbon emission reduction can be promoted by optimizing the configuration of wind turbines. The total planning capacity of wind turbines at this time reaches 719.5 MW. Under Case 3, the carbon emission reduction of wind turbines at the source side needs to be converted to the load side through the carbon emission flow theory to participate in carbon trading, and the incentive effect is not as good as that of direct incentives on the source side. Therefore, the planning capacity of wind turbines on the source side is also lower than that of Cases 1 and 2, and the planning capacity of the wind turbines is only 331.5 MW. However, when the load-side incentive is applied, the carbon emission reduction effect of the energy storage device can be fully utilized through the demand response, and the planning capacity of the energy storage device at the load-side at this time is the largest, which is 4,722.1 MWh.
In summary, the analysis shows that, under the source-side UCI mechanism, it can motivate carbon emission reduction of source-side wind turbines, But it is not effective for stimulating load side energy storage configuration. Under the load-side UCI mechanism, it can promote load-side energy storage configuration and carbon reduction, but cannot incentivize the carbon emission reduction of source-side wind turbines. Under the source-load BCI incentive mechanism, the source-side and load-side share the total carbon emissions of the generator equally and participate in carbon incentives, which can fully utilize the roles of wind turbines and energy storage.
5.2.2 Analysis of carbon reduction benefits
Further comparing the investment costs and carbon emissions under three cases, as shown in Table 7 and Figure 8, it can be seen that the total system investment costs do not differ much under three cases, The total cost on the source side includes the installed cost of wind turbines and,CCUS, and daily operation cost which is composed of the power generation cost and carbon incentive cost. The total cost on the load side includes the investment cost of the energy storage and the daily operation cost, which is composed of electricity purchasing cost and carbon incentive cost. Under three incentive mechanisms, the carbon emission reduction effect of Case 1 is the best, with a daily reduction of 6.428×10³ tCO2 and the smallest daily cost of the system, which is 5.2326×10⁶ USD. The carbon emission reduction effect of Case 2 is the second best, with a carbon emission reduction and daily economic cost of 4.987×10³ tCO2 and 5.2411×10⁶ USD, respectively. The carbon emission reduction effect of Case 3 is the worst, with a carbon emission reduction and daily economic cost of 1.911×10³ tCO2 and 5.2691×10⁶ USD, respectively. Under the load-side carbon incentive mechanism of Case 3, because the carbon emission reduction only origins from demand response, the total amount of carbon emission reduction is much less than that of Cases 1 and 2. The carbon emission intensity on each bus is shown in Figure 9.
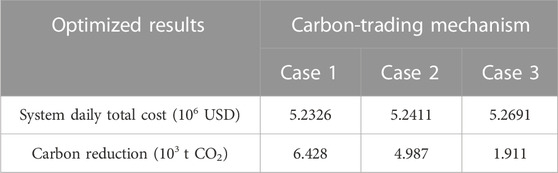
TABLE 7. Investment costs and carbon reduction of three cases.
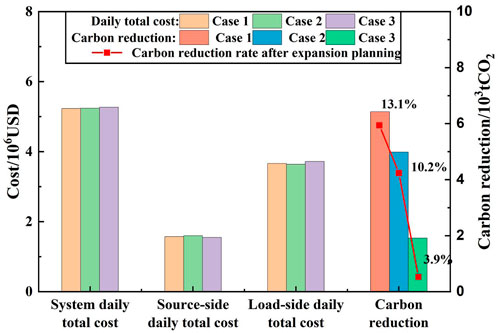
FIGURE 8. Optimized system daily total costs and carbon reduction in three cases.
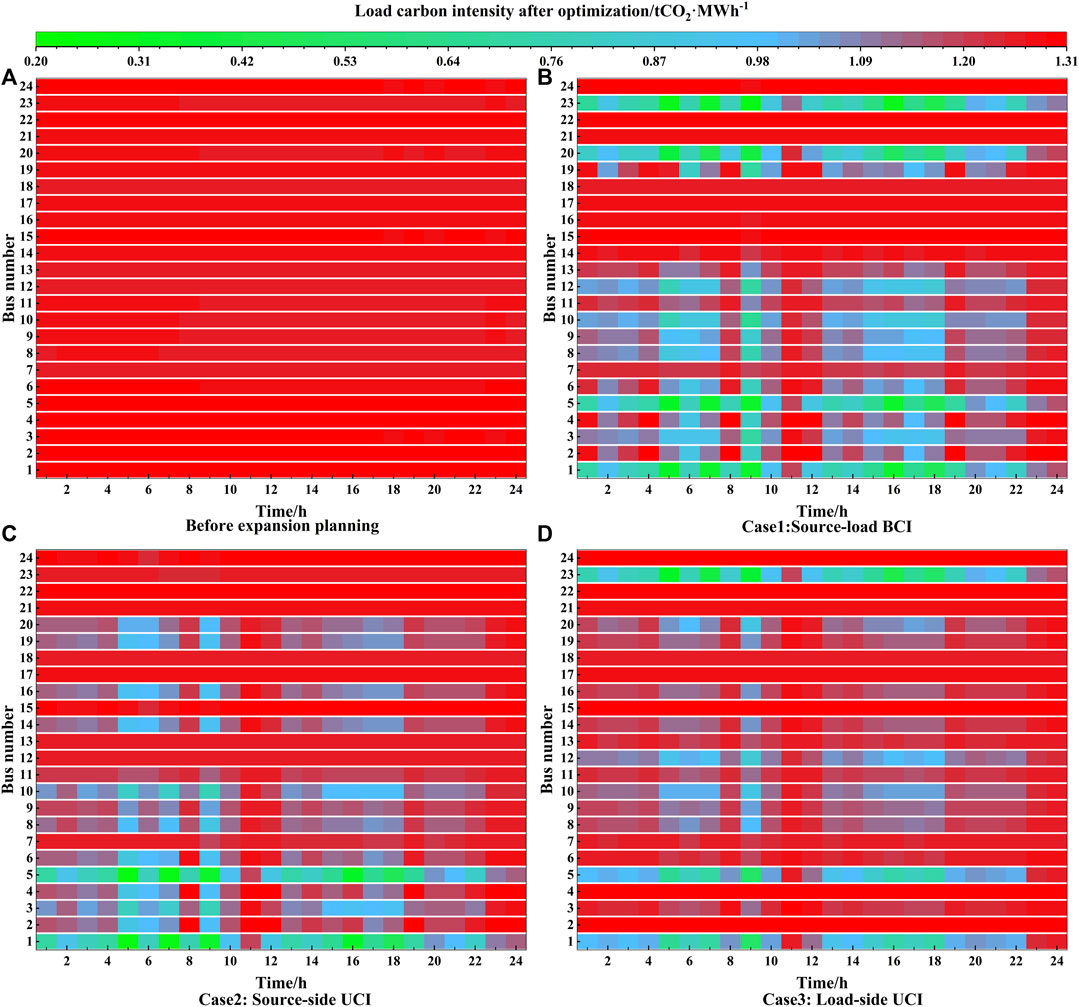
FIGURE 9. Bus carbon intensity before and after the expansion planning. (A) The carbon intensity before expansion planning. (B) The carbon intensity in case1 with source-load BCI. (C) The carbon intensity in case2 with source-side UCI. (D) The carbon intensity in case3 with load-side UCI.
In summary, under the existing technical conditions, due to the high investment cost of CCUS, the source-load BCI mechanism has obvious carbon emission reduction effect compared with the traditional single-end carbon incentive mechanism. The source-load BCI mechanism can better play the role of carbon incentives for both the source side and the load side, and promote the improvement of the output structure of the power generation side, wind consumption and carbon-oriented demand response.
5.2.3 Analysis of the impact of CCUS costs on carbon emission reduction
According to the previous analysis, it can be seen that there is no economic benefit in building CCUS due to the huge investment cost of CCUS at this stage. However, with the future technological progress and further large-scale popularization of CCUS, it is believed that the cost of CCUS will gradually decrease. In order to further analyze the carbon emission reduction effect of CCUS on the power system, this paper further analyzes the effect of each carbon incentive mechanism under different carbon capture cost. The unit carbon capture investment cost of CCUS is set to different values from 10USD/t∼110USD/t CO2, and the capacity expansion planning is carried out under different carbon incentive mechanisms. According to the previous analysis, under the load-side BCI mechanism, the source side does not bear the responsibility of carbon emission, so adding CCUS at the source side will not benefit from carbon incentive, but increase the investment cost at the source side, leading to the non-configuration of CCUS at this time. For this reason, in the analysis of the impact of CCUS cost on carbon emission reduction, we only focus on the two cases of the source-side carbon incentive and the double-side carbon incentive, i.e., Case 1 and Case 2. The total economic cost of the system and carbon emission reduction under different unit CCUS investment costs are shown in Figure 10.
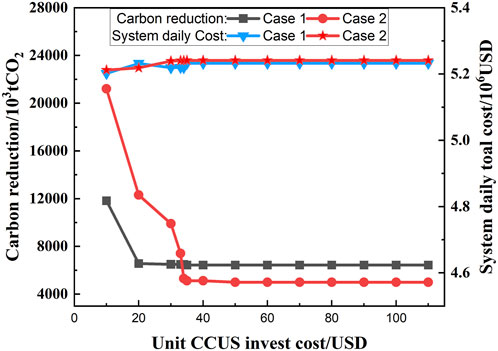
FIGURE 10. Carbon reduction and system daily total cost with different CCUS invest in the two different carbon incentive mechanisms.
It can be seen that when the unit investment cost of CCUS is more than 35USD/t CO2, Case 1 has a better carbon emission reduction effect than Case 2, which is mainly due to the fact that at this time, the investment cost of carbon capture is too high, and the benefits of carbon incentives are not enough to compensate for the cost of the investment, as analyzed in Section 5.2.1.
When the unit investment cost of CCUS is less than 35USD/tCO2, Case 2 has a better carbon emission reduction effect than Case 1. This is because when the cost of carbon capture decreases, due to the good carbon capture effect of the CCUS unit, deep emission reduction can be achieved. Compared to case 1, the carbon emission responsibility under Case 2 is fully borne by the source-side, leading to more configuration of CCUS and a better carbon emission reduction effect. To further analyze the emission reduction effect of CCUS, the carbon emission reduction result is simulated when the unit investment cost of CCUS is 20USD/tCO2, as shown in Figure 11. It shows that the daily carbon emission can be reduced by 11.312 × 10³t CO2 under Case 2, with a carbon emission reduction rate of 23.22%, whereas the daily carbon reduction under Case 1 is 6.558 × 10³t CO2, with a carbon emission reduction rate reaches 13.46%. The total daily cost of Case 1 and Case 2 is basically the same, which shows that the carbon emission reduction effect of the source-side BCI mechanism is better when the unit investment cost of CCUS is relatively low. Figure 12 shows the carbon emission intensity of each bus when unit investment cost of CCUS is 20USD/tCO2, which denotes that the carbon reduction effect of Case 2 is more obvious.
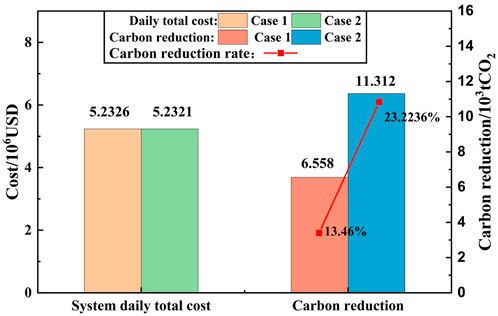
FIGURE 11. Optimized system daily total costs and carbon reduction in case 1 and 2.
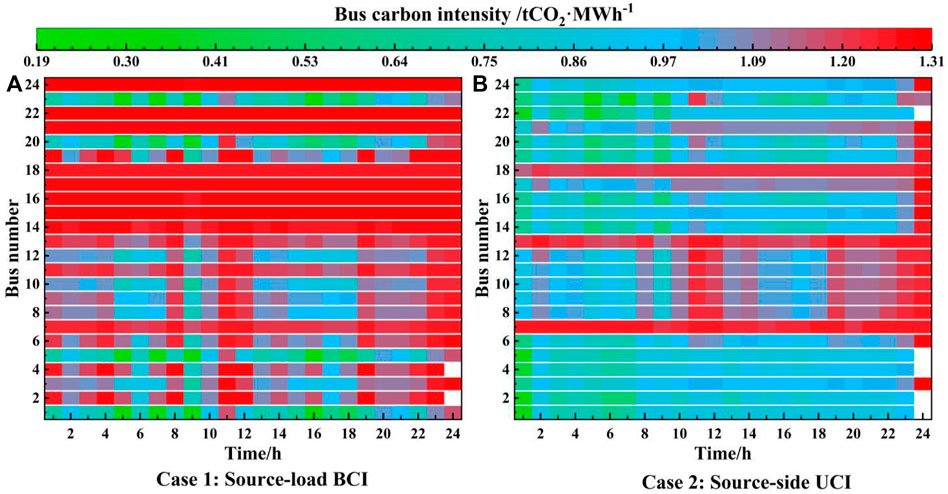
FIGURE 12. Bus carbon intensity in case 1, 2. (A) The carbon intensity in case1 with source-load BCI. (B) The carbon intensity in case2 with source-side UCI.
6 Conclusion
This paper established a source-load bilateral carbon incentive (Source-load BCI) mechanism for wind-CCUS-battery power systems based on the carbon emission flow theory to motivate the capacity planning of WTG, CCUS and DSB. A bi-layer wind-CCUS-battery expansion stochastic planning framework considering wind and load uncertainties was constructed. Simulation analysis was conducted to compare the carbon emission benefits under three different incentive mechanisms, and the impact of CCUS costs on carbon emission reductions from different carbon incentive mechanisms was analyzed. In short, the main conclusions can be obtained as follows:
1) Under the existing technology conditions, even with the carbon incentive mechanism, it is not enough to incentivize CCUS investment planning due to the high investment cost of CCUS.
2) Without installing CCUS, the bilateral carbon incentive mechanism is more conducive to promoting system carbon reduction than the traditional unilateral carbon incentive mechanism. The carbon reduction rate after expansion planning under source-load BCI is 13.1%, which has superiority over the other two UCT mechanisms, with the carbon reduction rate of 10.2% (source-side UCI) and 3.9% (load-side UCI),respectively.Bilateral carbon incentives can promote source-side investment in green energy and load-side investment in energy storage equipment to regulate electricity demand, thus stimulating the potential for carbon reduction at both the source and load side.
3) In the future, as the CCUS technology matures and the investment cost of CCUS decreases, CCUS will have the possibility of large-scale development and application. The carbon emission reduction rate under source-side carbon incentive mechanism is 23.22%, which is much higer than the source-load carbon incentive mechanism, with the carbon emission reduction rate of 13.46%. At this time, the system using source-side carbon incentive mechanism can reduce carbon more significantly than bilateral carbon incentive mechanism, while the difference in total daily cost between the two is not significant.
This paper analyzes the results of new energy expansion planning under three different carbon trading incentive mechanisms, and analyzes the planning results under different CCUS unit investment costs. However, the installation of CCUS is not only related to its own investment cost, but also related to the carbon price in carbon trading, when the carbon price is high enough, it can also promote the installation of CCUS so as to benefit from carbon emission reduction, so in the future, we can also analyze the impact of carbon price, carbon tax and other perspectives on the planning capacity of CCUS, so as to better improve the carbon trading mechanism, and to promote the development of the power system of decarbonization.
Data availability statement
The original contributions presented in the study are included in the article/Supplementary material, further inquiries can be directed to the corresponding authors.
Author contributions
XD: Data curation, Formal Analysis, Investigation, Methodology, Project administration, Software, Writing–original draft, Writing–review and editing,Supervision. JN: Data curation, Formal Analysis, Writing–review and editing. JF: Software, Writing–review and editing. XG: Formal Analysis, Project administration, Writing–review and editing. HZ: Conceptualization,Supervision, Validation, Writing–review and editing. WT: Supervision,Writing–review and editing.
Funding
The author(s) declare that no financial support was received for the research, authorship, and/or publication of this article.
Conflict of interest
Author XG was employed by Guangdong Power Grid Corporation, China Southern Power Grid Company Limited.
The remaining authors declare that the research was conducted in the absence of any commercial or financial relationships that could be construed as a potential conflict of interest.
Publisher’s note
All claims expressed in this article are solely those of the authors and do not necessarily represent those of their affiliated organizations, or those of the publisher, the editors and the reviewers. Any product that may be evaluated in this article, or claim that may be made by its manufacturer, is not guaranteed or endorsed by the publisher.
References
Algarni, A. S., Suryanarayanan, S., Siegel, H. J., and Maciejewski, A. A. (2021). Combined impact of demand response aggregators and carbon taxation on emissions reduction in electric power systems. IEEE Trans. Smart Grid 12 (2), 1825–1827. doi:10.1109/tsg.2020.3023586
Chen, C., Wu, X., Li, Y., Zhu, X., Li, Z., Ma, J., et al. (2021). Distributionally robust day-ahead scheduling of park-level integrated energy system considering generalized energy storages. Appl. Energy 302, 117493. doi:10.1016/j.apenergy.2021.117493
Deng, L., Cao, C., and Li, W. (2023). Impacts of carbon emission trading prices on financing decision of green supply chain under carbon emission reduction percentage measure. IEEE Access 11, 75929–75944. doi:10.1109/access.2023.3297649
Feng, J., and Zhou, H. (2022). Bi-level optimal capacity planning of load-side electric energy storage using an emission-considered carbon incentive mechanism. Energies 15 (13), 4592. doi:10.3390/en15134592
Gabbar, H. A., Abdussami, M. R., and Adham, M. I. (2020). Optimal planning of nuclear-renewable micro-hybrid energy system by particle swarm optimization. IEEE Access 8, 181049–181073. doi:10.1109/access.2020.3027524
Gowd, S. C., Ganeshan, P., Vigneswaran, V. S., Hossain, M. S., Kumar, D., Rajendran, K., et al. (2023). Economic perspectives and policy insights on carbon capture, storage, and utilization for sustainable development. Sci. Total Environ. 883, 163656. doi:10.1016/j.scitotenv.2023.163656
Guo, X., Lou, S., Wu, Y., and Wang, Y. (2022). Low-carbon operation of combined heat and power integrated plants based on solar-assisted carbon capture. J. Mod. Power Syst. Clean Energy 10 (5), 1138–1151. doi:10.35833/mpce.2021.000046
Han, J., Li, J., Tang, X., Wang, L., Yang, X., Ge, Z., et al. (2023). Coal-fired power plant CCUS project comprehensive benefit evaluation and forecasting model study. J. Clean. Prod. 385, 135657. doi:10.1016/j.jclepro.2022.135657
Helm, C., and Mier, M. (2021). Steering the energy transition in a world of intermittent electricity supply: optimal subsidies and taxes for renewables and storage. J. Environ. Econ. Manag. 109, 102497. doi:10.1016/j.jeem.2021.102497
Huang, M., Tang, K., Dong, S., Nan, B., and Song, Y. (2023). Optimal power flow considering user-side carbon emission allowances based on carbon flow theory. Power Syst. Technol. 47, 2703–2712.
Huang, W., Zhang, N., Yang, J., Wang, Y., and Kang, C. (2019). Optimal configuration planning of multi-energy systems considering distributed renewable energy. IEEE Trans. Smart Grid 10 (2), 1452–1464. doi:10.1109/tsg.2017.2767860
Li, X. Y., Gao, X., and Xie, J. J. (2022). Comparison and clarification of China and US CCUS technology development. Atmosphere 13 (12), 2114. doi:10.3390/atmos13122114
Li, X., Shi, D., Li, Y., and Zhen, X. (2019). Impact of carbon regulations on the supply chain with carbon reduction effort. IEEE Trans. Syst. Man, Cybern. Syst. 49 (6), 1218–1227. doi:10.1109/tsmc.2017.2741670
Li, Y., Lu, H., Shi, W., Zhang, W., Shan, M., and Jiang, W. (2021). “Calculation model of carbon emissions in the electric power industry’s life cycle based on LCA method,” in 2021 IEEE Sustainable Power and Energy Conference (iSPEC), Nanjing, China, 23-25 December 2021, 2263–2268.
Lin, S., Liu, C., Shen, Y., Li, F., Li, D., and Fu, Y. (2022). Stochastic planning of integrated energy system via frank-copula function and scenario reduction. IEEE Trans. Smart Grid 13 (1), 202–212. doi:10.1109/tsg.2021.3119939
Liu, E., Lu, X., and Wang, D. (2023b). A systematic review of carbon capture, utilization and storage: status, progress and challenges. Energies 16 (6), 2865. doi:10.3390/en16062865
Liu, H., Tian, S., Wang, X., Cao, Y., Zeng, M., and Li, Y. (2021). Optimal planning design of a district-level integrated energy system considering the impacts of multi-dimensional uncertainties: a multi-objective interval optimization method. IEEE Access 9, 26278–26289. doi:10.1109/access.2021.3053598
Liu, H., and Wang, Z. (2020). Research on energy storage and high proportion of renewable energy planning considering demand. IEEE Access 8, 198591–198599. doi:10.1109/access.2020.3035699
Liu, S., Wei, N., Jiang, D., Nie, L., Cai, B., Tao, Y., et al. (2023c). Emission reduction path for coal-based enterprises via carbon capture, geological utilization, and storage: China energy group. Energy 273, 127222. doi:10.1016/j.energy.2023.127222
Liu, Z., Xing, H., Luo, Y., Ye, Y., and Shi, Y. (2022). Low-carbon economic dispatch of an integrated energy system based on carbon emission flow theory. J. Electr. Eng. Technol. 18 (3), 1613–1624. doi:10.1007/s42835-022-01298-7
Liu, Z. X., Gao, M., Zhang, X. M., Liang, Y., Guo, Y. J., Liu, W. L., et al. (2023a). CCUS and CO2 injection field application in abroad and China: status and progress. Geoenergy Sci. Eng. 229, 212011. doi:10.1016/j.geoen.2023.212011
Luo, G., Liu, Y., Zhang, L., Xu, X., and Guo, Y. (2021). Do governmental subsidies improve the financial performance of China’s new energy power generation enterprises? Energy 227, 120432. doi:10.1016/j.energy.2021.120432
Martelli, E., Freschini, M., and Zatti, M. (2020). Optimization of renewable energy subsidy and carbon tax for multi energy systems using bilevel programming. Appl. Energy 267, 115089. doi:10.1016/j.apenergy.2020.115089
Ma Rui, Z. Q., Wu, X., and Li, X. (2015). Random fuzzy uncertain model for daily wind speed. Proc. CSEE 35, 6351–6358.
Masoumzadeh, A., Alpcan, T., and Nekouei, E. (2020). Designing tax and subsidy incentives towards a green and reliable electricity market. Energy 195, 117033. doi:10.1016/j.energy.2020.117033
Mei, F., Zhang, J., Lu, J., Lu, J., Jiang, Y., Gu, J., et al. (2021). Stochastic optimal operation model for a distributed integrated energy system based on multiple-scenario simulations. Energy 219, 119629. doi:10.1016/j.energy.2020.119629
Meinshausen, M., Lewis, J., McGlade, C., Gutschow, J., Nicholls, Z., Burdon, R., et al. (2022). Realization of Paris Agreement pledges may limit warming just below 2 °C. Nature 604 (7905), 304–309. doi:10.1038/s41586-022-04553-z
Moreira, A., Pozo, D., Street, A., and Sauma, E. (2017). Reliable renewable generation and transmission expansion planning: Co-optimizing system's resources for meeting renewable targets. IEEE Trans. Power Syst. 32 (4), 3246–3257. doi:10.1109/tpwrs.2016.2631450
Nan, J., Feng, J., Deng, X., Wang, C., Sun, K., and Zhou, H. (2022a). A bi-layer stochastic coordinated planning framework for wind-battery power systems considering bilateral carbon trading. IET Generation, Transm. Distribution 16 (24), 5052–5068. doi:10.1049/gtd2.12657
Nan, J., Feng, J., Deng, X., Wang, C., Sun, K., and Zhou, H. (2022b). Hierarchical low-carbon economic dispatch with source-load bilateral carbon-trading based on aumann–shapley method. Energies 15 (15), 5359. doi:10.3390/en15155359
Ostberg, S., Boysen, L. R., Schaphoff, S., Lucht, W., and Gerten, D. (2018). The biosphere under potential Paris outcomes. Earth's Future. 6 (1), 23–39. doi:10.1002/2017ef000628
Pourakbari-Kasmaei, M., Lehtonen, M., Contreras, J., and Mantovani, J. R. S. (2020). Carbon footprint management: a pathway toward smart emission abatement. IEEE Trans. Industrial Inf. 16 (2), 935–948. doi:10.1109/tii.2019.2922394
Shi, Z., Wang, W., Huang, Y., Li, P., and Dong, L. (2020). Simultaneous optimization of renewable energy and energy storage capacity with hierarchical control. CSEE J. Power Energy Syst. 8, 95–104. doi:10.17775/CSEEJPES.2019.01470
Sun, W., Wang, Q., Ye, Y., and Tang, Y. (2022b). Unified modelling of gas and thermal inertia for integrated energy system and its application to multitype reserve procurement. Appl. Energy 305, 117963. doi:10.1016/j.apenergy.2021.117963
Sun, W., Xiao, J., Hou, J., Jin, C., and Nie, Y. (2022a). Investment cost forecasting for low carbon power system planning considering technical progress and scale effect. IEEE Access 10, 114153–114164. doi:10.1109/access.2022.3218060
Tan, Q., Liu, Y., and Zhang, X. (2021). Stochastic optimization framework of the energy-water-emissions nexus for regional power system planning considering multiple uncertainty. J. Clean. Prod. 281, 124470. doi:10.1016/j.jclepro.2020.124470
Wang, C., Chen, Y., Wen, F., Tao, Y., Chi, C., and Jiang, X. (2022c). Improvement and perfection of carbon emission flow theory in power systems. Power Syst. Technol. 45, 1683–1691.
Wang, R., Wen, X., Wang, X., Fu, Y., and Zhang, Y. (2022b). Low carbon optimal operation of integrated energy system based on carbon capture technology, LCA carbon emissions and ladder-type carbon trading. Appl. Energy 311, 118664. doi:10.1016/j.apenergy.2022.118664
Wang, Y., Qiu, J., and Tao, Y. (2022a). Optimal power scheduling using data-driven carbon emission flow modelling for carbon intensity control. IEEE Trans. Power Syst. 37 (4), 2894–2905. doi:10.1109/tpwrs.2021.3126701
Wu, T., Yang, S., and Tan, J. (2020). Impacts of government R&D subsidies on venture capital and renewable energy investment -- an empirical study in China. Resour. Policy 68, 101715. doi:10.1016/j.resourpol.2020.101715
Xue, X., Ai, X., Fang, J., Cui, S., Jiang, Y., Yao, W., et al. (2022). Real-time schedule of microgrid for maximizing battery energy storage utilization. IEEE Trans. Sustain. Energy 13 (3), 1356–1369. doi:10.1109/tste.2022.3153609
Yan, Z., Li, C., Yao, Y., Lai, W., Tang, J., Shao, C., et al. (2023). Bi-level carbon trading model on demand side for integrated electricity-gas system. IEEE Trans. Smart Grid 14 (4), 2681–2696. doi:10.1109/tsg.2022.3229278
Yang, L., Xu, M., Yang, Y., Fan, J., and Zhang, X. (2019). Comparison of subsidy schemes for carbon capture utilization and storage (CCUS) investment based on real option approach: evidence from China. Appl. Energy 255, 113828. doi:10.1016/j.apenergy.2019.113828
Yao, F., Zhao, D., Jia, C., Zhao, S., Chen, H., and Zheng, Q. (2023). “Cost and benefit analysis of CCUS application for thermal power units in the context of clean energy market,” in 2023 8th Asia Conference on Power and Electrical Engineering (ACPEE), Tianjin, China, 14-16 April 2023, 1355–1360.
Zhong, J., Cao, Y., Li, Y., Tan, Y., Peng, Y., Cao, L., et al. (2021). Distributed modeling considering uncertainties for robust operation of integrated energy system. Energy 224, 120179. doi:10.1016/j.energy.2021.120179
Zhuo, Z., Zhang, N., Hou, Q., Du, E., and Kang, C. (2022). Backcasting technical and policy targets for constructing low-carbon power systems. IEEE Trans. Power Syst. 37 (6), 4896–4911. doi:10.1109/tpwrs.2022.3150040
Keywords: bi-layer expansion stochastic planning, carbon emission flow theory, carbon emission reduction, source-load bilateral carbon incentive mechanism, wind-CCUS-battery power systems
Citation: Deng X, Nan J, Feng J, Gong X, Zhou H and Tang W (2023) A bi-layer wind-CCUS-battery expansion stochastic planning framework considering a source-load bilateral carbon incentive mechanism based on the carbon emission flow theory. Front. Energy Res. 11:1304538. doi: 10.3389/fenrg.2023.1304538
Received: 29 September 2023; Accepted: 09 November 2023;
Published: 22 November 2023.
Edited by:
Shengyuan Liu, State Grid Zhejiang Electric Power Co. Ltd., ChinaReviewed by:
Hailiang Xu, China University of Petroleum (East China), ChinaGuibin Wang, Shenzhen University, China
Chao Wang, State Grid Corporation of China (SGCC), China
Copyright © 2023 Deng, Nan, Feng, Gong, Zhou and Tang. This is an open-access article distributed under the terms of the Creative Commons Attribution License (CC BY). The use, distribution or reproduction in other forums is permitted, provided the original author(s) and the copyright owner(s) are credited and that the original publication in this journal is cited, in accordance with accepted academic practice. No use, distribution or reproduction is permitted which does not comply with these terms.
*Correspondence: Hao Zhou, emhvdWhhb19lZUB6anUuZWR1LmNu; Wenhu Tang, d2VuaHV0YW5nQHNjdXQuZWR1LmNu