- 1Research Institute of Engineering Technology (Supervision Company), PetroChina Xinjiang Oilfield Company, Karamay, Xinjiang, China
- 2Key Laboratory of Tectonics and Petroleum Resources of Ministry of Education (China University of Geosciences), Wuhan, China
- 3Emergency Rescue Center, PetroChina Xinjiang Oilfield Company, Karamay, Xinjiang, China
- 4School of Geosciences, China University of Petroleum, Beijing, China
- 5YuanwangJingsheng Technology (Beijing) Co., Ltd., Beijing, China
Highly-deviated wells are the key technology to reduce the risk of drilling accidents and improve the utilization of reservoirs. However, for reservoirs with complex lithology, highly-deviated wells are faced with the problems of geomechanical transformation and fracturing parameter optimization. The research on fracturing parameter optimization technology of high-deviated wells in complex lithologic reservoirs is helpful to the research and application of geomechanics in deep unconventional reservoirs. This paper is based on geological mechanics laboratory experiments and logging interpretation, combined with regional geological background, to clarify the geological and mechanical characteristics of the Fengcheng Formation shale oil region in the Mabei Slope. On this basis, based on the current geostress field and natural fracture distribution pattern of the Mabei Slope, an integrated model of shale oil geological engineering in local well areas was established. Based on the finite element method, optimization design was carried out for the cluster spacing, construction fluid volume, displacement, and sand volume of highly deviated well fracturing, and three-dimensional simulation of fracturing fractures was completed. The research results indicate that: (1) The current dominant direction of the maximum principal stress in the Fengcheng Formation on the Mabei Slope is from northeast to southwest, with the maximum horizontal principal stress generally ranging from 90 to 120 MPa and the minimum horizontal principal stress generally ranging from 70 to 110 MPa. (2) The difference in stress between the two horizontal directions is relatively large, generally greater than 8 MPa. Two sets of natural fractures have developed in the research area, one with a northwest southeast trend and the other with a northeast southwest trend. The natural fracture density of the Fengcheng Formation shale reservoir in the Mabei Slope is 0.32–1.12/m, with an average of 0.58/m, indicating a moderate to high degree of fracture development. (3) The geological model and three-dimensional geo-mechanical model are established according to the actual drilling geological data, and different schemes are designed to carry out single parameter optimization. The optimization results show that the optimal cluster spacing of the subdividing cutting volume pressure of the highly deviated wells in the Fengcheng Formation of the Mabei Slope is 12 m, the optimal construction fluid volume is 1400–1600 m3/section, the optimal construction displacement is 8 m3/min, and the optimal sanding strength is 2.5 m3/m. At the same time, by comparing the fracturing implementation effect with the fracturing scheme design, it is proven that the artificial parameter optimization method for highly deviated wells based on the finite element method based on the regional stress background and the natural fracture development law proposed in this paper is feasible and can provide a scientific basis for the fracturing development of highly deviated wells in complex lithologic reservoirs. This research has been well applied in Mahu area of Xinjiang oilfield.
1 Introduction
With the deepening of oilfield exploration and development, oil and gas reservoirs represented by tight oil and shale oil and gas, with poor reservoir physical properties, bottom natural production capacity, and gradually increasing development difficulties, will be fractured and reformed to exploit the oil and gas wells more adequately (Liu et al., 2021; 2023a; Yang and Liu, 2021; Abdelaziz et al., 2023; Wang DB. et al., 2023). In the petroleum field, fracturing is a method of utilizing hydraulic forces to form fractures in oil or gas formations during oil or gas extraction, also known as hydraulic fracturing (Montgomery and Smith, 2010; Zoveidavianpoor and Gharibi, 2015; Osiptsov, 2017; Yao et al., 2021; Li et al., 2022; Xu et al., 2022; Shah and Shah, 2023). Fracturing artificially fractures the formation to improve the oil flow environment in the subsurface and increase well production, which can play an important role in improving wellbore flow conditions, slowing the interlayer and improving formation mobilization. Therefore, optimizing the fracturing parameters of reservoirs plays a very important role in increasing the production capacity of reservoirs (Warpinski et al., 2009; Shen et al., 2016; Chai and Yin, 2021; He et al., 2021; Dai et al., 2023; Hui et al., 2023).
The large-scale hydraulic fracturing of highly inclined Wells and horizontal Wells is the most effective means to efficiently develop low permeability sandstone and carbonate reservoirs, tight oil and gas reservoirs, and unconventional oil and gas reservoirs (shale gas, coalbed methane, shale oil) (Li et al., 2020; Ma et al., 2022; Wang H. et al., 2023). At present, the research on fracturing of high inclination well at home and abroad mainly focuses on fracture initiation and extension mechanism, fracturing technology of inclined well, laboratory simulation experiment and field test. However, the research focusing on Mahu area of Xinjiang oilfield is faced with practical problems. Usually, the investment in the construction of high-inclination Wells is 1.8 times that of conventional Wells, but the output reaches 3.2 times that of conventional Wells, increasing the demand for the goal of “less drilling, more oil production and improved oil recovery” (Soliman et al., 2008; Ouenes et al., 2016; Tang et al., 2021; Wang et al., 2021; Yang et al., 2021; Li et al., 2022; Liu et al., 2022; 2023b; Li et al., 2023). The large-slope wells may have problems such as fracture initiation and sand addition difficulties, so the establishment of a set of optimization methods for the fracturing parameters of large-slope wells is crucial for the development of shale reservoirs with complex lithologies.
The purpose of this paper is to establish an integrated geological and engineering model for shale oil based on the present ground stress field and natural fracture distribution law through the combination of reasonable geology and engineering and to carry out in-depth systematic research on the characteristics of artificial fracture initiation and expansion, optimal design of fracturing and reforming, and postpressure analysis and evaluation to realize geology by combining reasonable geology and engineering and to achieve the optimal configuration of engineering parameters and it has novelty. We will carry out in-depth and systematic research on artificial fracture initiation and expansion characteristics, optimized design of fracturing and reforming, and postcompression analysis and evaluation to achieve the optimal configuration of geological and engineering parameters, form an integrated geological and engineering research model for shale oil reservoir fracturing and reforming, and reduce the cost of development to realize the purpose of beneficial development.
2 Geological setting
2.1 Tectonic location and geologic structure
The study area North Slope of the Mahu Depression belt (later referred to as the Mahu North Slope) is located in Hebkeser Mongol Autonomous County, Xinjiang Uygur Autonomous Region, approximately 28.87 km east of the Urhe District of Kelamayi City, and tectonically situated in the Wuxia Fracture Zone of the western uplift of the Junggar Basin, next to the Central Depression of the Mahu Depression, with the surface of the Gobi and the ground surface being relatively flat, with an average ground surface elevation of approximately 400 m (Figure 1).
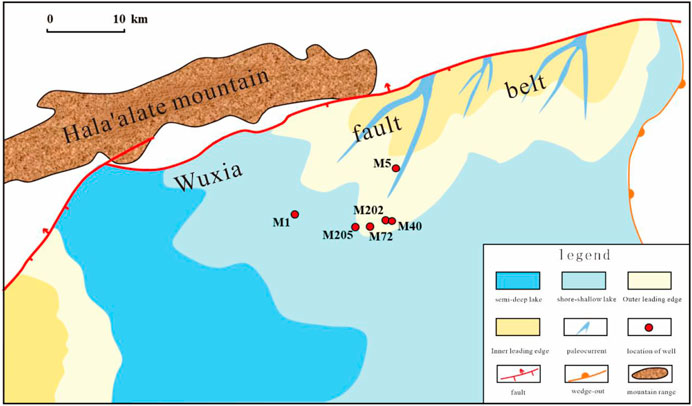
FIGURE 1. Geographic location map of the Fengcheng Formation reservoir in the northern slope of the Mahu Sag.
Exploration in the study area began in the 1980 s, and the Fengcheng Formation (P1 f) of the Marbei slope (Pf) was located in the Xiazijie nosedive zone during both the Jurassic and Cretaceous orogenic periods, and present-day tectonics suggest that the area is still nosedive at present (Ma et al., 2022; Chen et al., 2022; Shi et al., 2022; Lu et al., 2023). The development of two large-scale retrograde fractures is the main through-origin fracture in this area, and the large-scale fractures are accompanied by microfractures around them (Xiao et al., 2021). Oil test in the well section of 4,831.0–4,886.0 m in the P1f1 layer of the Permian Fengcheng Formation yielded 3.65 t of oil per day from a 4 mm nozzle and 1.48 m3 of water per day; oil test in the well section of 4,683.0–4,701.0 m in the P1f2 layer of the Permian Fengcheng Formation without fracturing yielded 0.54 t of oil per day from a 4 mm nozzle; oil test in the well section of 4,571.0–4,594.0 m in the P1f3 layer of the Permian Fengcheng Formation, stratigraphic test, obtained 1.13 t of oil per day. From the oil test, the natural production capacity of a single well is low, and fracturing and reforming are needed to increase the production.
2.2 Stratigraphy
The main stratigraphic strata drilled from top to bottom in the study area are the Cretaceous Tugulu Group, Jurassic Qigu Formation, Toutunhe Formation, Xishanyao Formation, Sanguohe Formation, Badawan Formation, Triassic Baikaitan Formation, Karamay Formation, Baikouquan Formation, Permian Upper Urho Formation, Lower Urho Formation, Xazijie Formation, Fencheng Formation, and Jiamuhe Formation. Among them, there is an unconformable contact between the Cretaceous and Jurassic, Jurassic and Triassic, Triassic and Permian, as well as the Permian Upper Urho Formation and the underlying strata (Zhu et al., 2021; Chen et al., 2022; Huang et al., 2022).
The Permian Fengcheng Formation in the Mabei slope area is a fan-delta-lake deposition accompanied by volcanism, and the scale of volcanic activity gradually decreases from bottom to top. The Fengcheng Formation is divided into the P1f1 layer, P1f2 layer, and P1f3 layer according to lithological, electrical, and depositional cyclic characteristics.
2.3 Sedimentary characteristics
The P1f1 layer of the Permian Fengcheng Formation on the Marbei Slope mainly features a set of rhyolitic fused conglomerates. Through the systematic analysis of the core, chip logging and petrographic analysis of the completed drilling wells, it is found that in the early Permian Fengcheng period (the P1f1 layer), the Marbei Slope was at the edge of the Junggar Plateau, and the stratigraphic environment of the slope was in the transition from the terrestrial rift volcano-building phase to the lake basin phase. The bottom stratigraphy of the Permian Fengcheng Formation of the Mabei Slope has both volcanic and lacustrine sedimentary stratigraphy, which is a set of longitudinal superpositions of volcanic clastic stratigraphy and sedimentary stratigraphy.
The P1f2 layer is a fan delta-lagoon deposition accompanied by volcanic activity, which is a mixed deposition of endogenous (mud crystal tuffs and mafic rocks formed by chemical deposition in the environment of the low-energy lagoon) and exogenous (input from the fan delta supplying terrestrial source of detrital materials and the air fall of volcanic dust supplying tuffaceous materials), which are inversely related to each other and thus form three types of reservoirs, namely, sandstone dominated by detrital materials, mafic rocks dominated by the environment of the alkali lagoon, and tuffaceous deposits under the domination of the volcano. The P1f2 layer has a large thickness, stable lateral spreading and is mainly interbedded with mudstone and muddy siltstone with high tuff content.
2.4 Reservoir characterization
Based on the oil test and logging data to determine the oil-water distribution relationship of the P1f1 layer reservoir, combined with the results of the M40 well oil test (3-layer combined test, oil and water in the same layer) analysis, the oil bottom height is taken as the bottom boundary of the upper shot hole layer section of the M40 well −4,437.0 m, and the bottom boundary of the oil out layer section of the test oil of the M202 well −4,432.0 m, which is 5 m higher than the height of the oil bottom. Combined with the production of the M202 well, the production time is 5,713 days. The production time is 5,713 days, the oil production is nearly 3.6 × 10⁴ t, and no water is still observed. The analysis suggests that the oil-water interface should be lower than the oil bottom height, so the middle value of the top boundary of the layer section of the water out of the M202 well (−4,463.0 m) and the top boundary of the layer section of the oil out of the M40 well is taken as the oil-water interface, and the oil-water interface is −4,450.0 m. Overall, the reservoirs of the P1f1 layer are layered dorsal inclined tectonic rocky reservoirs with side water under the control of tectonics. According to the tectonic interpretation, oil test data and comprehensive geological study, the P1f2 reservoir is a shale oil reservoir.
The P1f1 layer of the Permian Fengcheng Formation on the slope of Ma Bei has a stable lateral distribution and vertical concentration, and the average thickness of the oil layer is approximately 20 m. The P1f2 layer of the oil layer has a stable lateral distribution and a vertical span of approximately 170 m, 5 sets of desert bodies have developed from the top to the bottom, and the thickness of the stacked layers ranges from 17.3 to 72.6 m, with an average of 51.0 m. The thickness of the stacked layers of the single desert body ranges from 4.4 to 22.6 m, with an average of 11.1 m P1f1 layer oil reservoir. The central part of the reservoir is at an elevation of −4,408 m, and the central part is buried at a depth of 4,810 m. The central part of the P1f2 layer reservoir is at an elevation of −4,298 m, and the central part is buried at a depth of 4,700 m, which belongs to a typical deep oil reservoir.
2.5 Regional stress characteristics
The regional tectonic background is the determining factor for the distribution of the present-day ground stress field. Mainland China is part of the Eurasian plate, sandwiched between the Indian, Philippine, Pacific and Siberian-Mongolian plates. Under the influence of the collision between the Indian plate and the Eurasian plate, the present-day horizontal maximum principal stresses in the western part of the oil and gas basin are in a north‒north-east-south‒south-west direction, while in the central part of China, under the influence of the two plates, the present-day maximum principal stresses are in a nearly north‒north-east direction (Fan et al., 2012). The Junggar Basin is located in the western part of China, and the present-day horizontal maximum principal stresses in the region are in the north‒northeast-south‒south-west direction. The study area is located in the northwestern edge of the Junggar Basin, in front of the Hara Arat Mountains, the descending plate of the Wuxia Fracture Zone, the whole is in the remote effect of the collision between the Indian plate and the Eurasian plate, and the regional stress background of the Hashan retrograde thrusting and overturning folding, and it is predicted that the study area is in the NNE-SNSW extrusion and levitated torsional and torsional sliding stress field, and the direction of the stress has been deflected to some extent due to the influence of the local tectonics.
3 Geomechanical characteristics of the Fengcheng Formation reservoir
3.1 Reservoir lithology and physical characteristics
The results of whole rock analysis and X-ray diffraction analysis of P1f1 layer are shown in Table 1, and the overall content of clay minerals in the core is 4%. The clay minerals are dominated by the green montmorillonite layer, accounting for 96% of the clay minerals. Through the core stability experiment, first, the core at 4,808–4,810 m of the P1f1 layer of the M72 well was immersed in 2% KCl solution, and second, it was put into an 85°C water bath. After 30 h, if there was no swelling and loosening phenomenon of the core, the core had low water sensitivity.

TABLE 1. Results of whole-rock analysis and X-ray diffraction analysis of reservoirs in the Fengcheng Formation (4,808–4,810 m).
The swelling height of the core of the M1 well in clear water in the study area is small, there is no obvious change in immersion, the potential water sensitivity of the reservoir is weak, and the water sensitivity of the P1f2 layer is weak. However, the matrix of the P1f2 layer contains silica-boron sodalite, and the presence of boron will cause the guanidinium gel fracturing fluid to have difficulty breaking the gel, and there is the possibility of residual gel injury.
The layer oil layer of P1f2 has a longitudinal span of approximately 170 m, is mainly interbedded mudstone and mud siltstone, and has a high tuff content. Five sets of dessert bodies are developed from top to bottom, and the thickness of the interlayer between each dessert body ranges from 0.8 to 30.2 m, with an average of 10.8 m. Single dessert body, 2-3 sets of interlayers are developed in the inner part of the formation, with thicknesses ranging from 0.85 to 8.83 m, with an average of 4.39 m. The oil layer is mainly composed of mudstone and mud siltstone interbedded with high tuff content.
The pore types of P1f1 layer are mainly primary pores of various sizes, accounting for 99%, and a small number of micro-cracks, accounting for 1% (mainly playing a communication role). The shape of the pores is irregular, up to 20 mm. According to the size of the pores, the degree of development and the connection relationship, it has a very close relationship with the lithology (volcanic debris). The porosity of the oil reservoir is mainly distributed in 10.1%–30.1%, with an average of 15.87%; the permeability of the oil reservoir is mainly distributed in 0.01–7.82 mD, with an average of 0.187 mD, which belongs to the medium-low pore dense reservoir.
P1f2 The main reservoir space of the layer is matrix pores (drainages or dissolved pores of silica-boronatite and carbonate-calcite salt minerals within the matrix) and microfine fractures. The porosity of the sweet spot section ranges from 3.8% to 18.9%, with an average of 6.9%; the oil saturation ranges from 35.8% to 67.2%, with an average of 53.1%; and the permeability ranges from 0.02 to 0.67 mD, with an average of 0.09 mD, belonging to the extralow porosity and extralow permeability reservoir.
According to the 2D NMR special logging interpretation of the M205 well, the P1f free oil porosity body averages approximately 0.72%, which is slightly better than that of the neighboring M1 wells. Combined with imaging logging for the overall evaluation study of well M205, P1f natural fractures are very developed, mainly in medium and high angles, mostly high conductivity fractures, which is favorable for later reservoir modification (Figure 2A). Drawing on the research results of the M1 well reservoir classification and evaluation standard (Figure 2B), P1f of the M205 well was evaluated for desserts, and 446.03 m of Class I desserts, 123.99 m of Class II desserts and 255.23 m of Class III desserts were interpreted, with the proportion of Class I and Class II desserts accounting for 69.07%.
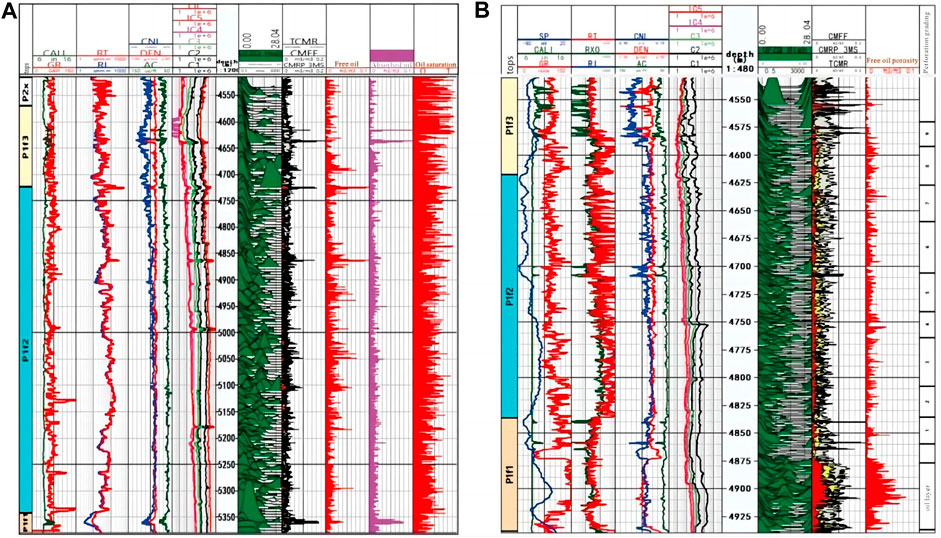
FIGURE 2. Comparison of reservoir quality evaluation of wells M205 and M1 Permian Fengcheng Formation P1f. (A) The P1f reservoir quality evaluation map of the Permian Fengcheng Formation in well M205 (B) The P1f reservoir quality evaluation map of the Permian Fengcheng Formation in well M1.
3.2 Mechanical properties of reservoir rocks
Rock mechanical parameters are the basic data for solving many petroleum engineering technologies, which are of great significance for solving the drilling well wall stabilization, hydraulic fracture initiation and expansion laws. In this paper, we carried out indoor experiments to determine the mechanical parameters of rocks in the target formation, mainly including uniaxial compression mechanics experiments, triaxial compression mechanics experiments, and Brazilian splitting experiments, recorded the pictures of rocks before and after the experiments, outputted the axial and radial stress‒strain curves of the rocks, and then calculated the modulus of elasticity, Poisson’s ratio, and compressive strength of these rock mechanical parameters based on the data from the stress‒strain curves (Table 2), among them, the confining pressure is determined by the minimum horizontal principal stress.
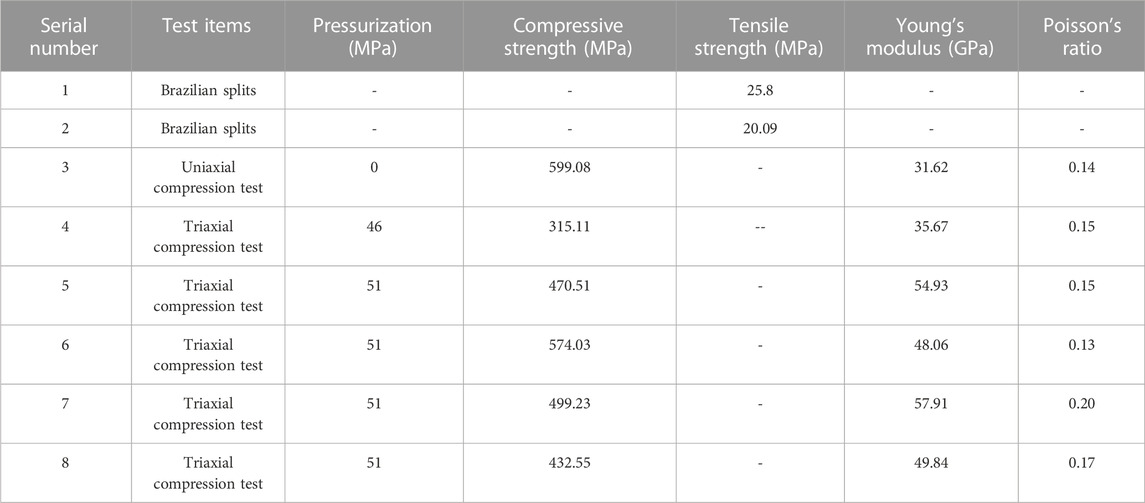
TABLE 2. Results of whole-rock analysis and X-ray diffraction analysis of the Fengcheng Formation reservoir.
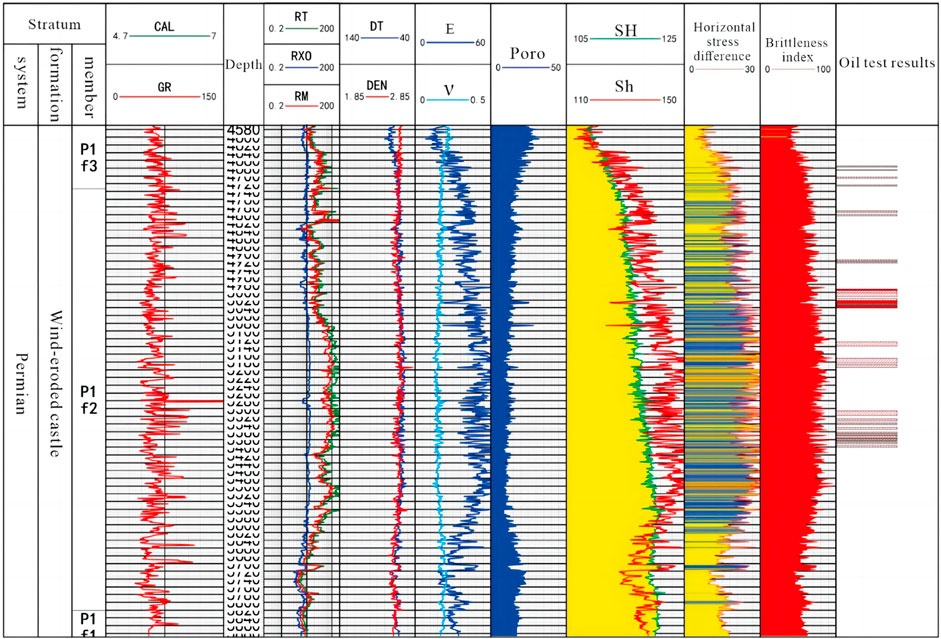
After the dynamic and static conversion of rock mechanical elasticity and rock mechanical strength parameters and the calculation of brittleness parameters, we obtained a series of logging interpretation data (Figure 3). These data are close to the actual situation of underground rock, which meets the needs of actual projects and can be utilized to establish a continuous single-well interpretation profile, which is of great practicality in actual applications. According to the logging interpretation results of the M5 wells, the Young’s modulus of the M5 well area shows an overall trend of increasing and then decreasing, generally in the range of 30–60 GPa; the Poisson’s ratio has little change overall, with an average value of approximately 0.2; the brittleness index of the P1f1 layer averages 57.3%, which is moderately brittle; the brittleness index of the P1f2 layer averages 70.0%, which is more brittle; and the brittleness index of the P1f3 layer averages 55.3%, which is slightly less brittle.
3.3 Present-day stress characteristics
3.3.1 Direction of present-day stress
In this study, the direction of current ground stress is determined mainly by using dipole acoustic wave logging fast transverse wave orientation and electric imaging logging drilling-induced fracture orientation. Dipole array acoustic logging data can be used to calculate the anisotropy of formation shear wave velocity, and the azimuth of fast shear wave is the direction of formation anisotropy. The anisotropy of the velocity is mainly caused by the imbalance of the ground stress in the undeveloped fracture formation, and the azimuth of the fast shear wave calculated at this time represents the direction of the maximum horizontal principal stress.
In the process of drilling, extrusion pressure is generated along the direction of maximum horizontal principal stress due to the joint action of drilling tool, ground stress and high pressure drilling fluid. When the extrusion pressure exceeds the fracture pressure of rock, the drilling induced crack is formed, and it is reflected in the electrical imaging (or acoustic imaging). Therefore, the orientation of the drilling induction joint can indicate the direction of the current maximum horizontal principal stress near the well area.
Statistical analysis of the present-day horizontal maximum principal stress orientation shown by dipole acoustic wave logging fast transverse wave orientation and electric imaging logging drilling-induced fracture orientation of 11 wells in the study area (Table 3), combined with the regional stress background, suggests that the present-day maximum principal stress dominant direction of shale oil in the Fengcheng Formation of the Mabei Slope is in the direction of north-east‒south-west (Figure 4).
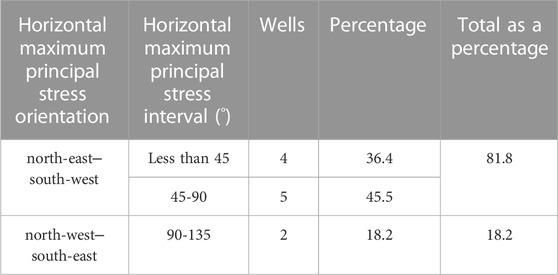
TABLE 3. Measured horizontal maximum principal stress direction statistics of drilling wells in the Fengcheng Formation, Mabei Slope.
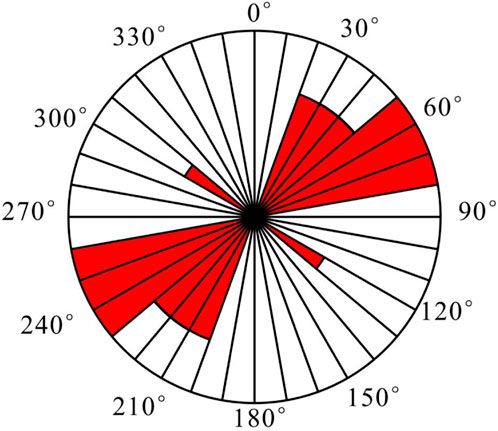
FIGURE 4. Schematic diagram of the maximum horizontal principal stress direction of the Fengcheng Formation oil reservoir in the northern slope of the Mahu Sag.
3.3.2 Present-day stress values
Geostress is spatially divided into vertical principal stress and maximum and minimum horizontal principal stresses. The vertical principal stress is caused by static rock pressure and can be obtained from density logging data. The two horizontal principal stresses, on the other hand, are caused by tectonic movement and are related to the pressure, tectonic stress and pore pressure of the overlying strata. The acoustic emission method is a method to determine the ground stress on the basis of the Kaiser effect, which is also called the Kaiser effect method (Lavrov, 2003; Meng et al., 2018). In practical applications, the correction between the logging interpretation value and the measured value is carried out to correct the dynamic and static geostress to obtain a more accurate geostress (Liu et al., 2021). In this study, the acoustic emission method combined with the logging interpretation method was used to obtain the stress values in the study area (Figure 3). The formula for calculating ground stress is as follows (Xu, 2019).
In the formula, “SH” is the maximum horizontal principal stress; “Sh” is the minimum horizontal principal stress; “SV” is the vertical principal stress; “β1” and “β2” are horizontal structural stress coefficient, dimensionless; “α” is the Boit coefficient, dimensionless; “μ” is the poisson’s ratio, dimensionless; “Pp” is the pore pressure, MPa; “H” is the depth, m; ρ (h) is the overburden density, g/cm3; “g” is the acceleration of gravity, m/s2. The horizontal structural stress coefficient and Boit coefficient in the model are obtained by correcting and inversely calculating the measured ground stress results.
Based on the acoustic emission experiments, the stress values of three samples in the study area were obtained, in which the maximum principal stress was 90.7 MPa, the minimum principal stress was 82.6 MPa, and the stress difference was 8.1 MPa, which provides data references for the logging calculations and the simulation of the stress field (Table 4). According to the logging interpretation results of the M5 well, the minimum horizontal principal stress of the M5 well area is more than 73 MPa, of which P1f1 is more than 120 MPa, the maximum horizontal principal stress is more than 82 MPa, P1f1 can be up to 130 MPa, the difference in the two-way stress in the middle horizontal of P1f2 can be more than 20 MPa, and the difference in the two-way stress in the horizontal of P1f1 and P1f3 is approximately 15 MPa. The maximum and minimum horizontal principal stresses generally increase, and the stress gradients are approximately 2.12 MPa/hm and 1.98 MPa/hm, respectively.
3.4 Characterization of natural fracture development
The Mabei Fengcheng Formation is located in the Wuxia Fracture Zone, which is characterized by strong tectonic activity, fault development, and overall development of natural fractures, with weak local development. The development of natural fractures is controlled by the influence of the activities of the Wuxia Fracture Zone (Feng et al., 2009; Jia et al., 2022). According to the analysis of the spreading characteristics of the Wuxia fracture zone on the north-east-east‒south-west strike, combined with the statistical law of natural fracture development interpreted by imaging logging, two groups of natural fractures are developed in the study area, one group on the north-west‒south-east strike and one group on the north-east‒south-west strike. The P1 f natural fracture density of the Mabei slope is 0.32–1.12 fractures/m, with an average of 0.58 fractures/m, which is a medium-high degree of fracture development. The P1f2 layer has a fracture density of 0.64–1.12 fractures/m, with an average of 0.78 fractures/m, which is a higher degree of fracture development. P1 f high conductivity fracture accounts for a high proportion of fractures, which reaches 57.6%, which indicates that the fracture filling degree is low, which is favorable for enhancing the seepage capacity of the reservoir and facilitating the fracturing process. and at the same time facilitates natural fracture opening and expansion during fracturing (Table 5). From the perspective of layers, except for well M4, the natural fracture development degree of the P1f2 layer is higher than that of the P1f3 layer in each well area. From the perspective of well area, the natural fracture development degree of the P1f3 layer and P1f2 is higher in the M4 well, followed by the M205 well and M5 well, and the fracture development degree of the M208 well is the lowest.
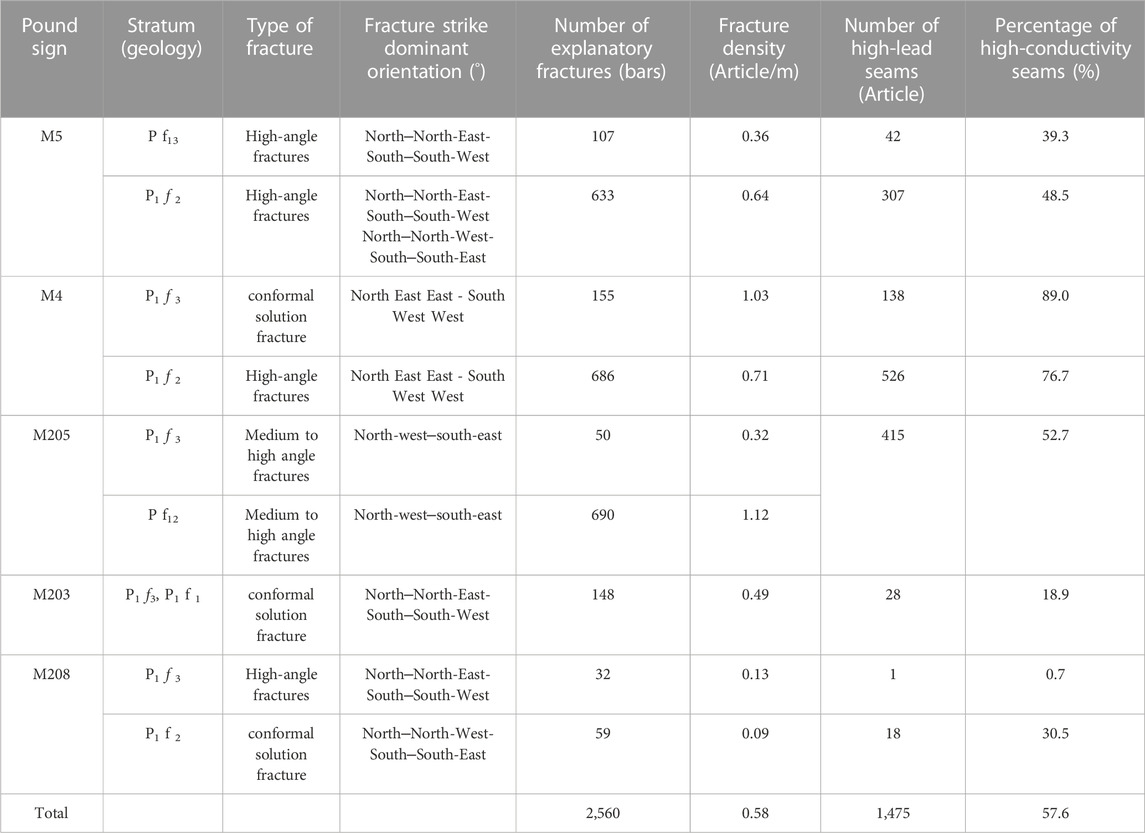
TABLE 5. Statistical data on the development characteristics of natural fractures in fengcheng formation image logging.
4 optimization of fracturing parameters for large slope wells
4.1 Localized 3D geostress and natural fracture modeling in the context of regional stresses
Due to the production characteristics of shale reservoirs, such as small pore throats, poor matrix flow capacity, fast decreasing production, rapid energy depletion, and low degree of reserve utilization, the shale oil reservoirs in this area are considered to be complex in lithology with multilayer characteristics and are developed by using large inclined wells. Theoretical analysis and numerical simulation are combined to establish an integrated shale oil geoengineering model (Figure 5). Based on the present-day ground stress field and natural fracture distribution pattern of the Mabei slope, taking the M5 well as an example, and the modeling method is described in. From the results of the stress field simulation, the horizontal maximum principal stress in the M5 well area is 90–120 MPa, the horizontal minimum principal stress is 70–110 MPa, and the simulation results are basically consistent with the results of the well logging interpretation. Based on the finite unit method for the optimization design of cluster spacing, construction fluid volume, displacement, and sand volume for fracturing of large-slope wells, the three-dimensional simulation simulation of fracturing fracture is completed to achieve the purpose of the optimal design of fracturing modification and the effective assessment of fracturing after compression.
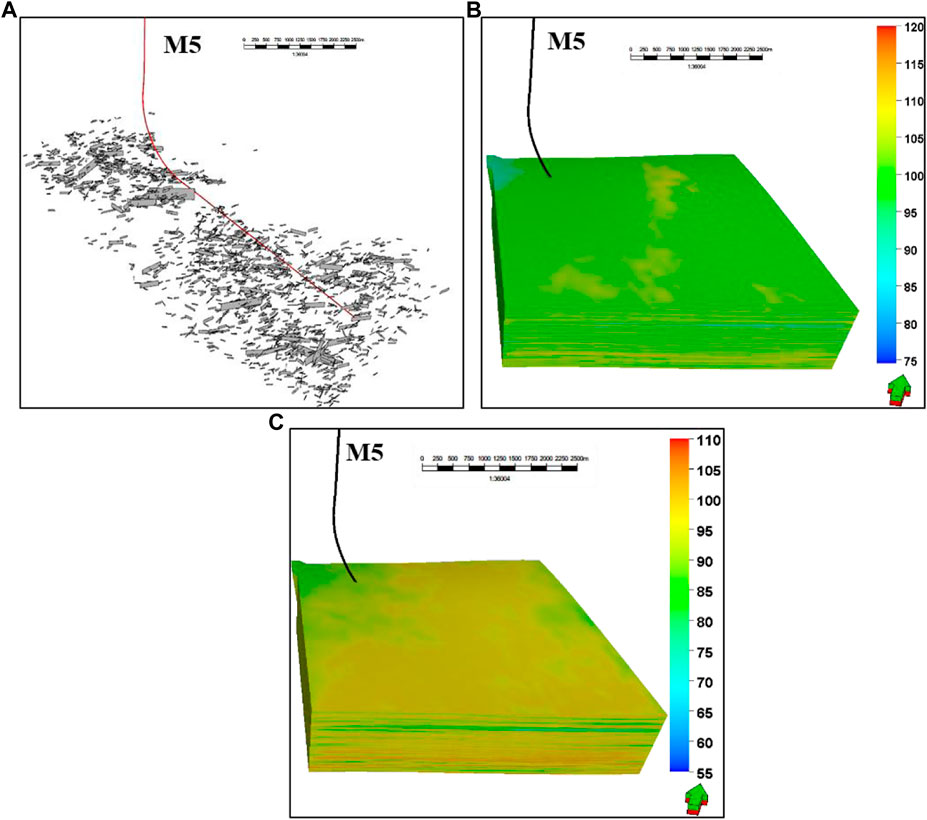
FIGURE 5. Three-dimensional model of the integration of natural fractures and present-day geostress in the M5 well zone. (A) Natural fracture model of the M5 well zone (B) Horizontal maximum principal stress model of the M5 well zone (MPa) (C) Horizontal minimum principal stress model of the M5 well zone (MPa).
4.2 Optimization of artificial fracture parameters
4.2.1 Cluster spacing optimization
Based on the finite element method to carry out three-dimensional simulation of artificial fractures, three sets of different cluster spacing schemes (cluster spacings of 8 m, 10 m, and 12 m) were designed to optimize the cluster spacing of injection holes, and the degree of stress interference between the postpressure slit networks was used as an evaluation index to select the appropriate cluster spacing. The simulation results show that (Figure 6), when the cluster spacing is less than or equal to 8 m, the interference between clusters is serious; there is interference between clusters between 10 m and 12 m; when the cluster spacing is greater than 12 m, the interference between clusters disappears. The optimal cluster spacing is recommended to be approximately 12 m, taking into consideration the adequacy of fracturing modification and minimizing the intercluster interference.
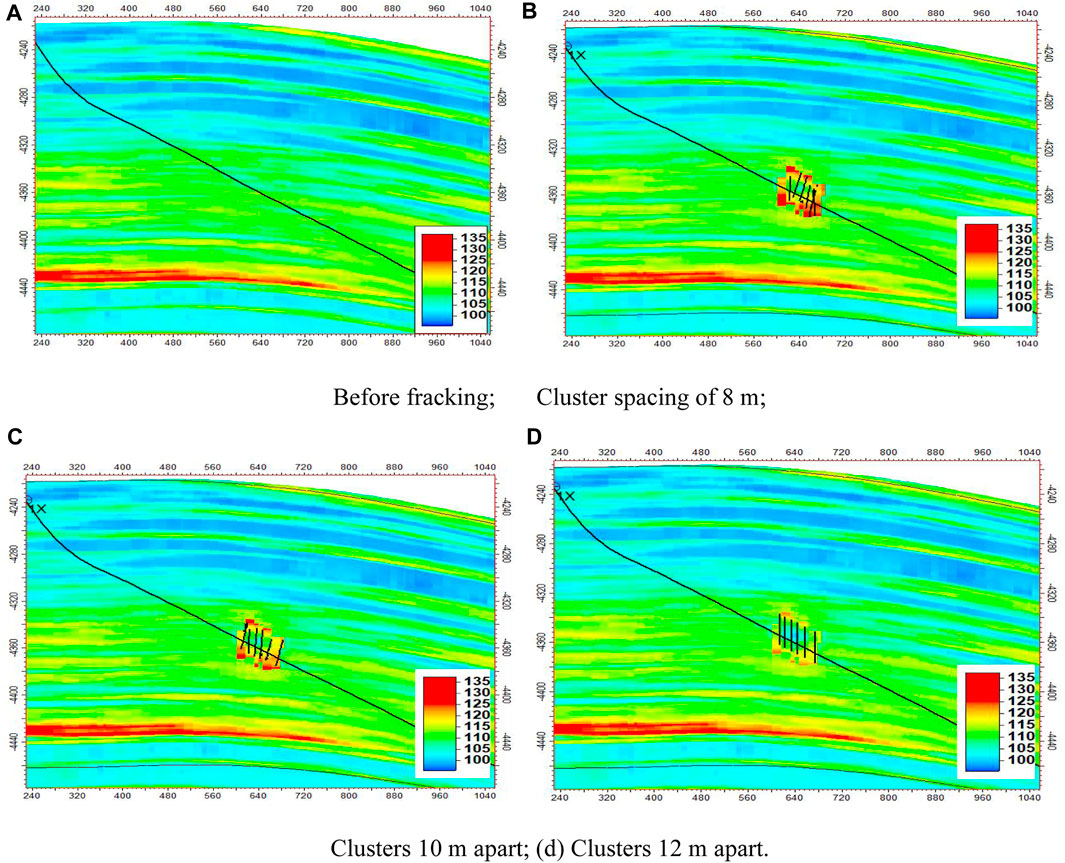
FIGURE 6. Simulation of artificial fracture extension under different cluster spacing conditions (vertical stress). (A) Before fracking; (B) Cluster spacing of 8 m; (C) Clusters 10 m apart; (D) Clusters 12 m apart.
4.2.2 Optimization of construction fluid volume
Five sets of fracturing simulation schemes with different construction fluid volumes (1,000, 1,200, 1,400, 1,600, and 1800 m3/section) were designed to optimize the construction fluid volume for each section, and the postfracturing seam network reforming volume was used as the evaluation index to select the appropriate fluid volume. The simulation results show that when the construction fluid volume is larger than 1,600 m3/segment, the relationship curve between the reformed volume of the postfracturing seam network and the construction fluid volume shows an inflection point (Figure 7), and the increase slows down dramatically, so it is recommended that the construction fluid volume be 1,400–1,600 m3/segment.
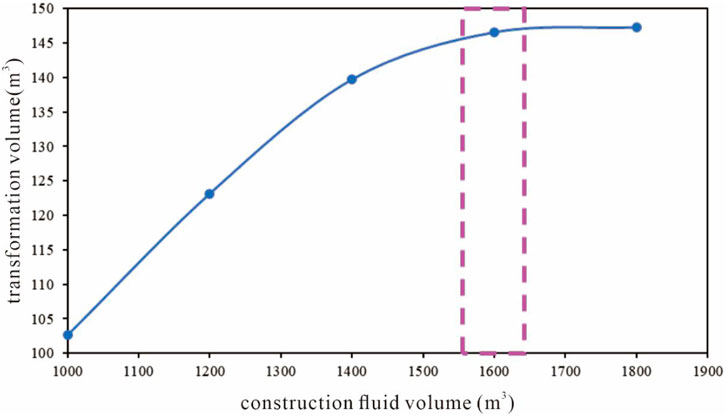
FIGURE 7. Relation curve between reconstruction volume of fracture network and construction fluid volume after fracturing.
4.2.3 Construction displacement optimization
The design takes 12 m as the cluster spacing, and in the construction fluid volume of 1,600 m3/section as the base condition, five sets of different construction displacements are designed for comparison (4, 6, 8, 10, and 12 m3/min), and the same postfracturing slit-net reforming volume is used as the evaluation index to optimize the appropriate displacements. The simulation results show that when the construction displacement is larger than 8 m3/min, the relationship curve between the modified volume of the postfracturing seam network and the construction displacement shows an inflection point (Figure 8), and the increase in the modified volume of the postfracturing seam network is slowed down, so the optimal construction displacement is suggested to be 8 m3/min.
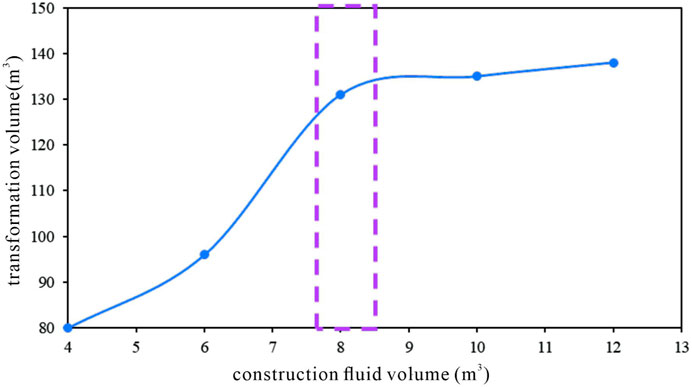
FIGURE 8. Relation curve between fracture pattern reconstruction volume and construction displacement after fracturing.
4.2.4 Optimization of sanding strength
The design takes 12 m as the cluster spacing, and in the construction fluid volume of 1,600 m3/section and construction displacement of 8 m3/min as the base condition, five different sets of sand addition intensity programs are compared (1.0, 1.5, 2.0, 2.5, and 3.0 m3/m), and the postfracturing seam network permeability is used as the evaluation index to optimize the appropriate sand addition intensity. The simulation results show that when the construction sanding strength is greater than 2.5 m3/m, the inflection point of the relationship curve between the permeability of the postfracturing seam network and the sanding strength occurs (Figure 9), and the increase in the permeability of the postfracturing seam network slows down, so it is suggested that the optimal sanding strength is 2.5 m3/m.
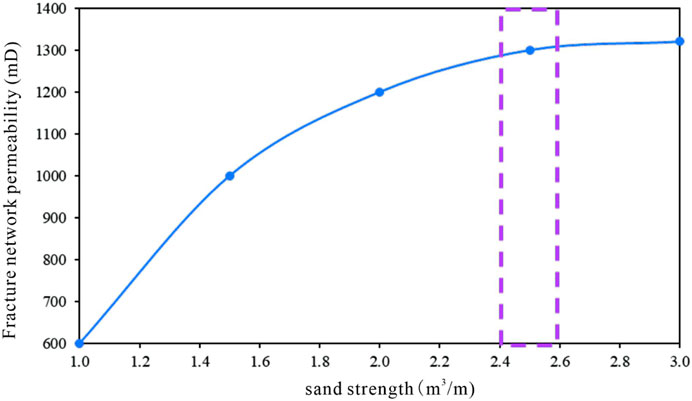
FIGURE 9. Relationship curve between the permeability of the fracture network and sanding strength after fracturing.
4.2.5 Prediction of three-dimensional spatial spreading of artificial seams
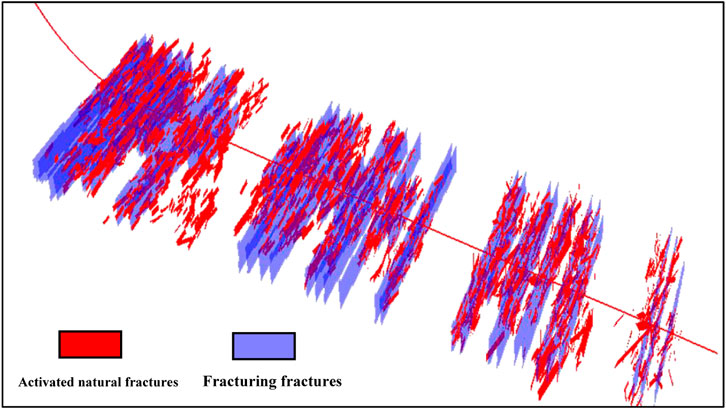
Based on actual drilling geological data, a geological model and 3D geomechanical model were established, and based on the optimized design of artificial fractures, a 3D simulation of fracturing fractures was carried out for the whole well section. The designed cluster spacing is 12 m, the construction fluid volume is 1,600 m3/section, the construction displacement is 8 m3/min, and the strength of sand addition is 2.5 m3/m as the basic conditions. Based on the natural fracture model, three-dimensional ground stress field, and the actual construction design parameters of the M5 well, a three-dimensional model of fractured fracture in the M5 well is completed (Figure 10). The effect of fracturing simulation shows that the hydraulic main fracture extends along the direction of maximum horizontal stress, activates a small number of natural fractures and is vertically affected by the trajectory of the well with a large inclination, and the phenomenon of penetrating the layer is more common.
4.3 Evaluation of fracturing effectiveness
Comparison of fracturing construction data and fracturing design, combined with three-dimensional fine simulation of artificial fracture, postpressure fracture evaluation and assessment of modification effect were carried out. From the analysis of pressure construction data, the total designed fluid volume is 30,844 m3, and the actual total fluid volume of fracturing is 31,285.4 m3, with a compliance rate of 101.4%. The total designed sand volume is 1735 m3, and the actual total sand volume is 1,621 m3, with a compliance rate of 93.4%. For 24-stage fracturing, the compliance rate of adding sand is lower than 80%, except for the 10th, 12th, 14th, and 17th fracturing, for a total of 4-stage fracturing (Figure 11), which is analyzed because of the natural fracture. This is due to less activation of natural fractures, which leads to higher construction pressure and relative difficulty in adding sand. Overall, the program design requirements were basically met.
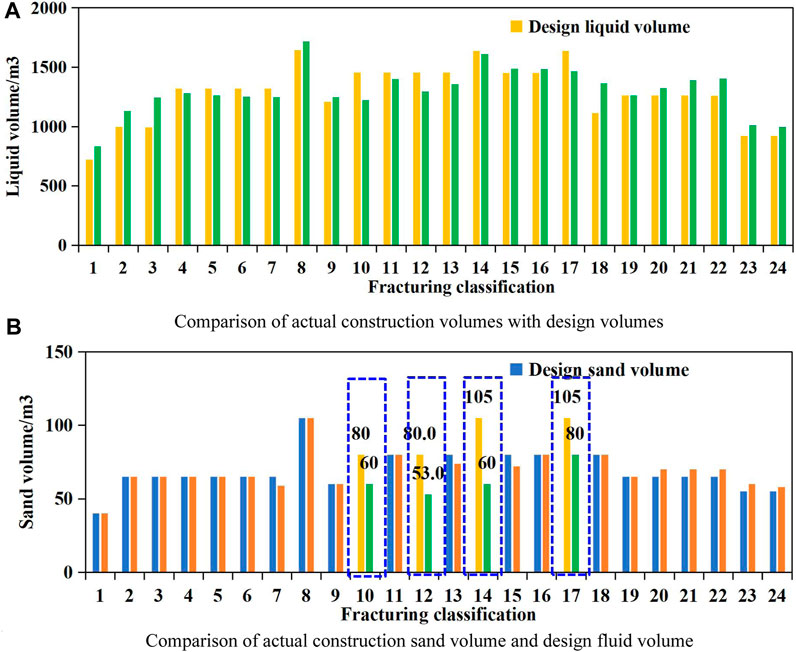
FIGURE 11. Comparison of fracture construction and design parameters for Well M5. (A) Comparison of actual construction volumes with design volumes. (B) Comparison of actual construction sand volume and design fluid volume.
5 Conclusion
(1) Based on geomechanical indoor experiments and logging interpretation, combined with the regional geological background, this paper clarifies the regional geomechanical characteristics of shale oil in the Mabei Slope Fengcheng Formation and concludes that the present maximum principal stress of the Mabei Slope Fengcheng Formation dominates the direction of the north-east‒south-west trend, the horizontal maximum principal stress is generally in the range of 90–120 MPa, the horizontal minimum principal stress is generally in the range of 70–110 MPa, and the horizontal difference of the stress in both directions is generally larger than 8 MPa; two groups of natural fractures have developed in the study area. The horizontal stress difference between the two directions is large, generally greater than 8 MPa; two groups of natural fractures are developed in the study area, one group with a northwest‒southeast orientation and one group with a northeast‒southwest orientation. The density of natural fractures in the P1f slope of Mabei is 0.32–1.12 fractures/m, with an average of 0.58 fractures/m, which belongs to the medium-high degree of fracture development.
(2) Based on actual drilling geological data, a geological model and three-dimensional geomechanical model are established, and different schemes are designed to carry out single-parameter optimization. The optimization results show that the optimal cluster spacing for subdividing the cutting volumetric pressure of large-slope wells in the Fengcheng Formation of the Mabei Slope is 12 m, the optimal construction fluid volume is 1,400–1,600 m3/segment, the optimal construction displacement is 8 m3/min, and the optimal strength of sand addition is 2.5 m3/m.
(3) A comparison between the fracturing implementation effect and the fracturing scheme design proves that the artificial parameter optimization method for large inclined wells in shale oil with complex lithology proposed in this paper is feasible based on the finite element method in the basis of the regional stress background and the natural fracture development law.
(4) The advantages of this method are that it can solve the problems of geomechanical transformation and optimization of fracturing parameters faced by high inclination Wells in complex lithology reservoir environment. However, the disadvantages are that its application scope is Xinjiang oilfield area, and more data are needed to verify its wide application.
Data availability statement
The original contributions presented in the study are included in the article/Supplementary material, further inquiries can be directed to the corresponding author.
Author contributions
LH: Writing–original draft. BZ: Writing–review and editing. BC: Writing–review and editing. HW: Writing–review and editing. YW: Writing–review and editing. LP: Writing–review and editing. YH: Writing–review and editing.
Funding
The author(s) declare financial support was received for the research, authorship, and/or publication of this article. This study received funding from Science and Technology Project of Oil and Gas and New Energy Branch of petrochina Co., Ltd., “Risk Exploration Field and Target Research, Engineering Technology Research and Field Test in Junggar Basin.” The funder was not involved in the study design, collection, analysis, interpretation of data, the writing of this article or the decision to submit it for publication.
Conflict of interest
Authors LH, BC, and LP were employed by Research Institute of Engineering Technology (Supervision Company), PetroChina Xinjiang Oilfield Company. Author HW was employed by Emergency Rescue Center, PetroChina Xinjiang Oilfield Company. Author YH was employed by YuanwangJingsheng Technology (Beijing) Co., Ltd.
The remaining authors declare that the research was conducted in the absence of any commercial or financial relationships that could be construed as a potential conflict of interest.
Publisher’s note
All claims expressed in this article are solely those of the authors and do not necessarily represent those of their affiliated organizations, or those of the publisher, the editors and the reviewers. Any product that may be evaluated in this article, or claim that may be made by its manufacturer, is not guaranteed or endorsed by the publisher.
References
Abdelaziz, A., Ha, J., Li, M., Magsipoc, E., Sun, L., and Grasselli, G. (2023). Understanding hydraulic fracture mechanisms: from the laboratory to numerical modelling. Adv. Geo-Energy Res. 7 (1), 66–68. doi:10.46690/ager.2023.01.07
Chai, Y., and Yin, S. (2021). 3D displacement discontinuity analysis of in-situ stress perturbation near a weak faul. Adv. Geo-Energy Res. 5 (3), 286–296. doi:10.46690/ager.2021.03.05
Chen, H., Lv, Q., Gao, J., Yu, J., Pang, Y., Li, B., et al. (2022). The characteristics and controlling factors of glutenite reservoirs in the permian upper Urho Formation, southern zhongguai rise, Junggar Basin, NW China. Geol. J. 57 (1), 221–237. doi:10.1002/gj.4293
Dai, C., Huang, Y., Liu, C., Wu, Y., Zou, C., Yan, X., et al. (2023). Progress and prospect of fracturing fluid system for deep/ultra-deep reservoir reconstruction. J. China Univ. Petroleum (Edition Nat. Sci). 47 (4), 77–92.
He, W., Barzgar, E., Feng, W., and Huang, L. (2021). Reservoirs patterns and key controlling factors of the lenghu oil and gas field in the qaidam basin, northwestern China. J. Earth Sci. 32 (4), 1011–1021. doi:10.1007/s12583-020-1061-z
Huang, L., Wan, R., Zou, Y., Wan, M., Chang, Q., and Qian, Y. (2022). Accumulation characteristics of continuous sand conglomerates reservoirs of upper permian upper wuerhe formation on Manan slope area, Junggar Basin. Petroleum Geol. Exp. 44, 51–59. doi:10.11781/sysydz202201051
Hui, G., Chen, Z. X., Lei, Z. D., Song, Z. J., Zhang, L. Y., Yu, X. R., et al. (2023). A synthetical geoengineering approach to evaluate the largest hydraulic fracturing-induced earthquake in the East Shale Basin, Alberta. Petroleum Sci. 20 (1), 460–473. doi:10.1016/j.petsci.2023.01.006
Jia, Z., Peng, J., Lu, Q., Qiao, J., Wang, F., Zang, M., et al. (2022). Formation mechanism of ground fissures originated from the hanging wall of normal fault: a case in fen-wei basin, China. J. Earth Sci. 33 (2), 482–492. doi:10.1007/s12583-021-1508-x
Lavrov, A. (2003). The Kaiser effect in rocks: principles and stress estimation techniques. Int. J. Rock Mech. Min. Sci. 40 (2), 151–171. doi:10.1016/s1365-1609(02)00138-7
Li, L. G., He, H. Q., Fan, T. Z., Liu, H. N., Yang, T., Wan, L. K., et al. (2020). Oil and gas exploration progress and upstream development strategy of CNPC. China Pet. Explor. 25 (1), 1. doi:10.3969/j.issn.1672-7703.2020.01.001
Li, M. H., Zhou, F. J., and Huang, G. P. (2022). A finite element simulation method for multi-fracture propagation in horizontal wells based on fluid pipe element. J. China Univ. Pet. Ed. Nat. Sci. 46, 105–112.
Li, J., Yang, Z., Wang, Z., Tang, Y., Zhang, H., Jiang, W., et al. (2023). Quantitative characterization and main controlling factors of shale oil occurrence in permian Fengcheng Formation, Mahu sag, Junggar Basin. Petroleum Geol. Exp. 45 (4), 681–692. doi:10.11781/sysydz202304681
Liu, J., Ding, W., Yang, H., Dai, P., Wu, Z., and Zhang, G. (2023b). Natural fractures and rock mechanical stratigraphy evaluation in the huaqing area, ordos basin: a quantitative analysis based on numerical simulation. Earth Sci. 48 (7), 1–17.
Liu, J., Mei, L., Ding, W., Xu, K., Yang, H., and Liu, Y. (2023a). Asymmetric propagation mechanism of hydraulic fracture networks in continental reservoirs. GSA Bull. 135 (3-4), 678–688. doi:10.1130/b36358.1
Liu, J., Yang, H., Bai, J., Wu, K., Zhang, G., Liu, Y., et al. (2021). Numerical simulation to determine the fracture aperture in a typical basin of China. Fuel 283, 118952. doi:10.1016/j.fuel.2020.118952
Liu, J., Yang, H., Xu, K., Wang, Z., Liu, X., Cui, L., et al. (2022). Genetic mechanism of transfer zones in rift basins: insights from geomechanical models. GSA Bull. 134 (9-10), 2436–2452. doi:10.1130/b36151.1
Ma, T., Wang, H., Liu, Y., Shi, Y., and Ranjith, P. (2022). Fracture-initiation pressure model of inclined wells in transversely isotropic formation with anisotropic tensile strength. Int. J. Rock Mech. Min. Sci. 159, 105235. doi:10.1016/j.ijrmms.2022.105235
Meng, Q., Zhang, M., Han, L., Pu, H., and Chen, Y. (2018). Acoustic emission characteristics of red sandstone specimens under uniaxial cyclic loading and unloading compression. Rock Mech. Rock Eng. 51, 969–988. doi:10.1007/s00603-017-1389-6
Montgomery, C. T., and Smith, M. B. (2010). Hydraulic fracturing: history of an enduring technology. J. Petroleum Technol. 62 (12), 26–40. doi:10.2118/1210-0026-jpt
Osiptsov, A. A. (2017). Fluid mechanics of hydraulic fracturing: a review. J. petroleum Sci. Eng. 156, 513–535. doi:10.1016/j.petrol.2017.05.019
Ouenes, A., Umholtz, N. M., and Aimene, Y. E. (2016). Using geomechanical modeling to quantify the impact of natural fractures on well performance and microseismicity: application to the Wolfcamp, Permian Basin, Reagan County, Texas. Interpretation 4 (2), SE1–SE15. doi:10.1190/int-2015-0134.1
Peng, L. I., Xiong, J., Qi, Y., Zhu, Z., Liu, X., Wu, J., et al. (2022). Lithological influences to rock mechanical properties of permian Fengcheng Formation in Mahu sag, Junggar Basin. Petroleum Geol. Exp. 44 (4), 569–578. doi:10.11781/sysydz202204569
Shah, M. S., and Shah, S. N. (2023). Comparative assessment of mechanical and chemical fluid diversion techniques during hydraulic fracturing in horizontal wells. Petroleum Sci. doi:10.1016/j.petsci.2023.07.013
Shen, W., Xu, Y., Li, X., Huang, W., and Gu, J. (2016). Numerical simulation of gas and water flow mechanism in hydraulically fractured shale gas reservoirs. J. Nat. Gas Sci. Eng. 35, 726–735. doi:10.1016/j.jngse.2016.08.078
Soliman, M. Y., East, L., and Adams, D. (2008). Geomechanics aspects of multiple fracturing of horizontal and vertical wells. SPE Drill. Complet. 23 (03), 217–228. doi:10.2118/86992-pa
Tang, Y., Cao, J., He, W. J., Guo, X. G., Zhao, K. B., and Li, W. W. (2021). Discovery of shale oil in alkaline lacustrine basins: the late paleozoic Fengcheng Formation, Mahu sag, Junggar basin, China. Petroleum Sci. 18 (5), 1281–1293. doi:10.1016/j.petsci.2021.04.001
Wang, D. B., Qin, H., Wang, Y. L., Hu, J. Q., Sun, D. L., and Yu, B. (2023a). Experimental study of the temporary plugging capability of diverters to block hydraulic fractures in high-temperature geothermal reservoirs. Petroleum Sci. doi:10.1016/j.petsci.2023.07.002
Wang, H., Ma, T., Liu, Y., Wu, B., and Ranjith, P. (2023b). Numerical and experimental investigation of the anisotropic tensile behavior of layered rocks in 3D space under Brazilian test conditions. Int. J. Rock Mech. Min. Sci. 170, 105558. doi:10.1016/j.ijrmms.2023.105558
Wang, S., Wang, G., Huang, L., Song, L., Zhang, Y., Li, D., et al. (2021). Logging evaluation of lamina structure and reservoir quality in shale oil reservoir of Fengcheng Formation in Mahu Sag, China. Mar. Petroleum Geol. 133, 105299. doi:10.1016/j.marpetgeo.2021.105299
Warpinski, N. R., Mayerhofer, M. J., Vincent, M. C., Cipolla, C., and Lolon, E. (2009). Stimulating unconventional reservoirs: maximizing network growth while optimizing fracture conductivity. J. Can. Petroleum Technol. 48 (10), 39–51. doi:10.2118/114173-pa
Xiao, M., Wu, S., Yuan, X., and Xie, Z. (2021). Conglomerate reservoir pore evolution characteristics and favorable area prediction: a case study of the lower triassic baikouquan formation in the northwest margin of the Junggar Basin, China. J. Earth Sci. 32, 998–1010. doi:10.1007/s12583-020-1083-6
Xu, K. (2019). Current in-situ stress of gaoshangpu reservoir, nanpu Sag, bohai bay basin, China. East China: China University of Petroleum.
Xu, S. Q., Guo, J. C., Feng, Q. H., Ren, G., Li, Y., and Wang, S. (2022). Optimization of hydraulic fracturing treatment parameters to maximize economic benefit in tight oil. Fuel 329, 125329. doi:10.1016/j.fuel.2022.125329
Yang, C., and Liu, J. (2021). Petroleum rock mechanics: an area worthy of focus in geo-energy research. Adv. Geo-Energy Res. 5 (4), 351–352. doi:10.46690/ager.2021.04.01
Yang, Z. F., Tang, Y., Guo, X. G., Huang, L. L., Wang, Z. Q., and Zhao, X. M. (2021). Occurrence states and potential influencing factors of shale oil in the permian Fengcheng Formation of Mahu sag, Junggar Basin. Petroleum Geol. Exp. 43 (5), 784–796. doi:10.11781/sysydz202105784
Yao, J., Li, Z. H., LiuFan, L. J. W. P., Zhang, M., and Zhang, K. (2021). Optimization of fracturing parameters by modified variable-length particle-swarm optimization in shale-gas reservoir. SPE J. 26 (02), 1032–1049. doi:10.2118/205023-pa
Zhu, N., Cao, Y., Xi, K., Wu, S., Zhu, R., Yan, M., et al. (2021). Multisourced CO2 injection in fan delta conglomerates and its influence on reservoir quality: evidence from carbonate cements of the Baikouquan Formation of Mahu sag, Junggar Basin, northwestern China. J. Earth Sci. 32, 901–918. doi:10.1007/s12583-020-1360-4
Keywords: shale oil, lithologic reservoir, fracturing parameters, high-angle deviated hole, geomechanics
Citation: Hao L, Zhang B, Chen B, Wang H, Wu Y, Pan L and Huang Y (2023) Fracturing parameter optimization technology for highly deviated wells in complex lithologic reservoirs. Front. Energy Res. 11:1303521. doi: 10.3389/fenrg.2023.1303521
Received: 28 September 2023; Accepted: 24 November 2023;
Published: 07 December 2023.
Edited by:
Xiaojin Zheng, Princeton University, United StatesReviewed by:
Tianshou Ma, Southwest Petroleum University, ChinaJianhua He, Chengdu University of Technology, China
Copyright © 2023 Hao, Zhang, Chen, Wang, Wu, Pan and Huang. This is an open-access article distributed under the terms of the Creative Commons Attribution License (CC BY). The use, distribution or reproduction in other forums is permitted, provided the original author(s) and the copyright owner(s) are credited and that the original publication in this journal is cited, in accordance with accepted academic practice. No use, distribution or reproduction is permitted which does not comply with these terms.
*Correspondence: Binxin Zhang, emJ4NzIxQDEyNi5jb20=
 Lihua Hao1
 Binxin Zhang