
94% of researchers rate our articles as excellent or good
Learn more about the work of our research integrity team to safeguard the quality of each article we publish.
Find out more
ORIGINAL RESEARCH article
Front. Energy Res. , 30 October 2023
Sec. Sustainable Energy Systems
Volume 11 - 2023 | https://doi.org/10.3389/fenrg.2023.1301266
This article is part of the Research Topic Modeling Practice and Mechanism Design of Green Energy Systems towards Sustainable Development View all 18 articles
 Ru Sha1,2*
Distorted energy prices cause resource mismatch and hinder the coordinated development of economic growth and carbon emission reduction (CDEC) in China. Therefore, it is essential to determine the optimal levels of energy price distortions. This paper first measures the price distortions of fossil and renewable energy sources and applies a panel smooth transition regression model to assess the optimal threshold values for the degree of energy price distortions. The results show that 1) Fossil energy price distortions are negative, and the price distortion for renewable energy is positive. 2) Energy price distortions inhibit CDEC, and this effect is regionally heterogeneous. 3) The panel smooth transformation model results indicate that distorted energy prices have a nonlinear impact on CDEC. CDEC is significantly hampered in the low regime by distorted fossil energy prices and facilitated in the high regime. In contrast, the distorted renewable energy price shows positive in the low regime and negative in the high regime. We also obtain the optimal intervals for the degree of energy price distortions that promote CDEC. With the target of “growth” and “carbon reduction,” this study provides a reference for improving the energy pricing mechanism and exploring the effective ways of CDEC.
China’s economy has grown unprecedentedly due to reform and opening up. However, energy market reform has progressed relatively slowly and has “asymmetric” characteristics. As an essential input for national economic development (Cleveland et al., 1984; Stern, 1993), energy affects a country’s core competitiveness. For the sake of economic stability as well as strategic needs, energy prices in China have long been government-dominated, resulting in deviations from their equilibrium levels and more severe distortions (Lin and Du, 2013). The distorted energy prices do not reflect the actual energy cost, resource scarcity, and environmental externalities. As a result, energy supply and demand imbalances are exacerbated, resulting in excessive fossil fuel consumption while weakening resource allocation efficiency. Thus, it becomes a bottleneck restricting the coordinated development of economic growth and carbon emission reduction (CDEC) in China.
The emergence of distortions in energy prices in China has its unique historical background and realistic circumstances. Before the Reform and Opening-up, the “catching-up strategy” of prioritizing heavy industries and leveraging the country’s resource agglomeration advantage and mobilization capacity to manage factor allocation resulted in several institutional arrangements that skewed energy pricing (Lin, 1994). After that, the government was exceedingly cautious in reforming energy pricing for economic stability and growth, as the low energy price policy adopted not only maintained Chinese enterprises’ and products’ international competitiveness but also prevented price hikes and inflation. Moreover, under the pressure of GDP growth as the assessment performance, local governments will tighten the control of energy prices to achieve rapid economic growth. As a result, under the government-led pricing mechanism, energy prices are not fully created by supply and demand, resulting in price distortions. Compared to the more comprehensive market-based energy pricing mechanisms in industrialized nations, China’s market-based energy prices need further improvement.
China’s economy increased at a 6.6% annual pace from 2013 to 2021, faster than the world’s average annual growth rate of 2.6% during the same period, and its GDP contributed more than 30% to global economic growth, making it a significant powerhouse of global economic development. China’s economy has long run at a breakneck pace, relying on massive amounts of energy, capital, and labor factors, particularly excessive use of low-cost energy, resulting in a host of problems such as energy scarcity, carbon emissions, and environmental damage (Ouyang et al., 2018; Wang et al., 2019). The previous crude development paradigm of high input, high pollution, and low yield has highlighted the conflict between economic development and environmental optimization (Ge et al., 2023). As a crucial link between economic growth and carbon emission reduction, optimizing resource allocation by enhancing the energy pricing mechanism has become an efficient means of exploring CDEC (Song and Cui, 2016; Zhang and Adom, 2018).
Considering that distorted energy prices affect economic growth and reduction of carbon emissions via resource allocation (Restuccia and Rogerson, 2008; Bartelsman et al., 2013), which in turn threatens CDEC. Therefore, this paper proposes the following questions: Will energy price distortions inhibit CDEC? Whether correcting energy price distortions would promote CDEC, and whether there is an optimal level of distortions to achieve CDEC is a valuable research topic. China aspires to realize CDEC. Accordingly, the feasibility of achieving CDEC through energy pricing marketization policies has become a hot topic. As the world’s largest energy consumer and carbon emitter, China’s contradiction between economic development and environmental protection is relatively prominent (Wang and Feng, 2021). Unfortunately, existing research has concentrated on a single dimension of the economy or environment affected by energy price distortions. Existing studies rarely discuss the relationship between distorted energy prices and CDEC and rarely explore the possibility of the optimal level of distortion. With China’s energy price reform deepening, policymakers are exploring ways to keep energy price distortions at an optimal level to coordinate growth and emission reductions.
The contributions lie in the following aspects. First, this paper extends the measure of energy price distortions to the renewable energy sector, which systematically illustrates the evolutionary characteristics of distortions in energy prices and enriches the studies on the measurement of distortions. Second, this study estimates the effects of energy price distortions on CDEC and regional heterogeneity, which effectively expands the research on the relationship between energy price distortions and CDEC and provides a reference for exploring effective ways to achieve CDEC. Third, this paper extends the analysis of the nonlinear relationship between distorted energy prices and CDEC and estimates the optimal intervals in which energy price distortions promote CDEC, providing a basis for the degree of distortion correction and the selection of an appropriate correction strategy.
The rest of the paper is arranged as follows. Section 2 conducts a review of the relevant literature. Section 3 shows the research methodology and discusses the construction of the panel smooth transformation model. Section 4 provides the empirical results. The conclusions and policy implications are listed in Section 5.
When actual energy prices deviate from their equilibrium level under distortions, energy cannot achieve Pareto optimal resource allocation (Lin and Wang, 2009; Wang et al., 2009; Li et al., 2020). Most studies often regard energy as a factor to examine the degree of price distortions (Atkinson and Cornwell, 1998; Tao et al., 2009). Lin and Du (2015) used a marketization index to measure the degree of factor price distortions, including energy. Skoorka (2000) employs a production frontier analysis that measures factor price distortions using the gap between actual and potentially optimal production points. Subsequently, several studies have used the shadow price approach to measure factor price distortions (Atkinson and Halvorsen, 1984; Ouyang and Sun, 2015). Based on a shadow price model, Tao et al. (2009) found that energy prices were severely distorted in China’s industrial sector, second only to labor price distortion. The production function approach is the most commonly used method to calculate factor price distortions. Ouyang et al. (2018), Tan et al. (2019), and Guan and Xing (2022) measure energy price distortions using the Cobb-Douglas production function. Moreover, using other methods, some scholars measured the price distortions of different energy products such as coal, electricity, and natural gas (Chai et al., 2009; Brown et al., 2017; Cui and Wei, 2017; Shi and Sun, 2017).
Two opposing opinions exist on distorted energy prices affecting economic growth: the “inhibition view” and the “promotion view.” The “inhibition view” argues that distorted energy prices hinder economic growth by impeding the efficient allocation of energy sources (Brandt et al., 2013; Shi and Sun, 2017). Lin and Wang (2009) pointed out that energy prices are mainly government-led and have been low for a long time in China. Regulations enacted in 2008 preventing refined oil and natural gas from adjusting prices have led to distorted energy prices that harm the economy. Ju et al. (2017) suggested that distorted energy prices significantly impeded China’s economy. According to the “promotion view,” energy price distortions promote economic growth. Distortions transmit the wrong price signals, leading to an underestimation of energy prices (Lin and Jiang, 2011; Ouyang and Sun, 2015) and thus a significant reduction in production costs. The high consumption of low-cost energy stimulates economic growth in the short term. Ouyang et al. (2018) found that firms obtained production factors at lower costs when energy prices are distorted, thereby promoting economic growth. Sun and Lin (2013) suggested that government regulations on energy prices have contributed to economic development by reducing excessive increases in energy prices.
Studies have concluded that price distortions promote carbon emissions. Distorted energy prices have reduced costs significantly, but they have also led to excessive consumption of high-emission, high-polluting sources, increasing carbon emissions. The IMF (2013) report suggested that price distortions undermined the allocation of resources by stimulating the overconsumption of energy, and therefore exacerbating carbon emissions. Wang et al. (2019) suggested that distorted oil prices promote CO2 emissions in China’s transportation sector. Li et al. (2019) analyzed the effects of energy prices and population on environmental pollution in China by constructing a time-varying coefficient panel data model, and concluded that energy price distortions exacerbated environmental pollution.
CDEC refers to reducing carbon emissions while ensuring economic development goals (Pata and Aydin, 2020). Previous studies rarely explored how distorted energy prices affect CDEC, and scholars mainly focused on the influence of price distortions on energy resource allocation efficiency. Distorted energy prices reduce the efficiency of energy resource allocation (Ouyang et al., 2018; Lin and Chen, 2019). As China’s economy enters a new growth model emphasizing efficiency, accelerating market-oriented reforms in energy pricing becomes urgent (Dai and Cheng, 2016). Tan et al. (2019) found that relative price distortions between capital and energy, labor and energy, inhibit the improvement of total factor energy efficiency in China’s secondary industry. Sha et al. (2021) showed the inhibiting effect of fossil energy price distortions on green economic efficiency in China. According to Gao and Yuan (2022), energy price distortions significantly hindered industrial green productivity in China. The optimal allocation of energy resources has become a significant determinant in the achievement of CDEC. Considering that price distortions lead to misallocating energy resources, which hinders CDEC. To achieve CDEC, exploring the characteristics of energy price distortions and their impact on CDEC is necessary.
By sorting out the above literature, this paper concludes: First, energy is typically considered a factor in previous studies to measure the distortion of prices, ignoring different energy products’ price distortion characteristics. Some studies have measured and analyzed the distortions in fossil energy prices, but none have analyzed the renewable energy price distortion. Second, most studies generally concentrated on the effects of distorted energy prices on a single dimension of the economy or the environment without examining both aspects simultaneously. The achievement of CDEC is an essential prerequisite for China’s high-quality economic development and an important manifestation of the country’s independent emissions reduction. The theoretical basis of this paper is mainly based on the literature on energy price distortions and resource misallocation, which inspires this study to adopt a new perspective that energy price distortions affect CDEC by influencing energy resource allocation. As distortions negatively affect the economy and carbon reduction, it is necessary to explore further ways of encouraging CDEC under the constraints of distortions. Third, the existing literature seldom discusses the nonlinear effects of energy price distortions and the potential for correcting distortions. Owing to the historic reform of energy prices and the complex structure and size of the energy industry, the relationship between distorted energy prices and CDEC is more complex than linear. Therefore, exploring the nonlinear effects of energy price distortions and analyzing the optimal levels for moderate correction of energy price distortions is necessary.
This paper introduces a frontier method that deals with nonlinear relationships between variables, namely, the panel smooth transformation model (PSTR). It can handle nonlinear relationships with sharp or smooth switches between variables without existing information about structural changes in transition variables (Ulucak et al., 2020). Based on the panel threshold model proposed by Hansen (2000), the PSTR model not only inherits its advantages but also avoids the drawback that the indicator function of interval division can only take 0 or 1. The PSTR model has two advantages: First, it allows parameter variation across individuals and over time (Tiba, 2019; Pan et al., 2021). Second, the model has strong applicability in the case of endogeneity and nonlinear effects. The model is depicted below.
In Eq. 2,
Before performing PSTR model estimation, testing whether the model has nonlinearity features is necessary. According to the study of Gonzlez et al. (2005), the following auxiliary regression function needs to be constructed at the first-order Taylor expansion of
where
If the null hypothesis H0:
This paper applies the marginal opportunity cost pricing approach to the measurement of the theoretical price of fossil energy.
MPC (Marginal Production Cost) is associated with energy extraction; MUC (Marginal User Cost) corresponds to the expense spent for immediate use (Serafy, 1981). MEC (Marginal External Cost) indicates the degree of environmental damage caused by exploiting energy resources (Chen et al., 2005; Lei, 1996).
Based on the measures of Ju et al. (2019) and Sha et al. (2022), this paper calculates the degrees of price distortions for the four energy sources, and the data sources are similar to that literature. The degree of fossil energy price distortions is calculated using the deviation between the actual and theoretical energy prices, as follows.
where
The distortion in renewable energy price (
where
Based on coupling theory and coordination theory, this paper builds a coupled coordination degree model for measuring the degree of CDEC, which is expressed in the following way.
Where
The degree of CDEC is used as the dependent variable. Based on the basic principles of science, feasibility, and hierarchy (Li and Yi, 2020; Wu, 2021), this paper constructs the evaluation indicator system for economic growth and carbon emission reduction as follows (Table 1):
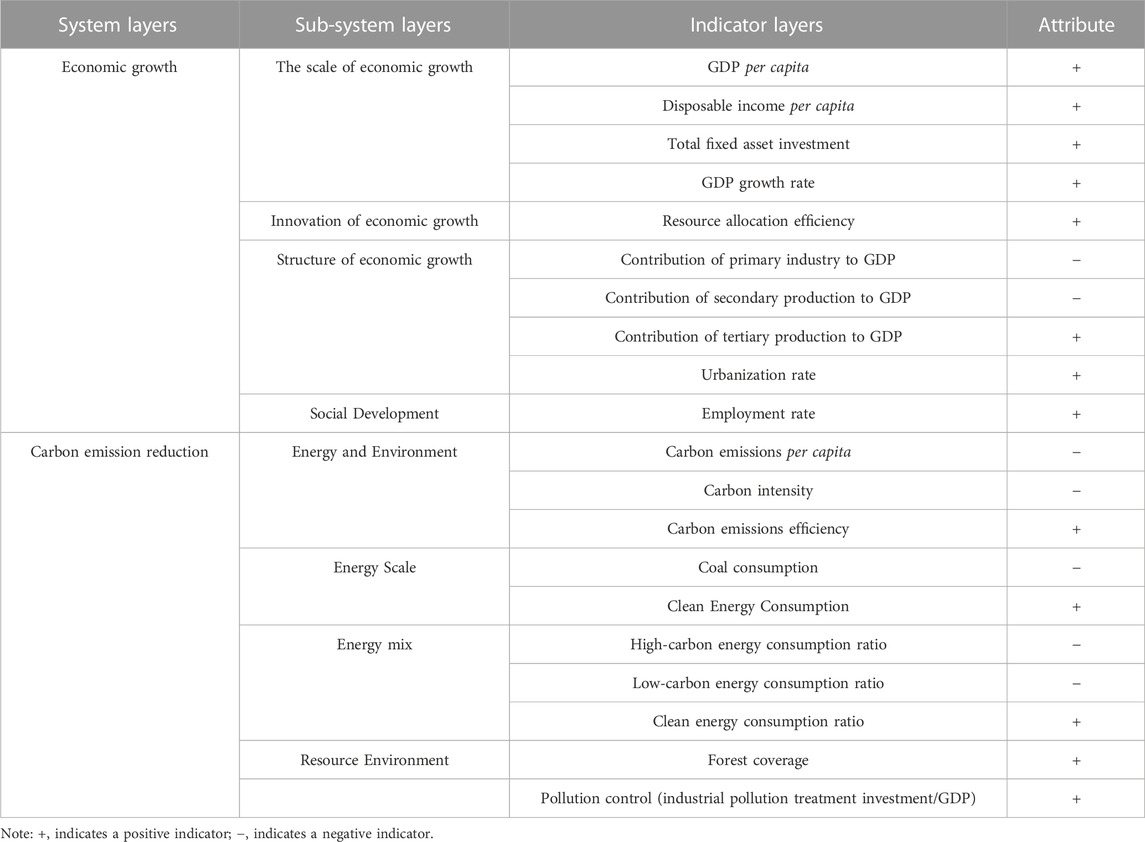
TABLE 1. Evaluation indicator system for economic growth and carbon emission reduction.
The degree of openness (Open) and the total exports and imports to GDP, ratio is used to represent this variable. Industrial structure (Indus) is measured by the share of value added of secondary industry in the GDP, of each province. The provincial population at the end of the year serves as a proxy for population (Pop). Urbanization (Urban) is measured as the proportion of the population that lives in urban areas.
This paper adopts the panel data of 30 provinces in Mainland China (except Tibet) from 2006 to 2020. Data related to the calculation of energy price distortions and other data mentioned above are from the CEIC, database, Price Statistical Yearbook, Annual BP, statistical yearbook, Annual Reports of China Shenhua Energy Company Limited, National Bureau of Statistics, Annual Reports of China National Petroleum Corporation, Wind database, National Energy Administration, China Energy Statistical Yearbook, China Environmental Statistical Yearbook, China Statistical Yearbook, provincial statistical yearbooks, and Almanac of China Guodian Corporation.
Table 2 shows that the prices of all four energy products are distorted. Fossil energy prices are negatively distorted, with coal (−0.171) being the highest, with oil (−0.090) and natural gas (−0.058) following closely behind; renewable energy price distortion is positive, at 0.541. The negative distorted fossil energy prices indicate that the current energy pricing policy implemented by the government keeps fossil energy prices low for a long time to reduce production costs, stimulate rapid economic development, and maintain the international competitiveness of Chinese products.
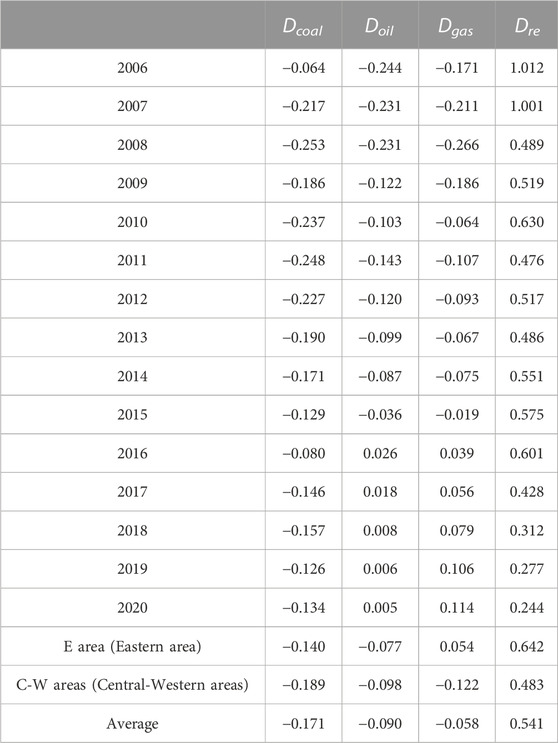
TABLE 2. Average price distortions of four energy products over the period 2006–2020.
Several reasons contribute to the highest degree of coal price distortion. First, coal still dominates the energy consumption mix in China, with coal consumption accounting for 56.9%1 of total energy consumption in 2020. Although coal plays an imperative role in industrial development, its high environmental cost causes the price difference between its actual price and theoretical benchmark to grow. Second, the competitive function of the coal pricing mechanism has not been fully released. Coal trading market transactions are still far from getting to the requirements of a national unified market. Third, after nearly 5 years of downward price movement, the supply-side capacity clearing overlaid with the capacity removal policy, China’s coal prices have been upward since 2016. To stabilize coal prices, the National Development and Reform Commission (NDRC) adopted a “benchmark price + floating price” pricing method for LCCs (Zuo, 2018). Therefore, the coal price is still under control, with a gap with the expected market-based price mechanism.
Negative distortions in oil and gas prices indicate that the prices are not fully marketized (Rioux et al., 2019; Lin and Kuang, 2020). As the Chinese government has been reforming oil prices since 1998, the pace of marketization was slow. However, the oil price distortion decreased by 46.8% in 2009, indicating that reforming refined oil prices in 2009 was crucial to alleviating distortions (Lin and Ouyang, 2014; Zhu and Chen, 2019). Natural gas has a lower MEC and is less distorted than other fossil fuels. Natural gas price distortion declined significantly in 2010, down 65.6% from the previous year, primarily owing to the 2010 natural gas resource tax reform. However, the reform of the market-based mechanism of natural gas pricing is still lagging, so its price distortion still exists.
The positive distorted renewable energy price implies that its actual price is larger than the theoretical benchmark, which the following reasons may cause. First, renewable energy is most commonly converted into electricity (Jiang et al., 2020; Lin and Xu, 2021). Electricity market price reform needs to be faster, which restricts the formation of the market-oriented pricing mechanism of renewable energy, causing apparent distortions. Second, due to technology, scale, and market, the investment in R&D of renewable energy is high, leading to a high power generation cost (Ge et al., 2022). Compared with coal-fired power generation, renewable energy electricity prices lack a competitive advantage (Zhao et al., 2011; Trujillo-Baute et al., 2018). Third, renewable energy generation accounts for a small percentage of total energy production. Because renewable energy is intermittent and discontinuous, its quality is inferior to conventional energy. It is still necessary to subsidize renewable energy development. While subsidies can help cover high costs, the gap between the subsidized funds and the cost of renewable energy continues to widen (Zhang et al., 2020), further reducing the competitiveness of renewable energy.
The data used to calculate energy price distortions in this paper are from Sha et al. (2022), but unlike that, the time span is updated to 2020. There are several reasons for updating the time period: 1) To accurately measure the degrees of distortions and present more current information on energy price distortions in China. The results show that the degree of energy price distortions is coal (−0.171), oil (−0.090), natural gas (−0.058), and renewable energy (0.541), lower than coal (0.177), oil (−0.105), natural gas (0.084) and renewable energy (0.585) in the previous study. This result confirms that China’s energy price distortions gradually improve as the market-based energy pricing reform deepens. 2) After updating the time period, it is shown that price distortions for coal, oil, and renewable energy, have continued to decrease. However, natural gas price distortion has been increasing. The result indicates that reforming the market-based mechanism of natural gas pricing among fossil energy sources is lagging. Compared to the previous article, the updated time period reveals the significance of this result. 3) Updating the time span not only enriches the information conveyed by the data but also shows the impact of the energy price reform policies implemented by the Chinese government on the degrees of energy price distortions, which helps this paper to analyze the current situation of energy price distortions in China.
The average values of distortions across regions show that fossil energy price distortions are higher in the C-W areas than in the E area. However, the opposite result is observed for renewable energy price distortion. The results prove that China’s energy market is regional, coinciding with the study by Ma and Oxley (2011).
(1) National level
The national average value of CDEC is 0.436, which means China’s CDEC belongs to the transitional phase of the grinding process. As shown in Figure 1, the mean value of the national CDEC is increasing, rising from 0.387 in 2006 to 0.478 in 2020, an increase of 23.42%. This result indicates that the interaction between our economic growth and carbon reduction system is strengthened. The government’s awareness of the importance of coordinating economic growth with carbon emission reduction is a significant reason. With the introduction of the concept of green development in the 11th Five-Year Plan, the government has begun to formulate and implement measures to reduce carbon emissions and balance economic growth and reduction efforts.

FIGURE 1. Trends in CDEC at the national level during 2006–2020.
(2) Regional level
Figure 2 presents apparent differences in CDEC degree among regions in China, showing high levels in the E area and low levels in the C-W areas, which aligns with the study of Weng et al. (2022). The mean value of CDEC in the E area is 0.448, which is higher than the national average and the C-W areas (0.429). The main reason for the difference is the higher economic agglomeration in the E area and the high investment in emissions reduction technology and environmental protection. High-energy-consuming enterprises are clustered in the C-W areas. Thus, the industrial structure of the C-W areas is unreasonable, economic development relies on resource development, and environmental protection needs to be more protected, resulting in low CDEC. A trend of increasing CDEC has been observed in the C-W areas between 2016 and 2019, probably attributed to the significant effect of removing production capacity in coal and steel industries during the 13th Five-Year Plan period. CDEC of the E area rose again after 2019, undoubtedly related to the region’s good economic base, energy technology innovation, and other factors.
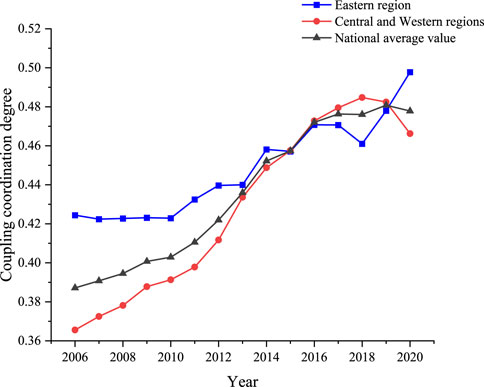
FIGURE 2. Trends in CDEC at the regional level during 2006–2020.
Table 3 indicates that the coefficients of
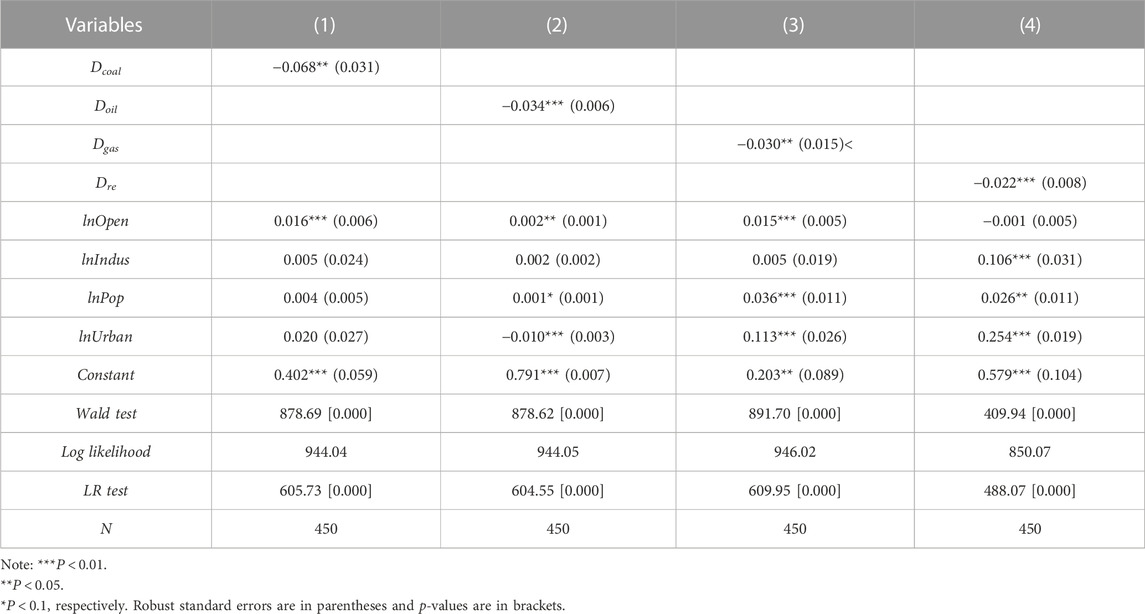
TABLE 3. The effects of energy price distortions on the national CDEC.
Specifically, coal price distortion has the most significant inhibiting effect on CDEC. Distorted energy prices fail to reflect the scarcity of energy resources, the actual supply and demand, and environmental externalities, which weakens the resource allocation efficiency and results in a loss of economic output while exacerbating the high-carbon energy consumption, thereby inhibiting CDEC. Coal price distortion has the most significant negative impact on CDEC, which can be explained by the fact that coal remains China’s dominant energy source. Due to the long-term reliance on coal resources, the industry forms a monopoly with a single economic structure. With an imperfect market trading mechanism, coal price distortion hinders CDEC. Furthermore, most control variable results align with this paper’s expectations.
In Table 4, all distorted energy prices in the E and C-W areas significantly negatively impact CDEC, indicating that energy price distortions hinder regional CDEC. Distorted oil, gas, and renewable energy prices impede CDEC of the E area. Due to the “cumulative cycle effect,” both the pace and scale of economic development in the E area have increased, boosting the demand for oil, gas, and renewable energy. Thus, the hindering effects of these three energy price distortions are more significant. There is a more significant inhibiting impact of coal price distortion on CDEC in the C-W areas, mainly because its industrial mix is dominated by coal, and the distorted coal price contributed significantly to its economic development, thereby increasing dependence on coal. The inertia of the crude development model has slowed the restructuring of the industrial structure in the C-W areas, and backward production cannot generate substantial economic benefits. Additionally, the C-W areas lack sufficient investments in the R&D of clean energy technologies, which hinders emissions reduction efforts.
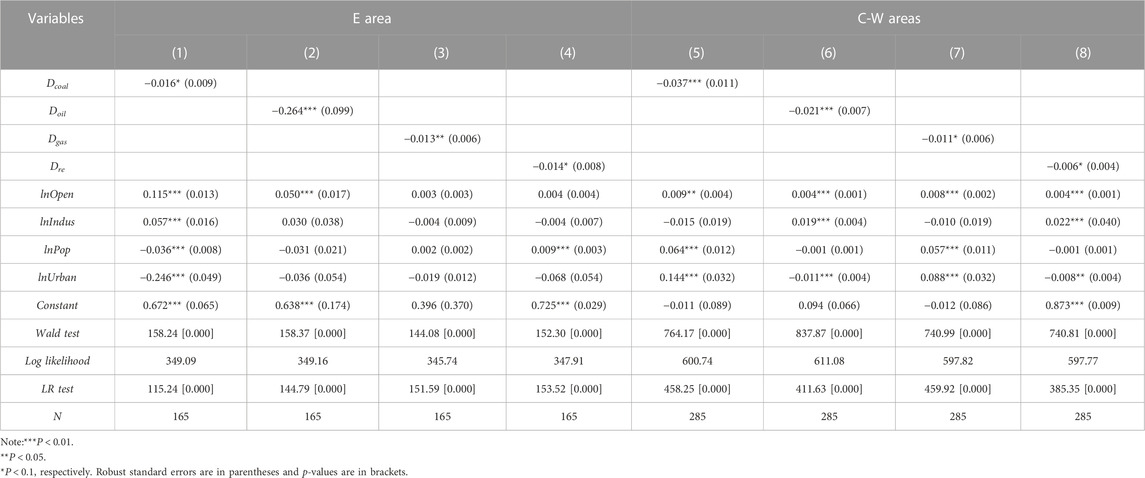
TABLE 4. The impact of energy price distortions on the regional CDEC.
The replacement of core variables, sub-sample regression, and the generalized method of moments for robustness tests are applied to test the robustness of the basic regressions. First, use green total factor productivity to replace the dependent variable (CDEC). Second, according to each province’s marketization degree and market mechanism, the total sample is divided into the developed and post-developed provinces. Third, because of the possible bias in estimation due to endogeneity issues, this paper employs the differential GMM method (DIF-GMM) and system GMM method (SYS-GMM) for robustness tests. Overall, the three robustness estimations demonstrate that energy price distortions inhibit CDEC, indicating that the model estimates are robust.
Table 5 presents the results of linear and nonlinear residual tests. The results of linearity tests show that the LM, LMF, and LRT tests of the four energy price distortions reject the null hypothesis
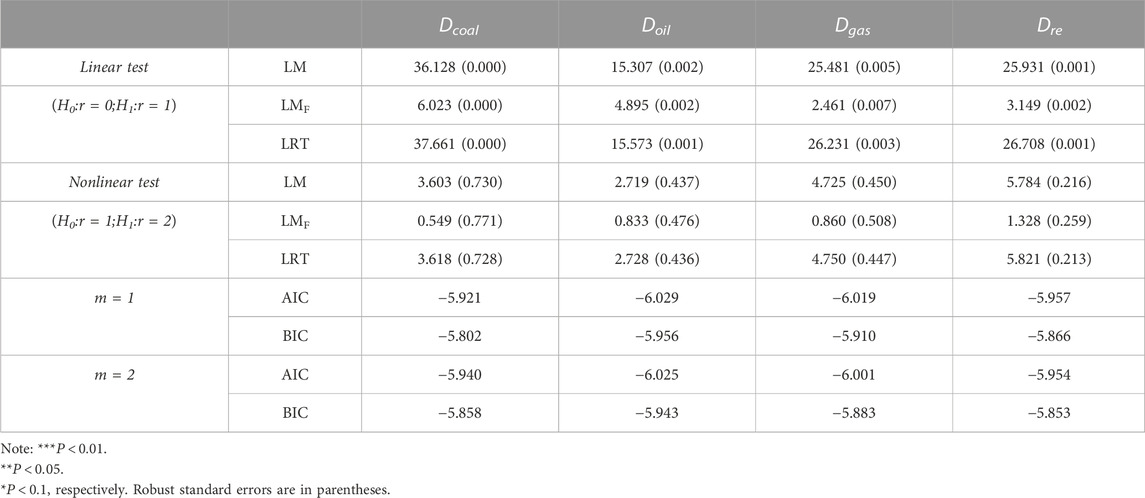
TABLE 5. Results of linear and nonlinear tests of the PSTR model.
From the PSTR results in Table 6, the location parameters of the models in which
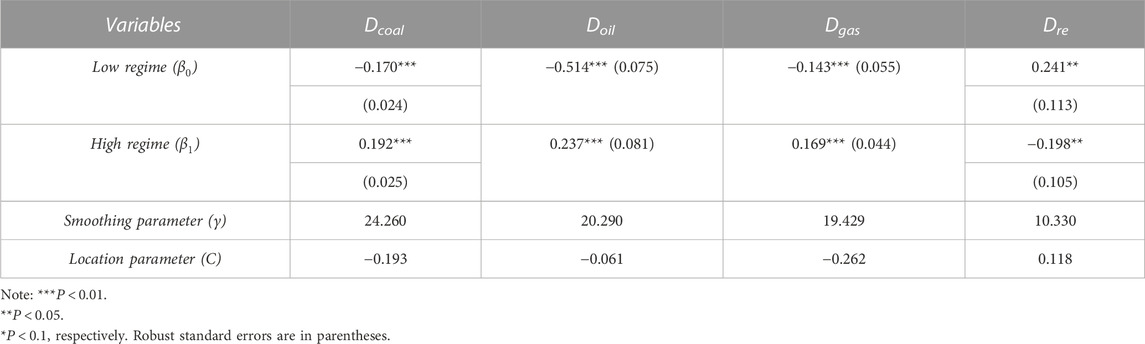
TABLE 6. Estimation results of the PSTR model.
Specifically, when
Based on different smoothing parameters and location parameters, the transformation functions of energy price distortions are shown in Figure 3. The transformation functions of distortions for all energy products’ prices exhibit a gradual change, which indicates that the choice of the PSTR model is reasonable.
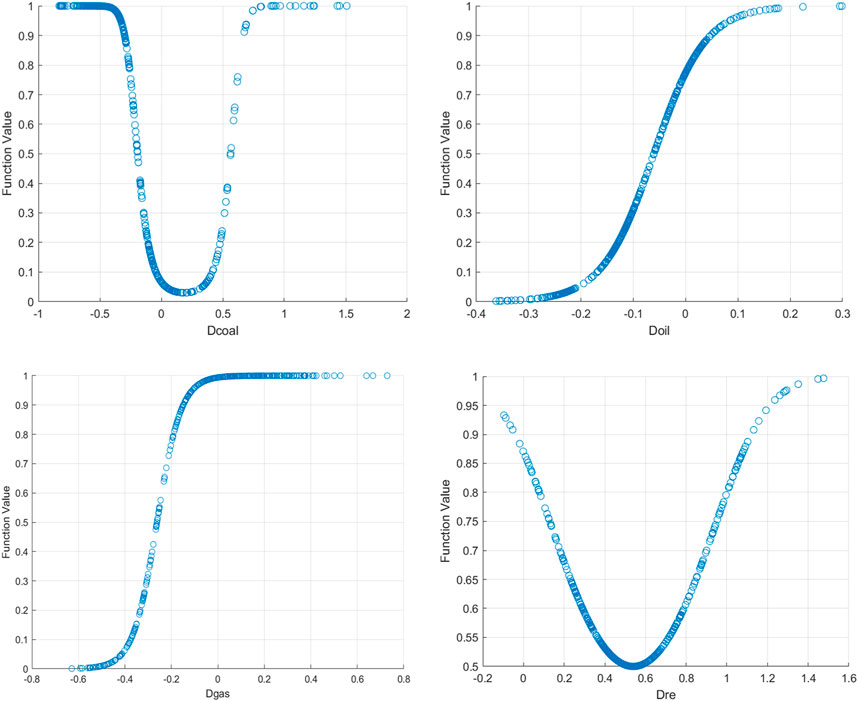
FIGURE 3. Transformation functions of energy price distortions.
The PSTR results indicate that the impact of the four energy price distortions on CDEC is not monotonically facilitated or inhibited. The higher the fossil energy price distortions, the more pronounced the inhibiting effect on CDEC. The degree of CDEC is higher when the distorted renewable energy price is lower. This result is similar to the study of Du et al. (2021). According to Du et al. (2021), the nonlinear effect of energy price distortions on CDEC may be attributed to the reduced marginal contribution of energy price distortions to the constraint effect of CDEC. Furthermore, the effective intervals in which price distortions for different energy types contribute to CDEC are coal price distortion
This paper estimates the impact of price distortions of four energy products on CDEC in China and further analyzes the nonlinear effects of distortions.
Following are the main conclusions. 1) The prices of all four types of energy are distorted. Fossil energy price distortions are negative, with coal (−0.171) being the highest, with oil (−0.090) and natural gas (−0.058) following closely behind. Renewable energy price distortion is positive at 0.541. 2) The national CDEC of economic growth and reduction of carbon emissions has an average value of 0.436 during the study period, which belongs to the teething process of the transition phase. CDEC is uneven across regions in China, showing high in the E area and low in the C-W areas. 3) Distorted energy prices inhibit CDEC in China, and there are differences in the effects of price distortions of different energy products. Distorted coal price has the most significant inhibitory impact on CDEC. Additionally, the impact of distortions on CDEC is regionally heterogeneous. Distorted oil, natural gas, and renewable energy prices impede eastern China’s CDEC. In contrast, distorted coal price has a more substantial impeding effect on the C-W areas’ CDEC. 4) Distorted energy prices exert a nonlinear impact on CDEC. The results of the PSTR model show that with the continuous correction of energy price distortions, the role of the promotional impact on CDEC gradually increases. Furthermore, the optimal intervals of distortions to promote CDEC are coal price distortion
Based on the empirical results, this paper proposes the following policy recommendations.
First, improving the market mechanism of energy prices and building a national unified price system. Coordinate the pace of pricing market reform of different energy products and rationalize the price ratios between various types of energy, such as fossil and renewable energy. According to the national unified large market construction guidance, accelerate the construction of a multi-energy systematized pricing mechanism and establish a unified system of energy prices to enhance the effective transmission of prices between the different types of energy. With the establishment of an energy pricing mechanism that reflects environmental externalities, resource scarcity, and supply and demand, energy price distortions can be corrected to obtain an optimal allocation of energy resources and ultimately achieve CDEC.
Second, formulating differentiated regional policies of energy prices. For eastern China, it should allow the market to play a fully effective role in energy pricing, reduce inefficient or even ineffective policy measures, guide enterprises to accelerate the renewal of energy-efficient capital and maximize the benefits of energy input. For the central-western areas, the dominance of energy pricing should gradually shift from the government to the market, making energy prices reflect the actual supply and demand and the scarcity of energy resources. Use of market-based instruments to regulate energy prices, unblock the impact of energy prices on demand, and provide more support for investment policies to increase access to financing and channels for energy companies to renew their capital. Moreover, it should break up the energy market’s division, encourage the energy factor’s free movement across regions, ensure that energy resources are allocated effectively, and promote CDEC.
Third, strategies to correct energy price distortions should be optimized. The estimation indicates that energy price distortions nonlinearly impact CDEC. Therefore, the government should clarify the policy measures and implementation efforts for adjusting energy prices in light of energy price distortions. With the changes in energy prices domestically and internationally, it is prudent to grasp the level of price deregulation and release of market-driven intensity. In this regard, the government should determine what level of price distortions to correct for different energy products and how to adjust them according to the economic development and emission reduction realities at the national, regional, and provincial levels. Taking the results of the optimal levels of energy price distortions in this paper as a reference, the government should actively promote the energy market-based pricing mechanism, adhere to the resource tax reform, and optimize energy price subsidies. In addition, efforts should be made to develop the digital economy, improve the construction of the carbon market, promote technological innovation, and alleviate distortions in energy prices so that the market-based mechanism can play a leading role in CDEC.
Although this study provides a valuable exploration of the relationship between energy price distortions and CDEC, due to the availability of data, the subject of this paper does not deeply explore the issue of relative energy price distortions. The relative distortions between energy product prices may affect the consumption proportionality of energy sources, thereby influencing CDEC. Therefore, it is necessary to analyze the relative energy price distortions further to understand the interactions between the prices of different energy products, which could provide a more detailed characterization of energy price distortions in China. Furthermore, it will be significant for policymakers if the study scope is expanded from China to emerging economies in future research.
The raw data supporting the conclusion of this article will be made available by the authors, without undue reservation.
RS: Conceptualization, Data curation, Funding acquisition, Methodology, Project administration, Validation, Writing–original draft, Writing–review and editing.
The author(s) declare financial support was received for the research, authorship, and/or publication of this article. This work is supported by the National Social Science Foundation of China (Grant No. 20XJL012) and 2023 Intramural Cultivation Program of Philosophy and Social Sciences at Xinjiang University (Grant No. 23CPY017).
The author declares that the research was conducted in the absence of any commercial or financial relationships that could be construed as a potential conflict of interest.
The handling editor JZ declared a shared affiliation with author RS at the time of the review.
All claims expressed in this article are solely those of the authors and do not necessarily represent those of their affiliated organizations, or those of the publisher, the editors and the reviewers. Any product that may be evaluated in this article, or claim that may be made by its manufacturer, is not guaranteed or endorsed by the publisher.
CDEC, Coordinated development of economic growth and carbon emission reduction; MPC, Marginal Production Cost; MUC, Marginal User Cost; MEC, Marginal External Cost; PSTR, Panel smooth transformation model; E area, Eastern area; C-W areas, Central-Western areas.
1Data source: National Bureau of Statistics. http://www.stats.gov.cn/tjsj/.
Atkinson, S. E., and Cornwell, C. (1998). Profit versus cost frontier estimation of price and technical inefficiency: a parametric approach with panel data. South. Econ. J. 64 (3), 753–764. doi:10.2307/1060791
Atkinson, S. E., and Halvorsen, R. (1984). Parametric efficiency tests, economies of scale, and input demand in US electric power generation. Int. Econ. Rev. 25, 647–662. doi:10.2307/2526224
Bartelsman, E., Haltiwanger, J., and Scarpetta, S. (2013). Cross-country differences in productivity: the role of allocation and selection. Am. Econ. Rev. 103 (1), 305–334. doi:10.1257/aer.103.1.305
Brandt, L., Tombe, T., and Zhu, X. (2013). Factor market distortions across time, space and sectors in China. Rev. Econ. Dyn. 16 (1), 39–58. doi:10.1016/j.red.2012.10.002
Brown, D. P., Eckert, A., and Eckert, H. (2017). Electricity markets in transition: market distortions associated with retail price controls. Electr. J. 30 (5), 32–37. doi:10.1016/j.tej.2017.04.010
Chai, J., Guo, J. E., Wang, S. Y., and Lai, K. K. (2009). Why does energy intensity fluctuate in China? Energy Policy 37 (12), 5717–5731. doi:10.1016/j.enpol.2009.08.037
Chen, L., Xing, Z., and Li, N. (2005). The environmental value of wind power. Renew. energy (05), 50–52. (in Chinese).
Cleveland, C. J., Costanza, R., Hall, C. A., and Kaufmann, R. (1984). Energy and the US economy: a biophysical perspective. Science 225 (4665), 890–897. doi:10.1126/science.225.4665.890
Cui, H., and Wei, P. (2017). Analysis of thermal coal pricing and the coal price distortion in China from the perspective of market forces. Energy Policy 106, 148–154. doi:10.1016/j.enpol.2017.03.049
Dai, X., and Cheng, L. (2016). Market distortions and aggregate productivity: evidence from Chinese energy enterprises. Energy Policy 95, 304–313. doi:10.1016/j.enpol.2016.05.009
Du, W., Li, M., Li, K., and Lin, J. (2021). Impact of energy market distortions on the productivity of energy enterprises in China. Energy J. 42 (4). doi:10.5547/01956574.42.4.wdu
Gao, K., and Yuan, Y. (2022). Does market-oriented reform make the industrial sector “Greener” in China? Fresh evidence from the perspective of capital-labor-energy market distortions. Energy 254, 124183. doi:10.1016/j.energy.2022.124183
Ge, T., Cai, X., and Song, X. (2022). How does renewable energy technology innovation affect the upgrading of industrial structure? The moderating effect of green finance. Renew. Energy 197, 1106–1114. doi:10.1016/j.renene.2022.08.046
Ge, T., Li, C., Li, J., and Hao, X. (2023). Does neighboring green development benefit or suffer from local economic growth targets? Evidence from China. Econ. Model. 120, 106149. doi:10.1016/j.econmod.2022.106149
Gonzlez, A., Tersvirta, T., and van Dijk, D. (2005). Panel smooth transition regression models. Research Paper 165. Quantitative Finance Research Centre. Sydney: University of technology.
Guan, H., and Xing, M. (2022). Impact of energy price distortion on green TFP based on spatial econometric model. Math. Problems Eng. 2022, 1–8. doi:10.1155/2022/1117675
Hansen, B. E. (2000). Sample splitting and threshold estimation. Econometrica 68 (3), 575–603. doi:10.1111/1468-0262.00124
Jiang, Z., Lyu, P., Ye, L., and wenqian Zhou, Y. (2020). Green innovation transformation, economic sustainability and energy consumption during China’s new normal stage. J. Clean. Prod. 273, 123044. doi:10.1016/j.jclepro.2020.123044
Ju, K., Su, B., Zhou, D., and Wu, J. (2017). Does energy-price regulation benefit China's economy and environment? Evidence from energy-price distortions. Energy Policy 105, 108–119. doi:10.1016/j.enpol.2017.02.031
Ju, K., Wang, Q., Liu, L., and Zhou, D. (2019). Measurement of the price distortion degree for exhaustible energy resources in China: a discount rate perspective. Emerg. Mark. Finance Trade 55 (12), 2718–2737. doi:10.1080/1540496x.2019.1587708
Lei, M. (1996). Study on integrated accounting between economy and natural resources (II)—— index Formation. Syst. Engineering-Theory Pract. (10), 91–98. (in Chinese).
Li, H., Huang, J., Hu, Y., Wang, S., Liu, J., and Yang, L. (2021). A new TMY generation method based on the entropy-based TOPSIS theory for different climatic zones in China. Energy 231, 120723. doi:10.1016/j.energy.2021.120723
Li, K., Fang, L., and He, L. (2019). How population and energy price affect China's environmental pollution? Energy Policy 129, 386–396. doi:10.1016/j.enpol.2019.02.020
Li, K., Fang, L., and He, L. (2020). The impact of energy price on CO2 emissions in China: a spatial econometric analysis. Sci. Total Environ. 706, 135942. doi:10.1016/j.scitotenv.2019.135942
Li, W., and Yi, P. (2020). Assessment of city sustainability—coupling coordinated development among economy, society and environment. J. Clean. Prod. 256, 120453. doi:10.1016/j.jclepro.2020.120453
Lin, B., and Chen, Y. (2019). Does electricity price matter for innovation in renewable energy technologies in China? Energy Econ. 78, 259–266. doi:10.1016/j.eneco.2018.11.014
Lin, B., and Chen, Z. (2018). Does factor market distortion inhibit the green total factor productivity in China? J. Clean. Prod. 197, 25–33. doi:10.1016/j.jclepro.2018.06.094
Lin, B., and Du, K. (2015). Energy and CO2 emissions performance in China's regional economies: do market-oriented reforms matter? Energy Policy 78, 113–124. doi:10.1016/j.enpol.2014.12.025
Lin, B., and Du, K. (2013). The energy effect of factor market distortion in China. Econ. Res. J. 48 (09), 125–136. (in Chinese).
Lin, B., and Jiang, Z. (2011). Estimates of energy subsidies in China and impact of energy subsidy reform. Energy Econ. 33 (2), 273–283. doi:10.1016/j.eneco.2010.07.005
Lin, B., and Ouyang, X. (2014). A revisit of fossil-fuel subsidies in China: challenges and opportunities for energy price reform. Energy Convers. Manag. 82, 124–134. doi:10.1016/j.enconman.2014.03.030
Lin, B. Q., and Kuang, Y. M. (2020). Natural gas subsidies in the industrial sector in China: national and regional perspectives. Appl. Energy 260, 114329. doi:10.1016/j.apenergy.2019.114329
Lin, B., and Wang, F. (2009). Impact of energy price increase on general price level in China: a study based on input-output model and recursive SVAR Model. Econ. Res. J. 44 (12), 66–79+150. (in Chinese).
Lin, B., and Xu, B. (2021). A non-parametric analysis of the driving factors of China's carbon prices. Energy Econ. 104, 105684. doi:10.1016/j.eneco.2021.105684
Lin, Y. (1994). The strategic decision is the key to the success of economic reform and development. Econ. Sci. (03), 3–7. (in Chinese).
Ma, H., and Oxley, L. (2011). Are China's energy markets cointegrated? China Econ. Rev. 22 (3), 398–407. doi:10.1016/j.chieco.2011.05.002
Ouyang, X., and Sun, C. (2015). Energy savings potential in China's industrial sector: from the perspectives of factor price distortion and allocative inefficiency. Energy Econ. 48, 117–126. doi:10.1016/j.eneco.2014.11.020
Ouyang, X., Wei, X., Sun, C., and Du, G. (2018). Impact of factor price distortions on energy efficiency: evidence from provincial-level panel data in China. Energy Policy 118, 573–583. doi:10.1016/j.enpol.2018.04.022
Pan, X., Wei, Z., Han, B., and Shahbaz, M. (2021). The heterogeneous impacts of interregional green technology spillover on energy intensity in China. Energy Econ. 96, 105133. doi:10.1016/j.eneco.2021.105133
Pata, U. K., and Aydin, M. (2020). Testing the EKC hypothesis for the top six hydropower energy-consuming countries: evidence from Fourier Bootstrap ARDL procedure. J. Clean. Prod. 264, 121699. doi:10.1016/j.jclepro.2020.121699
Restuccia, D., and Rogerson, R. (2008). Policy distortions and aggregate productivity with heterogeneous establishments. Rev. Econ. Dyn. 11 (4), 707–720. doi:10.1016/j.red.2008.05.002
Rioux, B., Galkin, P., Murphy, F., Feijoo, F., Pierru, A., Malov, A., et al. (2019). The economic impact of price controls on China's natural gas supply chain. Energy Econ. 80, 394–410. doi:10.1016/j.eneco.2018.12.026
Serafy, S. E. (1981). Absorptive capacity, the demand for revenue, and the supply of petroleum. J. Energy Dev., 73–88.
Sha, R., Li, J., and Ge, T. (2021). How do price distortions of fossil energy sources affect China’s green economic efficiency? Energy 232, 121017. doi:10.1016/j.energy.2021.121017
Sha, R., Ge, T., and Li, J. (2022). How Energy price distortions affect China’s economic growth and carbon emissions. Sustainability 14 (12), 7312. doi:10.3390/su14127312
Shi, X., and Sun, S. (2017). Energy price, regulatory price distortion and economic growth: a case study of China. Energy Econ. 63, 261–271. doi:10.1016/j.eneco.2017.02.006
Skoorka, B. M. (2000). Measuring market distortion: international comparisons, policy and competitiveness. Appl. Econ. 32 (3), 253–264. doi:10.1080/000368400322688
Song, M., and Cui, L. B. (2016). Economic evaluation of Chinese electricity price marketization based on dynamic computational general equilibrium model. Comput. Industrial Eng. 101, 614–628. doi:10.1016/j.cie.2016.05.035
Stern, D. I. (1993). Energy and economic growth in the USA: a multivariate approach. Energy Econ. 15 (2), 137–150. doi:10.1016/0140-9883(93)90033-N
Sun, C., and Lin, B. (2013). Reforming residential electricity tariff in China: block tariffs pricing approach. Energy Policy 60, 741–752. doi:10.1016/j.enpol.2013.05.023
Tan, R., Lin, B., and Liu, X. (2019). Impacts of eliminating the factor distortions on energy efficiency—a focus on China's secondary industry. Energy 183, 693–701. doi:10.1016/j.energy.2019.06.155
Tao, X. M., Xing, J. W., Huang, X., and Zhou, W. (2009). The measurement of energy price distortions and factor substitution in Chinese industry. J. Quantitative Technol. Econ. 11, 3–16. (in Chinese).
Tiba, S. (2019). Modeling the nexus between resources abundance and economic growth: an overview from the PSTR model. Resour. policy 64, 101503. doi:10.1016/j.resourpol.2019.101503
Trujillo-Baute, E., del Río, P., and Mir-Artigues, P. (2018). Analysing the impact of renewable energy regulation on retail electricity prices. Energy Policy 114, 153–164. doi:10.1016/j.enpol.2017.11.042
Ulucak, R., Koçak, E., Erdoğan, S., and Kassouri, Y. (2020). Investigating the non-linear effects of globalization on material consumption in the EU countries: evidence from PSTR estimation. Resour. policy 67, 101667. doi:10.1016/j.resourpol.2020.101667
Wang, M., and Feng, C. (2021). The win-win ability of environmental protection and economic development during China's transition. Technol. Forecast. Soc. Change 166, 120617. doi:10.1016/j.techfore.2021.120617
Wang, Q., Qiu, H. N., and Kuang, Y. (2009). Market-driven energy pricing necessary to ensure China's power supply. Energy Policy 37 (7), 2498–2504. doi:10.1016/j.enpol.2009.03.008
Wang, X., Bai, M., and Xie, C. (2019). Investigating CO2 mitigation potentials and the impact of oil price distortion in China's transport sector. Energy Policy 130, 320–327. doi:10.1016/j.enpol.2019.04.003
Weng, Q., Lian, H., and Qin, Q. (2022). Spatial disparities of the coupling coordinated development among the economy, environment and society across China’s regions. Ecol. Indic. 143, 109364. doi:10.1016/j.ecolind.2022.109364
Wu, C. (2021). Research on the synergistic effect of low-carbon economy in China. J. Manag. World 37 (08), 105–117. (in Chinese). doi:10.19744/j.cnki.11-1235/f.2021.0110
Zhang, L., and Adom, P. K. (2018). Energy Efficiency Transitions in China: how persistent are the movements to/from the frontier? Energy J. 39 (6). doi:10.5547/01956574.39.6.lzha
Zhang, R., Shimada, K., Ni, M., Shen, G. Q., and Wong, J. K. (2020). Low or No subsidy? Proposing a regional power grid based wind power feed-in tariff benchmark price mechanism in China. Energy Policy 146, 111758. doi:10.1016/j.enpol.2020.111758
Zhao, Z. Y., Zuo, J., Fan, L. L., and Zillante, G. (2011). Impacts of renewable energy regulations on the structure of power generation in China–a critical analysis. Renew. Energy 36 (1), 24–30. doi:10.1016/j.renene.2010.05.015
Zhu, H., and Chen, X. (2019). Asymmetric effects of oil prices and exchange rates on China’s industrial prices. Energy Econ. 84, 104551. doi:10.1016/j.eneco.2019.104551
Zuo, Q. (2018). A look at the dual-track system of coal prices with a historical perspective. China Coal Network. Available at: http://www.ccoalnews.com/gcj/201807/27/c83055.html.
Keywords: energy price distortions, coordinated development, PSTR model, economic growth, carbon emission reduction
Citation: Sha R (2023) Coordinating economic growth and carbon emission reduction in China: evidence from the optimal levels of energy price distortions. Front. Energy Res. 11:1301266. doi: 10.3389/fenrg.2023.1301266
Received: 24 September 2023; Accepted: 11 October 2023;
Published: 30 October 2023.
Edited by:
Jianli Zhou, Xinjiang University, ChinaReviewed by:
Tao Ge, Nantong University, ChinaCopyright © 2023 Sha. This is an open-access article distributed under the terms of the Creative Commons Attribution License (CC BY). The use, distribution or reproduction in other forums is permitted, provided the original author(s) and the copyright owner(s) are credited and that the original publication in this journal is cited, in accordance with accepted academic practice. No use, distribution or reproduction is permitted which does not comply with these terms.
*Correspondence: Ru Sha, c3IwMDc0NzZAeGp1LmVkdS5jbg==
Disclaimer: All claims expressed in this article are solely those of the authors and do not necessarily represent those of their affiliated organizations, or those of the publisher, the editors and the reviewers. Any product that may be evaluated in this article or claim that may be made by its manufacturer is not guaranteed or endorsed by the publisher.
Research integrity at Frontiers
Learn more about the work of our research integrity team to safeguard the quality of each article we publish.