 Yueping Kong
 Shihai Yang
95% of researchers rate our articles as excellent or good
Learn more about the work of our research integrity team to safeguard the quality of each article we publish.
Find out more
ORIGINAL RESEARCH article
Front. Energy Res. , 16 November 2023
Sec. Process and Energy Systems Engineering
Volume 11 - 2023 | https://doi.org/10.3389/fenrg.2023.1301175
This article is part of the Research Topic Advanced Technologies for Planning and Operation of Prosumer Energy Systems, volume III View all 32 articles
With the large-scale renewable energy integrated into the distribution grid, the grid’s regulating ability and disturbance tolerance are weakening. When partitioning demand-side resources, it is necessary to enhance resilience to ensure the reliability of electric power. This paper proposes a fast-partitioning method that considers resilience, structure, and functionality to adapt to the evolving requirements of the distribution system. Specifically, the comprehensive partition index system is constructed with the resilience assessment index reflecting the ability of partitions to withstand and mitigate the effects of faults, the modularity index based on electrical distance, and regional power balance indexes. Meanwhile, a modified genetic algorithm is proposed to calculate the comprehensive partition index. The modified algorithm first uses a sensitivity matrix to perform initial partitions and construct initial populations. Then, it utilizes a triangular network adjacency matrix for chromosome encoding, significantly reducing the algorithm’s search space and enhancing partitioning efficiency. Finally, the applicability and effectiveness of the proposed method are verified through simulation analysis of the IEEE 28-node system.
With the large-scale renewable energy integrated into the distribution grid, the unpredictability and time-varying nature of various distributed energy sources and loads have presented challenges for the planning, operation, and dispatch in distribution networks (Mi et al., 2023). In terms of grid operation, the power supply mode in the electrical system has transitioned from “generation following demand” to “interactive generation and demand” (Luo et al., 2021). Traditional distribution network planning typically focuses on radial supply networks from a single power source (Khezri et al., 2022). However, in the context of a high percentage of new energy access, multi-source supply and the uncertainty in renewable energy output have made distribution network planning more complex (Fu and Zhou, 2023). Regarding grid dispatch, distributed energy sources have small individual capacities and are dispersed, and they are constrained by admission rules, limiting their flexibility to participate in grid dispatch actively (Wen et al., 2021). This limitation can lead to resource wastage due to insufficient system accommodation capacity (Zhang et al., 2023).
Traditional centralized control strategies need to shift towards decentralized control, considering the integration of distributed energy sources and loads on urban power grids (Cao et al., 2022). This change has led to a need for demand-side resources partitioning Demand-side resources partitioning primarily involves the combination of distributed energy devices to facilitate self-organization and self-management within partitions. Simultaneously, interregional coordination is achieved through grid dispatch and management (Wei, 2015). Presently, there has been some scholarly inquiry into demand-side resource partitioning strategies. The current research on demand-side resources partitioning primarily revolves around addressing two key challenges: partitioning criteria and partitioning algorithms. The process typically begins with the establishment of partitioning criteria based on specific objectives. Subsequently, appropriate partitioning algorithms are selected to iterative indexes for partitioning criteria, ultimately achieving the best possible partitioning solution. The criteria for partitioning typically revolve around assessing the degree of interdependence among partitions. Specifically, they emphasize weaker interdependencies between partitions to promote specialization and stronger intra-partition connections to encourage collaboration. Partitioning algorithms are often determined by the characteristics of the partitioning criteria’s indicators, with a primary focus on clustering analysis and optimization algorithms. Blondel et al. (2008) defined the electrical distance between load nodes as the weights of the graph edges and utilized a spectral clustering algorithm to perform cluster partitioning. Zhao et al. (2021) assessed the quality of power grid partitioning using electrical modularity and reactive power reserve verification as two evaluation criteria. Moreover, an improved k-means clustering algorithm is proposed to analyze clusters based on feature sequences after dimension reduction. Wang et al. (2021) introduced the complex network modularity function concept and utilized the fast unfolding clustering algorithm to partition photovoltaic power clusters. The application of hierarchical clustering algorithms for demand-side resources partitioning offers the advantages of simplicity and relatively efficient computation. However, it is essential to recognize that this method frequently needs more robust global search capabilities and is prone to get trapped in local optima.
Demand-side resources partitioning often requires considering the optimality of multiple criterion indicators. Optimization algorithms have mature applications in solving multi-objective optimization problems in power systems. Some scholars have applied these algorithms to solve demand-side resource partitioning problems. Wu et al. (2022) introduced an energy bipartite modularity index that quantifies the energy coupling degree between partitions. By integrating this index with predictive scenarios, dynamic partitioning was achieved using a multi-objective ant colony algorithm. Liu et al. (2022) applied a network-based fast-partitioning algorithm to perform reactive and active power partitioning in distribution grids. Pan et al. (2021) utilized the Louvain community detection algorithm to generate double clusters focused on combined heat and power partitions. Liu et al. (2021) established gain and loss functions based on modularity and stability indices. These functions served as the basis for label propagation, and an improved label propagation algorithm was used for dynamic partitioning in distribution grids. Zheng et al. (2021) enhanced modularity increments by considering distributed generation (DG) integration locations and improved the modularity increment matrix based on reactive power/active power-voltage sensitivity. They employed an improved Fast-Newman algorithm for grid partitioning. Ding et al. (2021) developed an extended bi-level planning model considering cluster division and solved it using an improved hybrid genetic algorithm. Bi et al. (2019) combined the cluster accommodation capacity index with the modularity index and proposed a heuristic cluster division algorithm that integrates switch statuses and genetic algorithms. While traditional optimization algorithms are suitable for solving multi-objective optimization problems with global solid search capabilities, they often exhibit slower convergence rates, potentially increasing system control times and yielding unstable search results.
Furthermore, existing research predominantly considers a single index, such as modularity or cluster accommodation capacity, with only a limited number of studies exploring the integration of these metrics. Consequently, current partitioning criteria are only able to meet the basic structural and functional requirements of partitioning. With the widespread and high-proportion integration of new energy sources, partitioning requirements have expanded beyond structural strength and functionality. To enhance the management capabilities and disturbance resilience of distribution networks, there is also a growing need to incorporate considerations of resilience for partitioning. Grid resilience, system structure, and the uncertainties of distributed energy outputs all influence the reliability and economics of partitioning. Currently, there is no established theoretical framework for partitioning methods that specifically address the enhancement of grid resilience.
Therefore, building upon existing research, this paper proposes a fast-partitioning method for demand-side resources based on grid resilience assessment. The resilience assessment index is quantified and incorporated into constructing a comprehensive partition index system, modularity index, and the active and reactive power balance index. This integration aims to enhance the resilience, structural strength, and functionality of the distribution system, ensuring the safe and stable operation of the grid. Furthermore, a modified genetic algorithm is proposed to obtain optimal partitioning results. The modified algorithm is more suitable for calculating comprehensive partition index and can improve search efficiency. Ultimately, this method enhances the resilience of the distribution system and achieves weak coupling between partitions to facilitate management while promoting cooperation among nodes within each partition.
The selection of the comprehensive partition index system is determined by the partitioning objectives and principles. The partitioning principles involve considering the complementarity and interrelation of nodes within a cluster while ensuring a rational allocation of resources within the partition and maintaining the coupling relationships and voltage regulation capability between nodes. This is specifically reflected in the method by adhering to the following principles: the logical principle, which dictates that there should be no isolated nodes within the partition, and there should be no overlapping nodes between partitions, ensuring connectivity among nodes; the structural principle, which requires close connections within the partition in terms of geographical or electrical coupling, while maintaining sparse connections between different partitions; and the functional principle, emphasizing that the characteristics of a partition are expressed through the combined characteristics of its individual nodes, requiring collaborative capabilities among the nodes within the partition to achieve more efficient system operation. In this paper, while ensuring logical principles, a comprehensive partition index system is constructed from three perspectives: resilience, structural, and functionality. In terms of resilience, the distribution system aims to effectively identify weak parts, enhance each partition’s self-healing capability and speed, and facilitate monitoring partitions with lower resilience. This ensures the safety and stability of the system. The assessment index is weighted by self-healing rate, self-healing speed, voltage violation rate, and load rate. On the structural property, the system fosters strong electrical coupling among nodes within partitions and weak coupling between partitions to facilitate operational management. This is evaluated using the modularity index. Regarding functionality, the system maximizes the coordination between nodes within each partition, enhancing active power complementarity and matching while improving reactive power balance. This is assessed using the active and reactive power balance indexes. The comprehensive partition index system based on the grid resilience assessment proposed in this paper is shown in Figure 1.
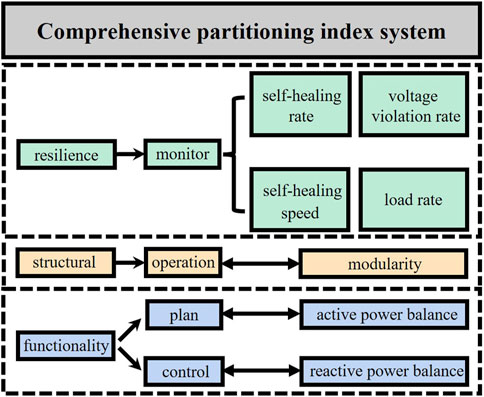
FIGURE 1. Comprehensive partition index system based on resilience assessment.
Resilience of the power system refers to the ability of the system to withstand the impact of faults and quickly recover to a regular supply state. To effectively assess grid resilience, this paper constructs a comprehensive resilience assessment index based on four aspects: self-healing rate, self-healing speed, load rate, and voltage violation rate.
The self-healing rate reflects the system’s ability to effectively withstand the impact of faults and maintain a high power supply level. It is measured as the percentage of remaining power supply during a fault event. A higher self-healing rate indicates a more robust ability of the system to resist the impact of faults. Different types of loads have varying requirements for power reliability and quality based on their importance, so loads are categorized into primary, secondary, and tertiary loads. Therefore, to account for the total power restored during load recovery within a node’s jurisdiction for different load levels, the self-healing rate
In the equation,
The self-healing speed reflects how quickly a system recovers from a fault event to return to its regular power supply level. A higher self-healing speed indicates a faster recovery speed and, consequently, a more robust overall system resilience. After a fault occurs, the duration of the fault event is divided into three periods: fault location time, recovery time for the non-fault zone, and repair time for the fault zone. Locals that did not experience a fault would have fully recovered their power supply after the fault location time and the recovery time for non-fault segments had passed. At this point, all recoverable loads would have been restored. Therefore, the self-healing speed
In the equation,
The operational conditions of electrical system node equipment under high load rates increase system losses and directly impact the power supply quality, economic efficiency, and system safety. If these devices fail, it can result in a widespread power outage in the electrical system. These high-load nodes are critical points and potential weak links in the system. The load rate can be defined using the following formula:
In the equation,
Voltage drop is an important indicator used to measure power quality. It is required that the voltage drop does not exceed ±5% of the rated voltage to ensure good power quality. Excessive voltage drop can impact the user experience and pose safety risks to the system. The formula for calculating the voltage violation rate is as follows:
In the equation,
The resilience assessment index can be calculated for a single node by combining the four indexes with their respective weights. It can be expressed as follows:
In the equation,
Categorize all nodes within the partitions into three classes based on their vulnerability: primary, secondary, and tertiary vulnerable nodes. Primary vulnerable nodes are those whose fault results in the most severe electric system losses and significantly impact the system’s power supply. Secondary vulnerable nodes are nodes of significant importance, with their fault substantially affecting the system. Tertiary vulnerable nodes are relatively important in the system, with their failure having a moderate impact. Assign weights to these defined node types based on their relative significance. Then, using the corresponding weights, calculate the partitions’ resilience assessment index and the comprehensive resilience assessment index. The expressions are as (6)–(7). A higher partitioning resilience assessment index indicates a more vital ability to withstand fault impacts within the partitions. In comparison, a lower index suggests that the partition is weak and requires focused monitoring to reduce operational risks in the grid.
In the equation,
Girvan and Newman introduced the concept of modularity to measure the structural strength of a complex network, assess the quality of network divisions, and determine the optimal number of partitions. In this paper, modularity is employed to evaluate the structural strength of the distribution network partitions. The definition of modularity is as follows:
In the equation:
Based on the calculation characteristics of Eq. 8,
This paper defines the edge weight matrix as determined by sensitivity to reflect the electrical distance between different nodes. The sensitivity relationship between voltage and reactive power can effectively measure the degree of electrical coupling between two nodes. The sensitivity relationship can be expressed as follows:
In the equation,
In the equation,
In modularity settings, the edge weight relationship satisfies
In the equation,
As the penetration of new energy sources continues to increase, it becomes essential to consider the time-varying output characteristics of nodes and their combinations when partitioning. This allows for the full utilization of partitioning autonomy, ensuring that partitions can achieve source-load complementarity or source-source complementarity. Simultaneously, it helps mitigate the volatility and intermittency of new energy source output. The definitions for assessing the partitions’ active power balance in different time-varying scenarios, as well as the comprehensive active power balance index, are expressed as follows:
In the equation,
Each partition has significant reactive power requirements in complex electrical systems with large-scale new energy source integration. Therefore, each partition should strive to achieve a local reactive power balance to minimize the cross-partition transmission of reactive power and fully utilize the accommodation capability to reduce unnecessary losses. The definitions for assessing the partitions’ reactive power balance, as well as the comprehensive reactive power balance index, are expressed as follows:
In the equation,
Integrating all the indexes above, the comprehensive partition index based on grid resilience assessment can be represented as follows:
In the equation,
Due to the broad dimensions of the comprehensive partition index, conventional solving methods often struggle to balance all the indexes, leading to lower solution accuracy or susceptibility to local optima. Therefore, this paper proposes a modified genetic algorithm for demand-side resource partition to better adapt to the rapid calculating of the comprehensive partition index.
Unlike conventional algorithms, the genetic algorithm is based on biological principles and mimics biological evolution under natural selection. It can effectively utilize global information for global search and gradually approach the global optimum with increasing iterations. When applied to partitioning problems, genetic algorithms typically use the comprehensive partition index as the fitness function and perform a global search for partition results. The algorithm determines the number of partitions, eliminating the need for manual configuration. However, considering the complex nature of network structures and the impact of changes in the number of partitions and combinations of nodes within partitions on partitioning performance, traditional genetic algorithms may struggle to rapidly and accurately find the global optimum. This paper introduces improvements to the traditional genetic algorithm to adapt to demand-side resource partitioning, improve search efficiency, and reduce iteration time.
The chromosome encoding format of the genetic algorithm is first modified. The adjacency matrix is constructed based on the network nodes’ connectivity status, considering the connectivity constraints within partitions. The existing chromosome encoding directly utilizes the adjacency matrix, which, while capable of representing the connectivity between nodes, encounters non-unique expressions for disconnected states between nodes. This results in a higher number of ineffective iterations during the crossover and mutation processes, leading to prolonged algorithm runtime. Therefore, in this paper, we opted to retain only the upper triangular region of the adjacency matrix. This not only reflects the connectivity status between nodes but also simplifies the crossover and mutation iterative processes. Furthermore, This encoding format allows each individual to reflect the current node’s connectivity with the subsequent nodes. It reduces the number of elements by half compared to the original encoding method. It significantly shrinks the search space for the genetic algorithm thereby reducing search time. Additionally, unlike traditional genetic algorithms, this method does not merge nodes, making it suitable for searching irregular partitions. As shown in Figure 2, the network’s adjacency matrix represents the connectivity between nodes. The matrix contains only 0 and 1, where 0 and 1 indicate whether two nodes are disconnected or connected, respectively. During the encoding process, the algorithm continuously searches for 1 and performs random modifications (changing between 0 and 1) to represent whether the current node is disconnected from or connected to the subsequent node. The individual obtained after the modifications represents the results of a new partition.
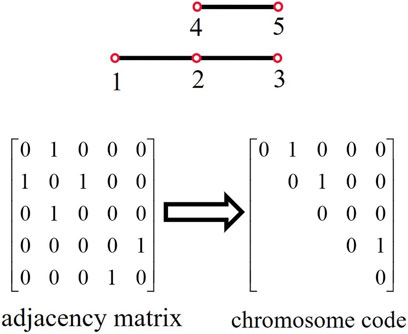
FIGURE 2. Chromosome encoding method.
Furthermore, improvements have been made in the selection of the initial population. In genetic algorithms, the choice of the initial population significantly impacts algorithm performance and convergence speed. Traditional genetic algorithms generate the initial population with randomness, which can lead to the optimization process getting stuck in local optima. Therefore, this paper creates the initial partition based on the sensitivity matrix of load nodes to generator nodes. The initial population is constructed according to the initial partition results. Specifically, generator nodes most sensitive to a load node are merged into the same partition as that load node. This process is repeated for all load nodes and their corresponding generator nodes, resulting in the initial partition. Within each partition, the control capability of generator nodes over load nodes is fully leveraged. This ensures the ability of each region to supply both active and reactive power while effectively resisting the impact of faults. Hence, the comprehensive partition index for the initial partitions is relatively high. The chromosomes of the initial individuals are coded according to the above method, and then 1 in the coding matrix is randomly modified N times with the value of 0 or 1. This results in an initial population with the number of populations of N. This approach yields an initial population with higher fitness, which can accelerate algorithm convergence and enhance global search capabilities to avoid getting trapped in local optima. The sensitivity relationship between load nodes and generator nodes is represented in Eq. 18. The partitioning algorithm flow chart is illustrated in Figure 3.

FIGURE 3. The flow chart of the partitioning algorithm.
In the equation,
In order to improve the convergence speed and global search capability of the genetic algorithm, this paper adopted the concept of adaptive genetic algorithms, where the crossover rate and mutation rate are adjusted adaptively. The adjustment formula follows the following principles: If an individual is of lower quality, meaning its fitness value is less than the average fitness value, it is assigned a higher crossover rate and a lower mutation rate. If an individual is of higher quality, meaning its fitness value is greater than the average fitness value, its corresponding crossover and mutation rates are determined based on its iterative state. Considering that the iteration count increases as the iterations progress, the patterns of individuals become more similar, meaning the partitioning results become more similar, and excessively high crossover rates lose their significance. In this case, mutation rate should be increased appropriately to enhance the algorithm’s local search capabilities. This paper uses the adjustment method proposed by Srinivas et al., and the specific formula follows.
In the equation:
This paper validates the applicability and effectiveness of the partitioning method using the IEEE 28-node test system. The system consists of 28 nodes, with a maximum system load of 9.285 MW. Primary loads are categorized as nodes 1, 2, 4, 5, 6, 8, 9, 12, 13, 14, 23, 24, 27, and 28. Nodes 3, 7, 10, 15, and 16 are categorized as secondary loads. The remaining nodes are categorized as tertiary loads. The weighting coefficients for primary, secondary, and tertiary loads are 10, 5, and 1, respectively. The weighting coefficients for primary, secondary, and tertiary nodes are 0.6, 0.3, and 0.1, respectively. Node 7 has a photovoltaic capacity of 600 kW, while all other photovoltaics have a capacity of 300 kW each. Node 5 has a wind farm capacity of 1.2 MW, Node 9 has a wind farm capacity of 400 kW, and the remaining distributed wind turbines have a rated capacity of 300 kW each. It is assumed that the rated wind speed for the wind turbines is 12 m/s, the cut-in wind speed is 2.8 m/s, and the cut-out wind speed is 25 m/s. To verify the proposed partitioning method’s feasibility, 23 December 2020, was selected as a typical scenario for analysis. The power output of each node is shown in Figure 4, with a noticeable reverse active power flow around noon, indicating the highest penetration of new energy sources in the urban distribution network.
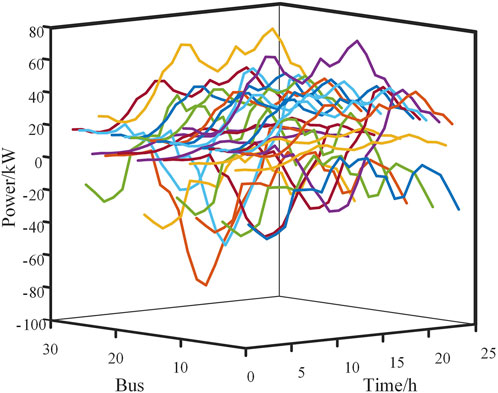
FIGURE 4. Time-varying power curves at each node.
The decision for demand-side resource partitioning is made using the fast partitioning method proposed in this paper. Firstly, the sensitivity matrix is calculated for the selected node system to identify the load nodes most sensitive to each generator node, forming the initial partition. In the initial partition, each partition contains only one generator node. Then, based on the initial partition results, 20 random modifications are applied to the 0 and 1 in the initial individual adjacency matrix upper triangular to create an initial population of size N = 20. The number of iterations is set to g = 500, the crossover rate
The fitness evolution curve of the modified genetic algorithm is shown in Figure 5. It can be observed that the initial population obtained based on the sensitivity matrix for initial partitioning has relatively high fitness values even with a small number of iterations. This significantly enhances convergence speed and partitioning efficiency while improving the algorithm’s global optimization capability. After 145 iterations, the fitness curve gradually stabilizes. At this point, the individuals in the population represent the optimal partition, and based on their chromosome encoding, the optimal partitioning result can be directly obtained. The optimal partitioning structure is shown in Figure 6.
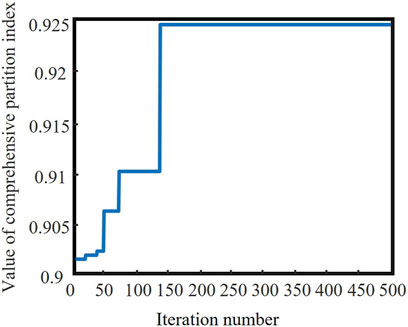
FIGURE 5. Evolutionary curve of fitness.
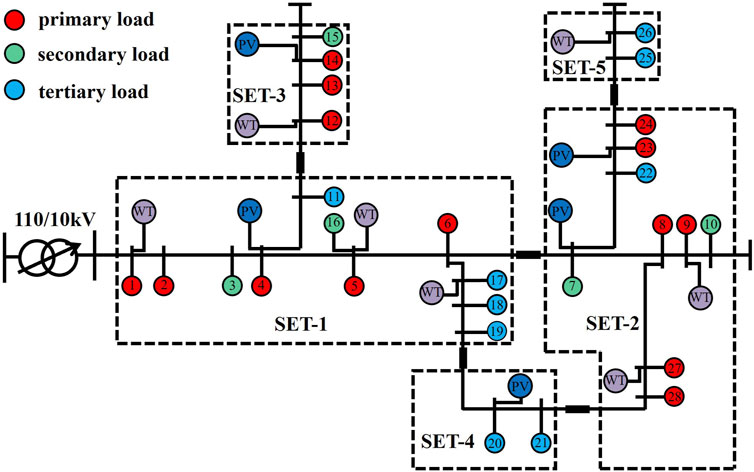
FIGURE 6. Optimal partitioning structure diagram based on modified genetic algorithm.
As shown in this figure, the optimal partitions obtained by the modified genetic algorithm have no isolated nodes within each partition, and there are no overlapping nodes between partitions, which adheres to the logical principles of partitioning. Additionally, the relatively low number of partitions is advantageous for monitoring and adjusting each partition. The partition index results based on the modified genetic algorithm are presented in Table 1.
TABLE 1. Optimal partition result based on modified genetic algorithm.
Based on this table, it is apparent that the same indexes are relatively balanced across the different partitions. The high regional resilience assessment index suggests good self-recovery capability and relatively quick recovery times in the event of a fault. Each partition also exhibits strong reactive power supply capacity and active power balance. The modularity index is relatively high, which suggests that the partitioning results perform well in terms of network structure and electrical coupling, aligning with both the logical and structural principles of partitions.
A comparison was made with the k-means algorithm to demonstrate the reliability and superiority of the modified genetic algorithm proposed in this paper. The demand-side resource partitioning structure diagram based on the k-means algorithm is shown in Figure 7, and the partition index results are presented in Table 2. Compared to the results obtained with the modified genetic algorithm in Figure 6, the regions in Figure 7 contain isolated nodes, which are not conducive to collaboration between nodes. There are also more regions, making monitoring more complex for each partition. As indicated in Table 2, the active and reactive balance is high in SEC-1, SEC-2, SEC-3, SEC-4, SEC-5, SEC-6, and SEC-11 but lower in the remaining partitions. The partition resilience assessment index is very low in SEC-9. This partitioning result demonstrates that using the k-means algorithm for demand-side resource partitioning decisions cannot effectively balance various indexes. Partial partition index values are too low, with poor complementarity and node collaboration. This approach does not fully leverage the advantages of partitions and is not conducive to the safe and stable operation of the grid.
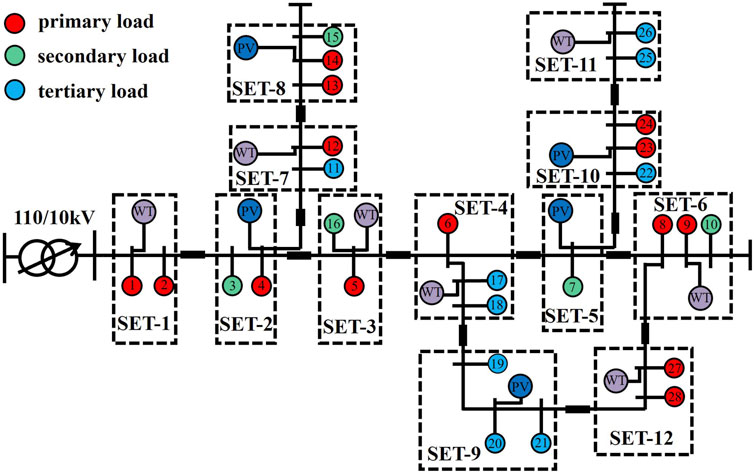
FIGURE 7. Partitioning structure diagram based on the k-means algorithm.

TABLE 2. Partition structure diagram based on k-means algorithm.
Using the modified genetic algorithm proposed in this paper for demand-side resources partitioning decisions gives better results than the k-means algorithm. This is because the k-means algorithm’s initial selection of cluster centers and the randomness in initial cluster assignment can easily lead to the algorithm getting stuck in local optima.
To further validate the superiority of the modified genetic algorithm proposed in this paper, the comprehensive partition index is used to compare the partitioning results of the modified genetic algorithm with those of the traditional genetic algorithm and the k-means algorithm, as shown in Table 3. This table shows that the modified genetic algorithm had the shortest iteration time, and the comprehensive partition index improved by 17.6% and 12.6% compared to the other two methods, respectively. Compared to the traditional genetic algorithm, the modified genetic algorithm showed significant improvements in the comprehensive resilience assessment index, modularity index, comprehensive active index, and comprehensive reactive power balance index. In summary, it is evident that the modified algorithm has more robust global search capabilities after the enhancements, effectively avoiding local optima, and it also demonstrates a faster iteration speed and higher partitioning efficiency.
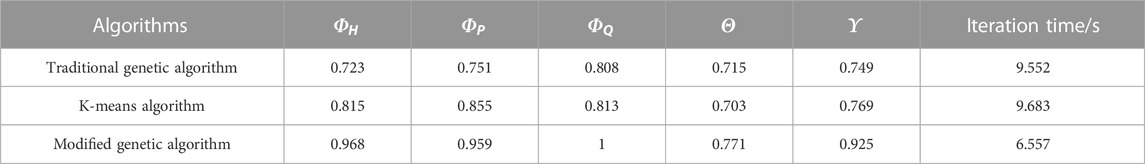
TABLE 3. Comparison of comprehensive partitioning indexes from different algorithms.
Demand-side resources partitioning simplifies power system planning and analysis, operation scheduling, and weak parts monitoring and has a wide range of application scenarios. However, due to the extensive and high-proportion integration of new energy sources into the distribution network, the regulating ability and disturbance tolerance of the grid becomes weaker, and the weak parts in the distribution system increase significantly. It is necessary to consider the resilience in demand-side resource partitioning to ensure the reliability of electric power. As traditional partitioning methods have shown limited effectiveness, this paper proposes a method for fast partitioning based on resilience, structure, and functionality. The method involves constructing a comprehensive partition index using the resilience assessment index, modularity index, and power balance indexes and then solving it using a modified genetic algorithm. The proposed comprehensive partition index effectively assesses grid resilience, ensures the grid’s structural strength and functional characteristics, and delivers strong performance in grid planning, operation, and scheduling. The proposed modified partitioning algorithm exhibits global solid search capabilities, faster iteration speeds, and fewer iterations. Above all, the proposed fast-partitioning method can effectively address the challenges posed by the large-scale integration of new energy sources into the distribution network to enhance the grid’s ability to withstand and mitigate faults and reduce operational risks.
As the penetration rate of distributed resources increases, further research is needed to explore dynamic partitioning methods that can respond in real-time to distributed resource output.
The original contributions presented in the study are included in the article/supplementary material, further inquiries can be directed to the corresponding author.
YK: Data curation, Formal Analysis, Methodology, Supervision, Writing–original draft, Writing–review and editing. SY: Data curation, Formal Analysis, Methodology, Supervision, Writing–original draft. MD: Data curation, Formal Analysis, Methodology, Writing–original draft. YZ: Data curation, Formal Analysis, Investigation, Writing–review and editing. ZD: Conceptualization, Formal Analysis, Software, Writing–original draft. TZ: Data curation, Methodology, Software, Writing–review and editing. JS: Conceptualization, Data curation, Methodology, Writing–review and editing.
The author(s) declare financial support was received for the research, authorship, and/or publication of this article. This study received funding from the Science and Technology Project of State Grid Jiangsu Electric Power Co., Ltd. The authors gratefully acknowledge the support of the Science and Technology Project of State Grid Jiangsu Electric Power Co., Ltd. (J2022045).
Authors YK, SY, MD, YZ, ZD, TZ, and JS were employed by Marketing Service Center of State Grid Jiangsu Electric Power Co., Ltd.
All claims expressed in this article are solely those of the authors and do not necessarily represent those of their affiliated organizations, or those of the publisher, the editors and the reviewers. Any product that may be evaluated in this article, or claim that may be made by its manufacturer, is not guaranteed or endorsed by the publisher.
Bi, R., Liu, X., Ding, M., Fang, H., Zhang, J., and Chen, F. (2019). Renewable energy generation cluster partition method aiming at improving accommodation capacity. Proceeding CSEE 39 (22), 6583–6592. doi:10.13334/j.0258-8013.pcsee.182512
Blondel, V. D., Guillaume, J. L., Lambiotte, R., and Lefebvre, E. (2008). Fast unfolding of communities in large networks. J. Stat. Mech. theory Exp. 2008 (10), P10008. doi:10.1088/1742-5468/2008/10/P10008
Cao, Y., Zhou, B., Chung, C. Y., Shuai, Z., Hua, Z., and Sun, Y. (2022). Dynamic modelling and mutual coordination of electricity and watershed networks for spatio-temporal operational flexibility enhancement under rainy climates. IEEE Trans. Smart Grid 14 (5), 3450–3464. doi:10.1109/TSG.2022.3223877
Ding, M., Zhang, Y., Bi, R., Hu, D., and Gao, P. (2021). Coordinated grid-power sources expansion planning for distribution network considering cluster partition. Proceeding CSU-EPSA 33 (01), 136–143. doi:10.19635/j.cnki.csu-epsa.000487
Fu, X., and Zhou, Y. (2023). Collaborative optimization of PV greenhouses and clean energy systems in rural areas. IEEE Trans. Sustain. Energy 14 (1), 642–656. doi:10.1109/TSTE.2022.3223684
Khezri, R., Mahmoudi, A., and Aki, H. (2022). Optimal planning of solar photovoltaic and battery storage systems for grid-connected residential sector: review, challenges and new perspectives. Renew. Sustain. Energy Rev. 153, 111763. doi:10.1016/j.rser.2021.111763
Liu, L., Wu, T., Wong, H., Zheng, W., and Xu, Q. (2021). Dynamic partitioning method of distribution network based on label propagation. Electr. Power Autom. Equip. 41 (12), 36–44. doi:10.16081/j.epae.202111020
Liu, R., Wu, K., Feng, L., Liang, R., and Wang, X. (2022). Voltage partition coordinated optimization control of active distribution network of high penetration distribution PVs. Acta Energiae Solaris Sin. 43 (02), 189–197. doi:10.19912/j.0254-0096.tynxb.2020-0239
Luo, X., Liu, Y., Feng, P., Gao, Y., and Guo, Z. (2021). Optimization of a solar-based integrated energy system considering the interaction between generation, network, and demand side. Appl. Energy 294, 116931. doi:10.1016/j.apenergy.2021.116931
Mi, Y., Chen, Y., Yuan, M., Li, Z., Tao, B., and Han, Y. (2023). Multi-timescale optimal dispatching strategy for coordinated source-grid-load-storage interaction in active distribution networks based on second-order cone planning. Energies 16 (3), 1356. doi:10.3390/en16031356
Pan, M., Liu, N., and Lei, J. (2021). Dynamic partition method for distributed energy cluster with com-bined heat and power unit. Automation Electr. Power Syst. 45 (01), 168–176. doi:10.7500/AEPS20200217013
Wang, L., Zhang, F., Kou, L., Xu, Y., and Hou, X. (2021). Large-scale distribution PV cluster division based on fast unfolding clustering algorithm. Acta Energiae Solaris Sin. 42 (10), 29–34. doi:10.19912/j.0254-0096.tynxb.2018-0896
Wei, Z. (2015). Overview of complex networks community structure and its applications in electric power network analysis. Proc. CSEE 35 (7), 1567–1577. doi:10.13334/j.0258-8013.pcsee.2015.07.003
Wen, G., Yu, X., and Liu, Z. (2021). Recent progress on the study of distributed economic dispatch in smart grid: an overview. Front. Inf. Technol. Electron. Eng. 22 (1), 25–39. doi:10.1631/FITEE.2000205
Wu, T., Liu, L., Lin, Y., and Zheng, W. (2022). Day-ahead optimal dispatch for a distribution network based on dynamic partitioning. Power Syst. Prot. Control 50 (15), 21–32. doi:10.19783/j.cnki.pspc.211209
Zhang, X., Fu, X., Xue, Y., Chang, X., and Bai, X. (2023). A review on basic theory and technology of agricultural energy internet. IET Renew. Power Gener. 00, 1–14. doi:10.1049/rpg2.12808
Zhao, J., Jia, R., Chen, L., and Zhu, T. (2021). Research on the fast partition of reactive power and voltage based on deep learning and an improved K-Means clustering algorithm. Power Syst. Prot. Control 49 (14), 89–95. doi:10.19783/j.cnki.pspc.201124
Keywords: resilience assessment, demand-side resources, modified genetic algorithm, distribution network, fast-partitioning decisions
Citation: Kong Y, Yang S, Duan M, Zhou Y, Ding Z, Zhang T and Sheng J (2023) A fast-partitioning decision method for demand side resources based on grid resilience assessment. Front. Energy Res. 11:1301175. doi: 10.3389/fenrg.2023.1301175
Received: 24 September 2023; Accepted: 07 November 2023;
Published: 16 November 2023.
Edited by:
Hugo Morais, University of Lisbon, PortugalReviewed by:
Zhenjia Lin, Hong Kong Polytechnic University, Hong Kong SAR, ChinaCopyright © 2023 Kong, Yang, Duan, Zhou, Ding, Zhang and Sheng. This is an open-access article distributed under the terms of the Creative Commons Attribution License (CC BY). The use, distribution or reproduction in other forums is permitted, provided the original author(s) and the copyright owner(s) are credited and that the original publication in this journal is cited, in accordance with accepted academic practice. No use, distribution or reproduction is permitted which does not comply with these terms.
*Correspondence: Yueping Kong, Nzg3NDMyNjU0QHFxLmNvbQ==
Disclaimer: All claims expressed in this article are solely those of the authors and do not necessarily represent those of their affiliated organizations, or those of the publisher, the editors and the reviewers. Any product that may be evaluated in this article or claim that may be made by its manufacturer is not guaranteed or endorsed by the publisher.
Research integrity at Frontiers
Learn more about the work of our research integrity team to safeguard the quality of each article we publish.