 Bin Cao1,2*
 Hongqing Liu
95% of researchers rate our articles as excellent or good
Learn more about the work of our research integrity team to safeguard the quality of each article we publish.
Find out more
ORIGINAL RESEARCH article
Front. Energy Res. , 17 November 2023
Sec. Sustainable Energy Systems
Volume 11 - 2023 | https://doi.org/10.3389/fenrg.2023.1299040
The annual increase in installation capacity and electrical production of renewable energy sources, primarily wind turbine generators (WTG), is shaping a renewable energy dominated power system. WTGs are susceptible to the temporary overvoltage caused by reactive power surplus following low-voltage ride through (LVRT). This can lead to the large-scale trip-off of WTGs and pose significant risks to the secure and stable operation of power systems. An insightful elaboration of the underlying mechanisms determining the occurrence of temporary overvoltage, and an analysis of influencing factors, is pivotal to ensure the reliable integration of WTGs. This paper investigates the temporary overvoltage in the AC systems integrated with multiple renewable energy stations. A temporary overvoltage model that accounts for various types of equipment has been derived. Resorting to the model, the influence of LVRT parameters of WTGs, SCR and IR of the AC system on the maximum terminal overvoltage has been quantitatively assessed. Simulations and semi-physical validations have been conducted to verify the effectiveness and accuracy of the theoretical analysis.
With the increasing integration of a growing number of wind turbines into the electrical power system, the grid has displayed characteristics marked by a high proportion of power electronic devices (Hossain and Ali, 2015; Nasiri et al., 2015; Hannan et al., 2023). These new energy devices are primarily integrated into the grid through grid-connected equipment, and as such, they lack the capability to provide voltage support to the system (TripathiA et al., 2015; Shair et al., 2021). Consequently, they are susceptible to system overvoltages resulting from transient reactive power surpluses following grid faults. These overvoltages hinder the capacity for new energy integration in wind power collection areas (Xin et al., 2023).
For traditional AC systems, after experiencing transient processes caused by circuit breaker operations or short-circuit faults, the power system may encounter temporary frequency overvoltages, often referred to as “transient overvoltages” in existing literature (Lazzari et al., 2023). Overvoltages in power systems can be classified into two categories based on their origin: external overvoltages and internal overvoltages (Andreotti et al., 2023). External overvoltages result from discharges in the atmosphere, such as lightning-induced overvoltages caused by lightning strikes or inductive effects. These overvoltages are also known as lightning-induced overvoltages (Said and Anane, 2020). Internal overvoltages in power systems can be further categorized into transient overvoltages and operational overvoltages (Ren and Zhang, 2021), arising from changes in the internal state of the power system. With the development of the grid, high-voltage lines have gradually become the backbone of the power system. Overvoltage phenomena can occur when there is long-distance transmission or line faults, potentially causing the voltage to exceed the electrical insulation of the lines or equipment, leading to equipment damage and economic losses to the power grid.
Currently, there have been numerous studies on traditional power system overvoltages (Othman et al., 2019; Said and Anane, 2020; Ren and Zhang, 2021; Lazzari et al., 2023), which are well-established in engineering calculations. However, the emergence of new types of overvoltage issues resulting from the integration of a high proportion of new energy sources requires further in-depth investigation.
In contemporary scenarios of novel power systems, several situations exhibit pronounced overvoltage issues. These scenarios include the new energy AC export system, the coexistence of new energy sources and synchronous generators through AC export, and the combination of new energy sources with synchronous generators through DC export. These new energy power systems frequently encounter problems such as equipment disconnection and consequent power losses due to overvoltage issues (Zou et al., 2018; Liu et al., 2021; Yin and Li, 2021; Xin et al., 2023). In power grids with a high proportion of power electronic devices, temporary overvoltages lead to the disconnection of new energy devices, resulting in reduced new energy output and imposing significant constraints on new energy export (Sun et al., 2012; Liu et al., 2020; Tang et al., 2022). The primary causes of overvoltage in new energy power systems are as follows: firstly, the lag in control adjustments of reactive power compensation devices at new energy stations results in excess reactive power, elevating voltage levels. Secondly, the response lag of new energy fault ride-through control strategies causes a momentary surplus of reactive power during the grid voltage restoration, leading to overvoltage. In summary, overvoltage issues in new energy power systems stem from reactive power surplus. Manifesting as the steady-state frequency voltage exceeding its normal operational value, it falls within the category of steady-state frequency overvoltage, specifically defined as a novel type of steady-state frequency transient overvoltage. However, due to the distinct mechanism of its occurrence compared to overvoltage issues in traditional power systems, it is classified separately from traditional steady-state frequency overvoltages, as illustrated in Figure 1.
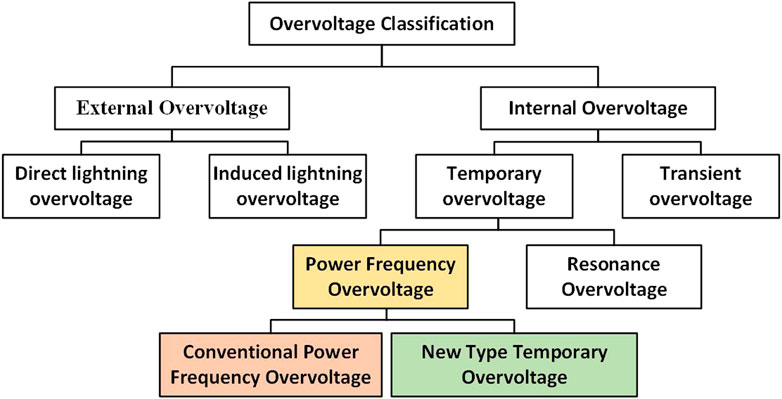
FIGURE 1. The classification of overvoltage.
Transient overvoltages caused by delayed responses in fault ride-through control strategies for new energy sources can be categorized into two main types: control-level delayed responses and delay-induced responses. Regarding control-level delayed responses, there has been considerable research in this area. A classic scenario is slow integration in the outer control loop, leading to integrator saturation and consequent response delays. The other category involves delay-induced responses, stemming from the fact that power electronic devices have a certain sampling frequency, and the voltage magnitude of the system needs to be computed within the control system, resulting in inevitable delays. Currently, there is relatively limited research on overvoltages at the delay level, making it essential to study the mechanisms of low-delay overvoltages and propose relevant assessment methods and control measures.
The specific principle behind overvoltages induced by low delays is as follows: during the process of a system fault that causes a decrease in grid voltage, the grid-tied inverters of new energy generation equipment switch to low-voltage ride-through control, causing a rapid drop in active power and a simultaneous rapid increase in reactive power. The voltage restoration process in the grid typically takes place within 10 m after events like AC fault clearance (Zou et al., 2018). Due to the delay in the feedback loop caused by the sampling characteristics, the inverter maintains the working state it had during low-voltage ride-through. This results in a high level of reactive power output, which increases as the grid voltage at the connection point rises. Consequently, the terminal voltage of new energy devices continues to rise. When new energy devices are connected to a weak grid, the increased reactive power output may cause the voltage on the low-voltage side of the terminal bus and nearby devices like SVG to exceed protection settings. This can lead to a failure in high-voltage ride-through and subsequently cause the disconnection of new energy sources (Liu et al., 2019; Liu et al., 2020; Lazzari et al., 2023). Using different Fault Current Limiter (FCL) topologies can enhance the fault ride-through capability of PMSG wind turbine systems during short-circuit faults (Okedu, 2022). A self-powered solid-state fault current limiter is proposed in reference (Xu et al., 2021), which detects short-circuit faults by sensing an increase in fault current. Reference (Abdelkader et al., 2023) combines Model Predictive Control (MPC) with Superconducting Magnetic Energy Storage (SMES) devices and improved wind power generation system grid-side inverter control to achieve overvoltage suppression during grid disturbances.
Additionally, new energy generation equipment is often located in close electrical proximity, has complex control structures, is prone to mutual coupling among various devices, and can interact with weak grids. These interactions can create multiple time-scale oscillations within the system, resulting in significant voltage fluctuations. This, in turn, can lead to overvoltage occurrences in the vicinity of the equipment or at the station, potentially causing more severe consequences (Mahseredjian et al., 2009; Fan and Miao, 2020; Subedi et al., 2021; Liang et al., 2022).
As renewable energy continues its rapid growth, the power grid faces new challenges. The high penetration of renewable energy sources into the grid results in decreased grid strength, lower short-circuit ratios, and reduced inertia, leading to transient overvoltage issues. However, diverse control strategies employed by renewable energy units and complex electrical interactions give rise to unclear mechanisms and influencing factors. Moreover, there is a shortage of assessment methods that consider the dynamic reactive power support provided by renewable energy units for transient steady-state frequency overvoltages. In-depth research into transient overvoltage issues, including mechanistic understanding and accurate assessments, is of paramount importance to ensure the safety of wind farms, stable operation of transmission systems, and efficient integration of renewable energy (Hamed and Hazzab, 2018).
This paper primarily accomplishes the following tasks: Chapter 2 reveals the mechanism of transient steady-state frequency overvoltages due to delayed responses in low-voltage ride-through of renewable energy units. Chapter 3 quantitatively analyzes the influence patterns of various factors, such as control parameters for renewable energy units, system short-circuit ratios, and impedance ratios, based on analytical expressions. Chapter 4 validates the impact of short-circuit ratios, impedance ratios, and critical control coefficients on overvoltages after system fault recovery through simulations and semi-physical experiments, affirming the accuracy of the theoretical analysis. Chapter 5 summarizes the main conclusions of this paper.
The typical structure and control diagram of a direct driven permanent magnet synchronous generator (PMSG) wind turbine grid-connected system are illustrated in Figure 2. The wind turbine is directly connected to the rotor through a drive shaft. The power output is transformed by a full-power converter and then connected to the grid via a step-up transformer. The grid-side converter (GSC) employs dual-closed-loop vector control for voltage and current. It utilizes a Phase-Locked Loop (PLL) for rapid detection of grid-side voltage amplitude and phase. Voltage outer-loop control ensures the stability of the DC voltage of the full-power converter, while current inner-loop control employs a PI controller to ensure rapid control response. On the machine side, the machine-side converter (MSC) employs dual-closed-loop vector control with power outer-loop and current inner-loop control. The power outer-loop utilizes maximum power point tracking (MPPT) control to maximize power tracking under different wind speeds, ensuring the economic efficiency of wind turbine grid-connected generation. Similarly, the current inner-loop employs PI control to achieve rapid response of dq-axis current (Jain et al., 2015; Mercado-Vargas et al., 2015).
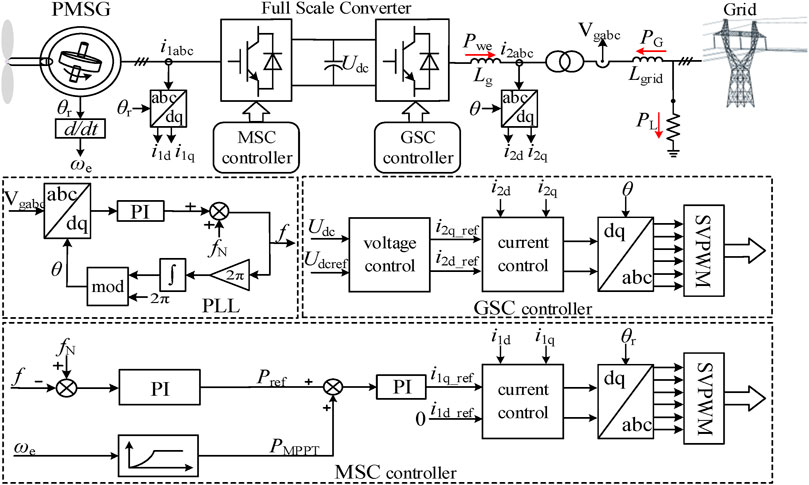
FIGURE 2. Topology and control block diagram of a grid-connected PMSG-based wind power generation system.
When voltage drops occur due to grid faults or disturbances, the control logic for the PMSG wind turbine generator enters the low-voltage ride-through phase, as illustrated in Figure 3. Control loops ① and ④ represent the voltage and current dual-loop control during normal operation of the wind turbine generator, while control loops ② and ③ pertain to the low-voltage ride-through control.
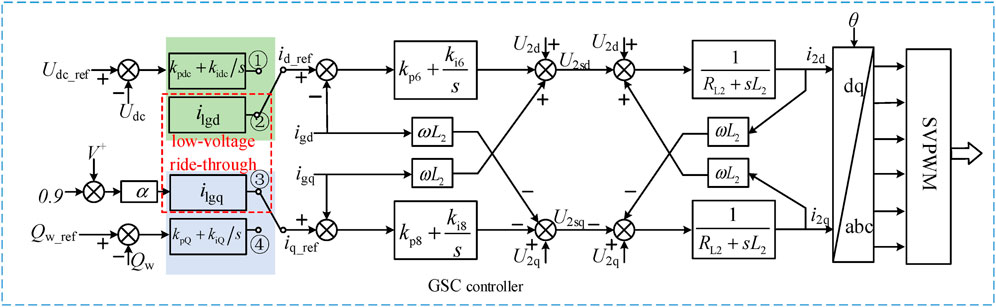
FIGURE 3. Block diagram of PMSG with low-voltage ride-through control logic.
Under normal operation in the Maximum Power Point Tracking (MPPT) mode, the Grid-Side Converter (GSC) controller operates in loops ① and ④. However, when the grid voltage drops, according to GB/T 19963.1-2021 “Technical Regulations for Wind Power Plant Grid Connection - Part 1: Onshore Wind Power,” the wind turbine generator should have the capability to provide dynamic reactive power support to the grid. In this case, the GSC controller switches to the fault ride-through control depicted in loops ② and ③. Here, α represents the low-voltage ride-through reactive current coefficient of the wind turbine generator, and V+ is the positive-sequence component of the grid-side voltage of the wind turbine generator.
During the low-voltage ride-through process, the wind turbine generator can be abstracted as a Voltage-Controlled Current Source (VCCS). The output current of the VCCS is influenced by the positive-sequence component of the grid-side voltage and the low-voltage ride-through reactive current coefficient. By adjusting the output current of the VCCS, it is possible to simulate the dynamic response characteristics of the wind turbine generator during the low-voltage ride-through process.
Once grid faults are rectified, and grid voltages return to normal levels, the wind turbine unit transitions from low-voltage ride-through control to MPPT control. However, inherent delays during the control strategy switching process hinder the rapid withdrawal of reactive power. Consequently, temporary overvoltage occurs. The delays during the control strategy switching process encompass signal sampling and processing delays, logic decision delays, and control switching delays.
Upon rectifying faults and restoring grid voltage to normal levels, during the transition of the wind turbine unit from low-voltage ride-through to MPPT control, delays arising from the control strategy transition process can lead to the continued generation of reactive power and, consequently, temporary overvoltage. These delays in the wind turbine unit’s control strategy transition process primarily consist of the following components: signal sampling and processing delays, logic decision delays, and control switching delays.
Signal sampling and processing delays encompass several aspects, including PLL voltage locking delay, internal data transfer delay, data filtering delay, and PLL voltage unlocking delay. Logic decision delays involve factors such as the start-up delay for fault ride-through, the delay in determining the injection of reactive power during low-voltage ride-through, and the delay in determining the cessation of reactive power injection during low-voltage ride-through. Control switching delay refers to the time required for the wind turbine unit to transition from fault ride-through to normal operation.
Based on an analysis of control parameters from typical wind turbine unit manufacturers, it is observed that PLL voltage locking delay is typically set to 1∼2 m, and PLL voltage unlocking delay is typically set to 6∼8 m within the signal sampling and processing delays. These delays primarily result from transient phenomena in the grid voltage, characterized by severe distortion and oscillations when AC faults are cleared, and grid voltage rapidly recovers. To prevent frequent triggering of low-voltage ride-through control signals due to fluctuations in voltage amplitude, it is imperative to measure the root mean square (RMS) value of voltage amplitude over one complete cycle.
Internal data transfer delays and data filtering delays are typically on the order of microseconds. An analysis of typical high-voltage inverters, as discussed in reference (Zou et al., 2018), reveals transmission and filtering time delays. For instance, the sampling of high-voltage current and the transmission of measurement data to the polar control takes approximately 76 microseconds. Internal data transfer within polar control requires around 20 microseconds. Data filtering and synchronization of measurement data take approximately 90 microseconds. Transmitting modulated waves to valve control takes about 64.8 microseconds, and internal data transfer within valve control takes approximately 10 microseconds. Consequently, internal data transfer delays and data filtering delays can be considered negligible.
Within logic decision delays, the delay in determining the injection of reactive power during low-voltage ride-through is typically set to 5∼6 m. The start-up delay for fault ride-through is typically set to 0.5∼0.6 m, and the delay in determining the cessation of reactive power injection during low-voltage ride-through is typically set to 5∼6 m.
Control switching delay mainly refers to the time needed for the wind turbine unit to transition from fault ride-through to normal operation once the RMS minimum value of three-phase voltage at the grid connection point exceeds the threshold for exiting low-voltage ride-through. When this condition is met, the low-voltage ride-through switch-over logic initiates timing. After surpassing the designated control switching delay, the wind turbine unit’s low-voltage ride-through flag is set to 1, signifying the exit from the low-voltage ride-through mode. The control switching delay is set to ensure accurate detection of the minimum RMS value of three-phase voltage at the grid connection point, maintain control system stability, and is typically set between 5 and 10 m.
The aforementioned logic decision delays and control switching delays can be reduced or eliminated by employing faster CPUs, improved communication technologies, or enhanced sequential logic. However, it is crucial to select an appropriate sampling window during the signal sampling delay, especially in the PLL sampling phase, to calculate the root mean square (RMS) value required for control. This selection prevents frequent switching between outer-loop control and low-voltage ride-through control.
Based on the preceding analysis, it becomes evident that during the transition from low-voltage ride-through to normal operation of the wind turbine unit, the delays introduced by signal sampling and processing, logic decision-making, and control switching invariably yield a delay of 15–20 m. Compliant with GB/T 19963.1-2021, which mandates that wind farms withdraw dynamic reactive power increments within 40 m of the grid voltage returning to 90% or more of the nominal voltage, these delays are well within the stipulated standards. Nevertheless, the delay leads to an inability to promptly withdraw reactive power after low-voltage ride-through, culminating in the continuation of reactive power generation and temporary overvoltage when the wind turbine unit is connected to a weak grid. This transient overvoltage in the wind turbine unit will be subjected to a comprehensive quantitative analysis in the subsequent sections of this paper.
The low-voltage ride-through process of the wind turbine unit unfolds in four distinct stages, as evidenced by Figure 4, which showcases measured waveforms during a typical wind turbine controller’s low-voltage ride-through. These stages are characterized by their unique features. Stage I signifies the standard operational state of the wind turbine unit, with symmetrical three-phase voltages and grid voltage at the wind turbine unit’s grid connection point at 1 p. u. Stage II occurs when the grid experiences a symmetrical three-phase fault, causing a drop in grid voltage. At this juncture, the wind turbine unit enters the low-voltage ride-through mode, switching to low-voltage ride-through control to provide dynamic reactive power support to the grid. Stage III encompasses the 30 m duration following the clearance of the grid fault. Due to the delays introduced in the control strategy switching process as previously discussed, the low-voltage ride-through control remains engaged, and the wind turbine unit continues to supply reactive power as per low-voltage ride-through requirements. This results in an excess of reactive power and consequent temporary overvoltage exceeding 1.4 p.u. at the grid connection point. This stage constitutes the primary focus of this paper and will be subject to a detailed quantitative analysis of the transient overvoltage in the wind turbine unit. Lastly, Stage IV denotes the recovery phase after the wind turbine unit concludes its low-voltage ride-through. Figure 4 demonstrates that the wind turbine unit’s waveform during this phase exhibits a distinct “initially low, then high, followed by low” characteristic. Detailed analysis of transient overvoltage during this process will follow in subsequent sections.
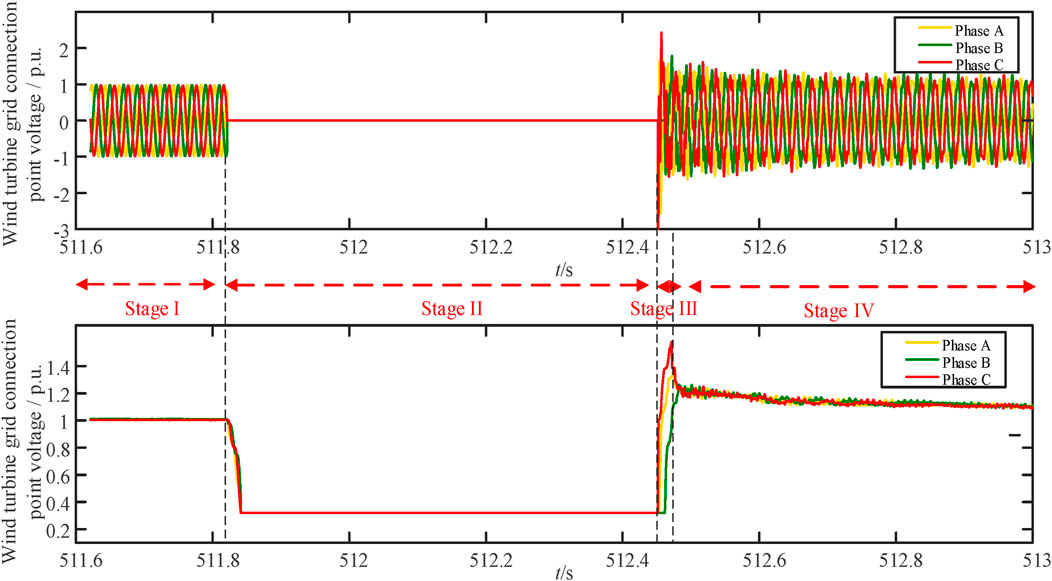
FIGURE 4. Measured waveforms during the low-voltage ride-through of a typical wind turbine.
Taking the occurrence of a three-phase symmetrical voltage fault in a new energy single-site access system as an example, an analysis is conducted to examine the influence of the fault-transient parameters of the PMSG wind turbine unit on the overvoltage at its grid connection point. Particular emphasis is placed on overvoltages in the fundamental positive sequence. A mathematical model of the wind power grid integration system is established. The PMSG single-site is equivalently represented as a controlled current source, and the higher-level grid adopts Thevenin equivalence. The equivalent circuit in the fundamental positive sequence can be obtained,.
The relationship of the voltage at the grid connection point of the PMSG station can be expressed as:
Here,
Using the synchronous rotating dq coordinate system with voltage orientation at the machine end of the PMSG wind turbine generator as the reference coordinate system, we can multiply both sides of Eq. 1 by e-jω, separate the real and imaginary parts, and obtain:
Considering |θ| < 90°, Eq. 2 can be simplified as:
Eq. 3 describes the relationship between the voltage at the grid connection point of the PMSG single-site and the output current, grid parameters (including Thevenin equivalent potential and equivalent impedance), all in the context of the per-unit system. The SCR of the system is related to Thevenin equivalent impedance as follows:
Considering the Impedance Ratio (IR) of the system as IR = X/R, and solving the simultaneous Eqs 2–4, the relationship between the grid-connected point voltage of the PMSG single station and the output current, the system short-circuit ratio and the system impedance ratio can be obtained as follows:
During symmetric faults in the grid-connected system leading to a drop in system voltage, the voltage at the grid connection point is influenced by the output current of the PMSG station and the AC system parameters. The Thevenin equivalent potential Vg exhibits a trend of “normal-low-normal,” representing the pre-fault steady-state, low voltage during the fault, and post-fault steady-state conditions. Additionally, the Thevenin equivalent impedance varies due to fault impedance. Wind turbine generators switch to low-voltage ride-through control after the fault, with the GSC controller transitioning to modes ② and ③, rapidly injecting reactive power to create temporary grid frequency overvoltage.
Considering the aforementioned delays, during the transient overvoltage phase following the fault, the high-voltage ride-through strategy of wind turbine generators has not yet initiated. At this stage, the focus is on the low-voltage ride-through control of the PMSG. By substituting the current expression during the low-voltage ride-through process of the PMSG wind turbine generator into the current I in Equation 5, we can further obtain expressions for grid point overvoltage in terms of PMSG fault crossing parameters. Since the grid point voltage is quite low during the fault, the active power output of the PMSG during the low-voltage ride-through period can be approximated as zero (Id ≈ 0). The reactive current output of the PMSG is assumed to follow a reactive current instruction value based on the grid point RMS voltage Vf, which is determined in various ways. According to GB/T 19963.1-2021 “Technical Requirements for Grid Connection of Wind Farms - Part 1: Onshore Wind Power,” the reactive current must satisfy the following:
Here, ∆I represents the dynamic reactive current increment injected by the PMSG wind farm, K1 is the dynamic reactive current proportionality coefficient, which is greater than or equal to 1.5 and less than or equal to 3, and Vf is the per-unit value of the grid point voltage during the fault, with IN representing the rated current.
Considering a typical fault crossing strategy employed by a domestic wind turbine generator manufacturer, the reactive current expression is:
Where α represents the equivalent reactive coefficient. Substituting Equation 7 into Equation 5, the overvoltage expression of PMSG wind farm grid-connected point can be obtained as follows:
Based on Equation 8, the influence of low voltage ride through behavior of PMSG wind farm on its grid-connected point overvoltage can be analyzed.
As Equation 8, it is evident that the factors influencing temporary overvoltage in wind turbine generators primarily include the equivalent reactive coefficient α, the extent of grid voltage drop, SCR, IR, among others. The derivation process of this analytical equation assumes that the PMSG wind turbine generator’s output reactive current is equal to its reactive current command value. However, in practice, it is influenced by the control strategy of the PMSG wind turbine generator’s converter, and there is a transient delay before the output reactive current reaches its commanded value. Translated to the voltage at the grid connection point of the PMSG wind farm, this transient fluctuation in reactive current mainly affects the transition of the voltage from the low-voltage stage to the high-voltage stage in stage III.
After the Clark transformation and Park transformation, the mathematical model of the grid-side inverter in a synchronous rotating coordinate system can be obtained. Based on this mathematical model, with current flowing into the inverter as positive, the grid-side inverter voltage equations for the PMSG wind turbine generator in the dq coordinate system are as follows:
Where ud and, uq are the dq-axis components of the grid voltage, id and iq are the dq-axis components of the grid-side current, Lg is the equivalent inductance of the grid-side inverter, vd and vq are the dq-axis components of the three-phase output voltage of the grid-side inverter, Rg is the equivalent resistance on the grid side, and ω1 is the synchronous angular velocity of the grid voltage.
Ignoring the voltage outer loop, the current inner loop control equation can be derived as follows:
Where kip and kii are the proportional and integral coefficients of the grid-side inverter current inner loop PI controller, and i*d and i*q are the dq-axis components of the reference values of grid-side current.
When Eqs 9, 10 are simultaneously solved and organized, the following equation is obtained:
Differentiating Eq. 11 leads to:
Filtering resistance Rg being disregarded, Eq. 12 can be transformed into the standard form of a second-order system, resulting in:
When a fault is cleared, active and reactive currents can be considered as the superposition of zero-input response and step response to the respective reference values. Consequently, analytical solutions for active and reactive currents can be obtained as follows:
Where id (0) and iq (0) are the dq-axis components of grid-side current when the fault is cleared, ζ = kip/(4Lgkii)1/2,β = arctg [(1-ζ2)1/2/ζ],ω=(kii/Lg)1/2.
Analysis, as deduced from Eq. 14, reveals that within a certain range, an appropriate increase in the proportional coefficient of the current inner loop, kip, is beneficial for the grid-side inverter current of the PMSG wind turbine generator to more rapidly approach the reference value and attain a steady state.
When Eq. 14 is substituted into the grid point voltage Eq. 5 and further analyzed, it is evident that increasing the proportional coefficient kip of the current inner loop is advantageous for enabling the grid-side current to rapidly reach a stable value after a fault occurs. This reduces the transient components of the grid-side current that cause voltage surges at the grid point, thus mitigating the transient impact on the wind farm grid point voltage. Due to the influence of different control strategies and control parameters, there is diversity in the transient process of grid point voltage variation in Stage III. However, the control process has a relatively minor effect on the amplitude of overvoltage at the grid point. Therefore, the assumptions derived in Eq. 8 are considered reasonable.
Next, a numerical analysis is conducted on the factors affecting grid point overvoltage in PMSG wind farms. Initially, the analysis is performed considering a SCR of 5 and an IR of 10 as the baseline conditions. Under normal operation, wind turbine generators operate at unity power factor with Id = 1 and Iq = 0. Assuming the system Thevenin equivalent potential is 1, we can calculate R = 0.02 and X = 0.199, resulting in a grid point voltage of 0.9999 per unit (p.u.). When α is set to 1 and the grid voltage drops to 0.2 p. u. during the fault period, and the wind farm does not provide reactive support, the grid point voltage during the fault period is 0.2 p. u. However, if the wind farm issues reactive power according to Eq. 7 during the fault period, the grid point voltage during the fault period is calculated as 0.3447 p. u. It is evident that the provision of reactive power by the wind farm during the fault period can effectively support the grid point voltage. But if, after the fault is cleared, the grid voltage rapidly recovers while the wind turbine generator continues to operate in the low-voltage ride-through mode, according to Eq. 8, the grid point voltage is calculated as 1.1452 p.u., indicating the occurrence of temporary overvoltage.
Subsequently, an analysis is performed on the specific effects of wind turbine generator’s equivalent reactive coefficient α, system SCR, and IR on this overvoltage. With a fixed system IR of 10, the influence of different SCR on the overvoltage level after the grid voltage drops to different degrees is analyzed. According to Eq. 8, the calculated results are shown in Figure 5. It is observed that the reactive current coefficient is directly proportional to the amplitude of overvoltage after the fault. In other words, the more reactive power the wind farm provides during the fault period, the higher the amplitude of overvoltage after the fault.
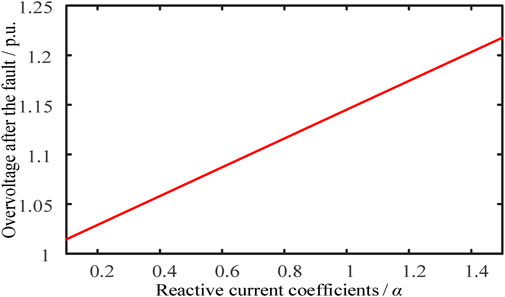
FIGURE 5. Post-fault overvoltage under different reactive current coefficients.
While keeping the system IR at 10, the effect of different SCR on the overvoltage level after the grid voltage drops to various extents is analyzed. The calculated results, based on Eq. 8, are shown in Figure 6. Furthermore, using the example of the grid voltage dropping to 0.2 p. u. during the fault period, the calculated temporary overvoltage for different SCR is presented in Figure 7.
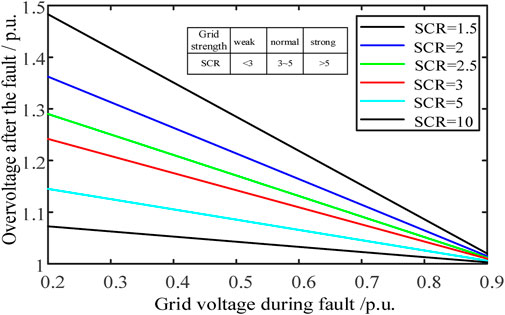
FIGURE 6. Post-fault overvoltage under different fault severity with different SCR.
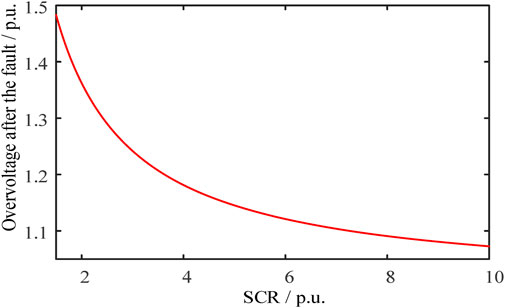
FIGURE 7. Post-fault overvoltage with different short-circuit ratios when the grid voltage drops to 0.2 p.u.
It is evident that the more severe the grid voltage drop during the fault period, the higher the amplitude of temporary grid frequency overvoltage. Under the same degree of voltage drop, a stronger system leads to a lower overvoltage amplitude.
With the grid SCR fixed at 5 and assuming the grid voltage drops to 0.2 p.u. during the fault period, the influence of different IR on the overvoltage after the fault is analyzed. According to Eq. 8, the results are presented in Figure 8.
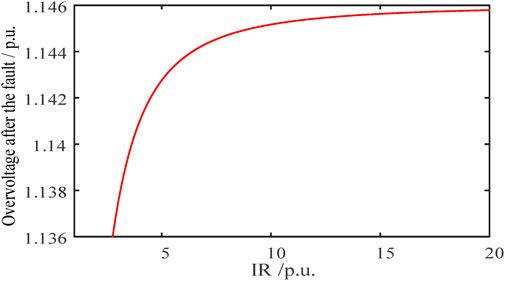
FIGURE 8. Post-fault overvoltage with different impedance ratios when the grid voltage drops to 0.2 p.u.
It can be observed that a higher impedance ratio results in a higher amplitude of temporary grid frequency overvoltage. However, compared to the impact of SCR, the influence of IR is relatively small.
To further validate the results of theoretical analysis, this section constructed a dynamic link library model of a wind turbine generator for simulation verification. It is important to note that, for the purpose of improving simulation efficiency, this section used a single wind turbine generator to simulate a wind farm. The model primarily consists of the wind turbine generator, transformer, external grid, low-voltage detection, and high-voltage detection modules. Among these, the interfaces of the wind turbine generator model include features such as wind turbine generator startup, reactive power, power factor, terminal voltage setting, active power setting, low-voltage ride-through reactive power coefficient setting, fault ride-through function enablement, high-ride-through reactive power coefficient, reactive power mode selection, protection function activation, and more. These interface parameters can be modified online by inputting parameters into the Simulink model.
Different fault ride-through control parameters can significantly affect the magnitude of reactive power during low-voltage ride-through of wind turbine generator. In this section, based on dynamic link library models of typical PMSG wind turbine generator from a domestic manufacturer, a three-phase short-circuit fault with ground fault resistance was simulated at the point of wind turbine generator grid connection, lasting for 0.1 s. Different equivalent reactive power coefficients α were set to verify their impact on the maximum transient overvoltage at the generator terminal. The simulation results are shown in Figure 9.

FIGURE 9. Impact of α on the terminal voltage of PMSG after a three-phase short-circuit fault.
When a three-phase ground fault with ground fault resistance occurs at the grid connection point of the wind turbine generator at 4 s, the effective value of the terminal voltage drops to 0 per unit (p.u.). At this point, the wind turbine generator enters the low-voltage ride-through condition. After clearing the fault at 4.1 s, as shown in Figure 9, it can be observed that the generator’s terminal voltage increases with increasing α. When α is 3, the terminal voltage approaches 1.15 p.u. This is because during the low-voltage ride-through period, as α increases, the generated reactive current also increases. After clearing the fault, due to the control strategy switching delay, the generator cannot quickly retract reactive current and restore active current to its pre-low-ride-through state. This leads to a period of tens to hundreds of milliseconds after the fault clearance where the system experiences a surplus of reactive power. The larger α, the greater the surplus of reactive power, resulting in a larger transient overvoltage at the generator terminal.
SCR as a measure of system strength, directly reflects the strength or weakness of the system and has a significant impact on overvoltage. Based on dynamic link library models from different wind turbine generator manufacturers, the impact of SCR on the generator terminal overvoltage was analyzed. The simulation results for a typical PMSG wind turbine generator under different SCR conditions are shown in Figure 10.
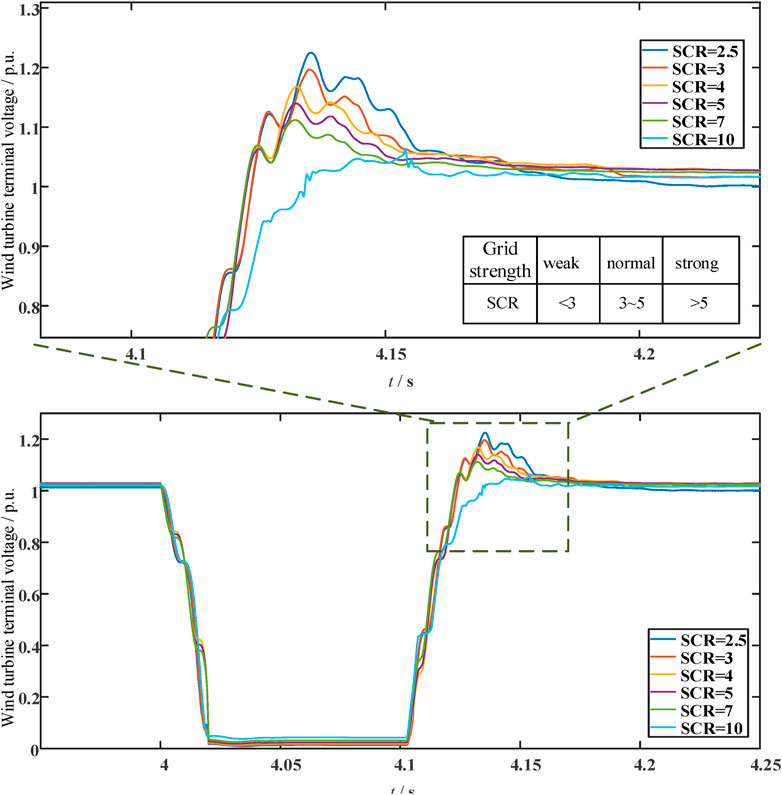
FIGURE 10. Impact of SCR on the terminal voltage of PMSG after a three-phase short-circuit fault.
The PMSG wind turbine generator enters the low-voltage ride-through at 4 s, and after clearing the fault at 4.1 s, as shown in Figure 10, the terminal voltage increases as SCR decreases. When SCR is 2.5, the terminal voltage approaches 1.25 p. u. This is because SCR reflects the strength of the system’s voltage support capability. A larger SCR indicates a stronger system stability, resulting in a stronger ability to suppress transient overvoltage at the generator terminal after the fault is cleared. In other words, there is a negative correlation between the generator’s transient terminal overvoltage and SCR. With the increasing integration of a high proportion of wind turbine generators into the system, the overall SCR of the grid decreases. Since SCR is a significant factor affecting the generator’s transient terminal overvoltage, further analysis will be conducted in this paper to investigate transient terminal overvoltage of wind turbine generators under low SCR conditions.
X/R represents the ratio of reactance to resistance in the system, indicating the magnitude of reactance in the system. Different X/R values reflect the system’s strength indirectly, even with the same SCR value. This section validates the impact of different system impedance ratios on the generator terminal overvoltage. As shown in Figure 11, they depict the transient overvoltage at the generator terminal of dynamic link library models of PMSG wind turbine generators different X/R conditions. With a fixed SCR value, higher X/R values result in larger equivalent grid reactance and weaker grid strength, leading to higher transient overvoltage at the generator terminal after a fault. It is evident that X/R has a smaller impact on transient terminal overvoltage compared to SCR, and the effect of impedance ratio is relatively minor, consistent with the conclusions drawn from the numerical analysis discussed earlier.
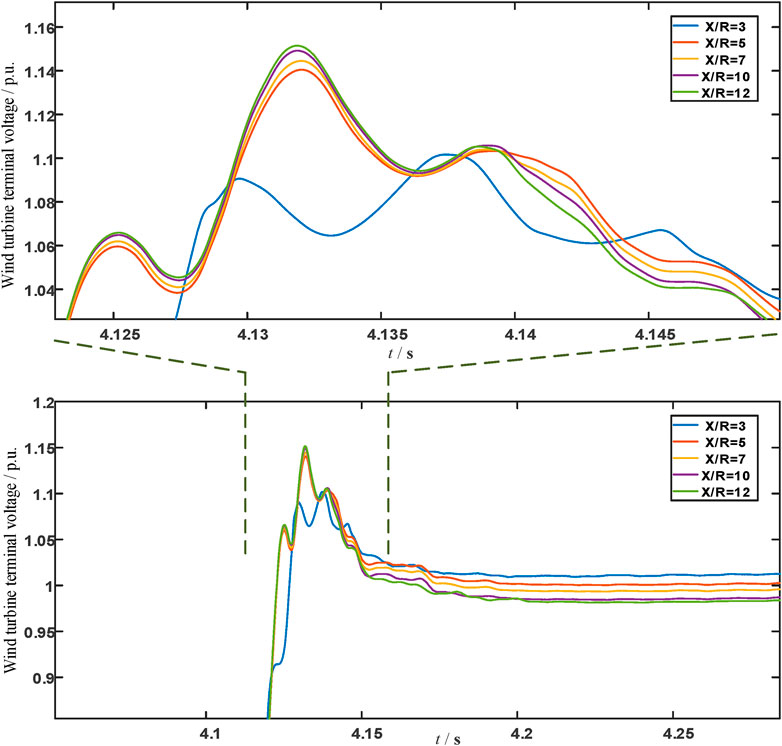
FIGURE 11. Impact of IR on the terminal voltage of PMSG after a three-phase short-circuit fault.
The typical PMSG wind turbine controller physical simulation system consists of an RTLAB real-time simulator and a real controller for the PMSG wind turbine unit. The overall wiring of the physical simulation system is shown in Figure 12.
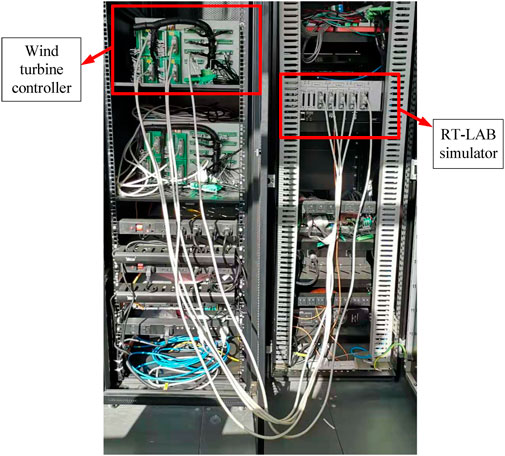
FIGURE 12. Physical simulation platform of PMSG wind turbine.
When the SCR is set to 2 and a three-phase symmetrical fault occurs at 258.6 s, resulting in a voltage drop to 0.2 p. u., with the fault lasting for 625 m, the experimental results, as shown in Figure 13, indicate that the wind turbine unit’s terminal-side voltage approaches an effective value of approximately 1.4 p. u. after the conclusion of the low-voltage ride-through process.
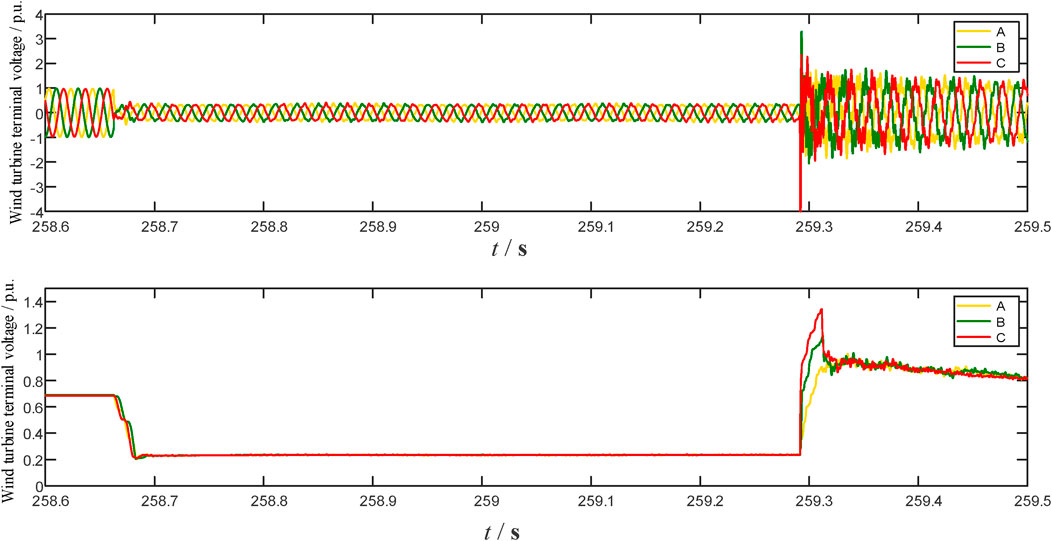
FIGURE 13. Measured overvoltage waveform at the wind turbine grid connection point.
When the SCR is set to 2 and a three-phase ground fault is introduced at 511.85 s, with the fault persisting for 625 m, the test results displayed in Figure 14 reveal that after the fault is cleared, the grid voltage returns to a steady state, but the wind turbine unit’s terminal voltage exceeds the steady-state value, reaching 0.5 p. u. This temporary overvoltage issue is more severe compared to the condition where a three-phase fault leads to a voltage drop to 0.2 p.u.
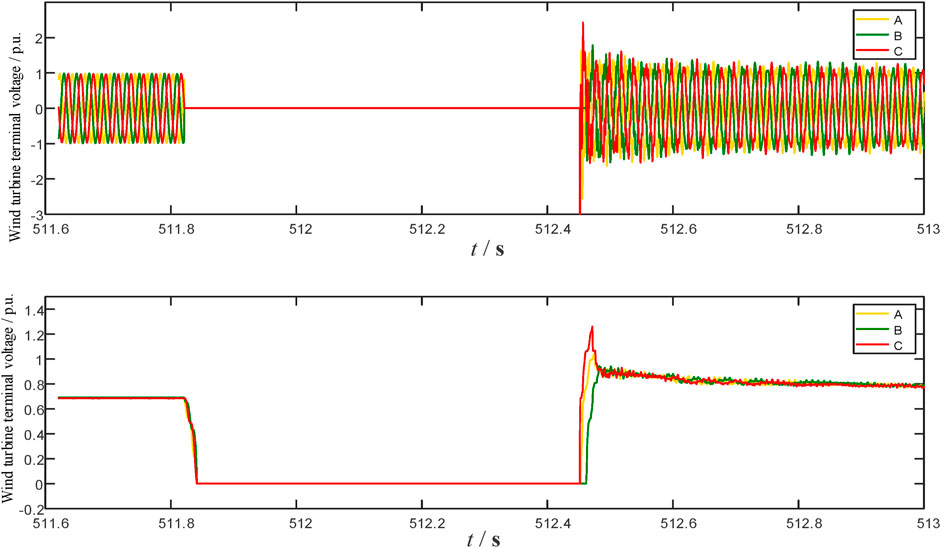
FIGURE 14. Measured overvoltage waveform at the wind turbine grid connection point.
Based on typical PMSG wind turbine controller behavior, it is further confirmed that, following a low-voltage ride-through, the wind turbine unit experiences temporary overvoltage at the grid connection point due to the surplus reactive power in the system caused by a delay in exiting the low-ride-through strategy.
Drawing upon the fundamental frequency equivalent circuit of wind power systems, an analysis is conducted to derive the mechanisms dominating the temporary overvoltage in grid-connected PMSG-based Wind Turbine Systems after AC faults. The study identifies that the accumulation of surplus reactive power, resulting from time delays in processes such as phase-locked loop operation, measurement and assessment of fault ride-through control, and execution of control actions following fault clearance, constitutes the primary catalyst for temporary overvoltage occurrences. Using the obtained analytical expressions, the influence of various factors on the characteristics of temporary overvoltage is quantitatively assessed, including the fault severity, fault ride-through control parameters of WTGs, system short-circuit ratios, and impedance ratios. Simulation and semi-physical validation have verified the following conclusions:
1) A heightened severity of grid voltage drop during the fault corresponds to an elevated amplitude of overvoltage post-fault.
2) When subjected to the same grid voltage drop, a system with greater short-circuit ratio correlates with diminished overvoltage amplitude, while an increase in impedance ratio is associated with larger overvoltage amplitude. The impact of the impedance ratio is relatively small compared to that of the short-circuit ratio.
3) The equivalent reactive current coefficient exhibits a direct proportionality to the amplitude of overvoltage following the fault. Put simply, greater provision of reactive power by the WTG during the fault results in a higher amplitude of post-fault overvoltage.
The original contributions presented in the study are included in the article/supplementary material, further inquiries can be directed to the corresponding author.
BC: Writing–original draft, Writing–review and editing, Data curation, Formal Analysis, Project administration. HL: Writing–original draft, Writing–review and editing. QX: Investigation, Resource, Writing–review and editing.
The authors declare that no financial support was received for the research, authorship, and/or publication of this article.
Authors BC and HL were employed by Inner Mongolia Electric Power Research Institute, Inner Mongolia Electric Power (Group) Co., Ltd.
The remaining authors declare that the research was conducted in the absence of any commercial or financial relationships that could be construed as a potential conflict of interest.
All claims expressed in this article are solely those of the authors and do not necessarily represent those of their affiliated organizations, or those of the publisher, the editors and the reviewers. Any product that may be evaluated in this article, or claim that may be made by its manufacturer, is not guaranteed or endorsed by the publisher.
All claims expressed in this article are solely those of the authors and do not necessarily represent those of their affiliated organizations, or those of the publisher, the editors and the reviewers. Any product that may be evaluated in this article or claim that may be made by its manufacturer is not guaranteed or endorsed by the publisher.
Abdelkader, S. M., Morgan, E. F., Megahed, T. F., Rohouma, W., and Abdel-Rahim, (2023). A model predictive control strategy for enhancing fault ride through in PMSG wind turbines using SMES and improved GSC control. Front. Energy Res. 11, 1277954. doi:10.3389/fenrg.2023.1277954
Andreotti, A., Araneo, R., Faria, J. B., He, J., Petrache, E., Pierno, A., et al. (2023). On the role of shield wires in mitigating lightning-induced overvoltages in overhead lines - Part I: a critical review and a new analysis. IEEE Trans. Power Deliv. 38 (1), 335–344. doi:10.1109/TPWRD.2022.3189311
Fan, Y. L., and Miao, Z. (2020). Wind in weak grids: low-frequency oscillations, subsynchronous oscillations, and torsional interactions. IEEE Trans. Power Syst. 35 (1), 109–118. doi:10.1109/TPWRS.2019.2924412
Hamed, A., and Hazzab, A. (2018). Modeling and real-time simulation of induction motor using RT-LAB. Int. J. Power Electron. Drive Syst. 9 (4), 1476. doi:10.11591/ijpeds.v9.i4.pp1476-1485
Hannan, M. A., Al-Shetwi, A. Q., Mollik, M. S., Ker, P. J., Mannan, M., Mansor, M., et al. (2023). Wind energy conversions, controls, and applications: a review for sustainable technologies and directions. Sustainability 15 (5), 3986. doi:10.3390/su15053986
Hossain, M. M., and Ali, M. H. (2015). Future research directions for the wind turbine generator system. Renew. Sustain. Energy Rev. 49, 481–489. doi:10.1016/j.rser.2015.04.126
Jain, B., Jain, S., and Nema, R. K. (2015). Control strategies of grid interfaced wind energy conversion system: an overview. Renewable and Sustainable Energy Reviews 47, 983–996. doi:10.1016/j.rser.2015.03.063
Lazzari, E. F., de Morais, A. P., Ramos, M., Ferraz, R., Marchesan, T., Bender, V. C., et al. (2023). A comprehensive review on transient recovery voltage in power systems: models, standardizations and analysis. Energies 16 (17), 6348. doi:10.3390/en16176348
Liang, X., Chai, H., and Ravishankar, J. (2022). Analytical methods of voltage stability in renewable dominated power systems: a review. Electricity 3 (1), 75–107. doi:10.3390/electricity3010006
Liu, X., Chen, X., Li, C., Shahidehpour, M., Sun, K., Cao, Y., et al. (2021). Multi-stage voltage support optimization for microgrids with multiple distributed generation units. IEEE Trans. Smart Grid 12 (1), 141–156. doi:10.1109/TSG.2020.3016601
Liu, X., Shahidehpour, M., Chen, X., Yi, J., Wu, Q., et al. (2020). Fault current mitigation and voltage support provision by microgrids with synchronous generators. Ieee Trans. Smart Grid 11 (4), 2816–2831. doi:10.1109/TSG.2020.2968952
Liu, X., Shahidehpour, M., Gao, Y., Zhou, B., Zhang, Y., et al. (2019). Fault current hierarchical limitation strategy for Fault ride-through scheme of microgrid. Ieee Trans. Smart Grid 10 (6), 6566–6579. doi:10.1109/TSG.2019.2907545
Mahseredjian, J., Dinavahi, V., and Martinez, J. A. (2009). Simulation tools for electromagnetic transients in power systems: overview and challenges. IEEE Trans. Power Deliv. 24 (3), 1657–1669. doi:10.1109/TPWRD.2008.2008480
Mercado-Vargas, M. J., Gómez-Lorente, D., Rabaza, O., and Alameda-Hernandez, E. (2015). Aggregated models of permanent magnet synchronous generators wind farms. Renew. Energy 83, 1287–1298. doi:10.1016/j.renene.2015.04.040
Nasiri, M., Milimonfared, J., and Fathi, S. H. (2015). A review of low-voltage ride-through enhancement methods for permanent magnet synchronous generator based wind turbines. Renew. Sustain. Energy Rev. 47, 399–415. doi:10.1016/j.rser.2015.03.079
Okedu, K. E. (2022). Improving the performance of PMSG wind turbines during grid fault considering different strategies of Fault Current limiters. Front. Energy Res. 10, 909044. doi:10.3389/fenrg.2022.909044
Othman, N. S., Rohani, M. N. K. H., Mustafa, W. A., Wooi, C. L., Rosmi, A. S., Shakur, N. F. M., et al. (2019). An overview on overvoltage phenomena in power systems. Iop Conf. Ser. Mater. Sci. Eng. 557 (1), 012013. doi:10.1088/1757-899X/557/1/012013
Ren, H., and Zhang, Y. (2021). Analysis on switching overvoltage and suppression method of cable joint in 500 kV cable line. Energy Rep. 7, 567–575. doi:10.1016/j.egyr.2021.08.004
Said, A., and Anane, Z. (2020). Corona lightning overvoltage analysis for a 500 kV hybrid line. Iet Generation, Transm. Distribution 14 (4), 532–541. doi:10.1049/iet-gtd.2019.1367
Shair, J., Xie, X., Liu, W., Li, X., and Li, H. (2021). Modeling and stability analysis methods for investigating subsynchronous control interaction in large-scale wind power systems. Renewable and Sustainable Energy Reviews 135, 110420. doi:10.1016/j.rser.2020.110420
Subedi, S., Rauniyar, M., Ishaq, S., Hansen, T. M., Tonkoski, R., Shirazi, M., et al. (2021). Review of methods to accelerate electromagnetic transient simulation of power systems. IEEE Access 9, 89714–89731. doi:10.1109/ACCESS.2021.3090320
Sun, H., Zhang, Z., Lin, W., Tang, Y., Luo, X., and Wang, A. (2012). Analysis on serious wind turbine generators tripping accident in Northwest China power grid in 2011 and its lessons. Power Syst. Technol. 36 (8), 76–80. (in Chinese). doi:10.13335/j.1000-3673.pst.2012.10.010
Tang, W. H., Gu, Y. C., Xin, Y. L., Liang, Q. H., and Qian, T. (2022). Classification for transient overvoltages in offshore wind farms based on multi-scale mathematical morphology. Int. J. Electr. Power Energy Syst. 136, 107157. doi:10.1016/j.ijepes.2021.107157
TripathiA, S. M., Tiwari, N., and Singh, D. (2015). Grid-integrated permanent magnet synchronous generator based wind energy conversion systems: a technology review. Renew. Sustain. Energy Rev. 51, 1288–1305. doi:10.1016/j.rser.2015.06.060
Xin, H., Liu, X., Zheng, D., Chen, D., Zhou, Y., and Marshall, B. (2023). Risk assessment of post-fault temporary overvoltage using generalized short-circuit ratio. IEEE Trans. Power Syst., 1–12. doi:10.1109/TPWRS.2023.3241307
Xu, J., Gao, L., and Zhang, H. (2021). Design of self-powered solid-state Fault Current limiters for VSC DC grids. Front. Energy Res. 9, 760105. doi:10.3389/fenrg.2021.760105
Yin, C., and Li, F. (2021). Analytical expression on transient overvoltage peak value of converter bus caused by DC faults. IEEE Trans. Power Syst. 36 (3), 2741–2744. doi:10.1109/TPWRS.2021.3062218
Keywords: temporary overvoltage, renewable energy, wind turbines, low voltage ride through, PMSG
Citation: Cao B, Liu H and Xie Q (2023) Analysis of the impact of transient overvoltage on grid-connected PMSG-based wind turbine systems. Front. Energy Res. 11:1299040. doi: 10.3389/fenrg.2023.1299040
Received: 22 September 2023; Accepted: 03 November 2023;
Published: 17 November 2023.
Edited by:
Ivan Pavić, University of Luxembourg, LuxembourgReviewed by:
Kenneth E. Okedu, Melbourne Institute of Technology, AustraliaCopyright © 2023 Cao, Liu and Xie. This is an open-access article distributed under the terms of the Creative Commons Attribution License (CC BY). The use, distribution or reproduction in other forums is permitted, provided the original author(s) and the copyright owner(s) are credited and that the original publication in this journal is cited, in accordance with accepted academic practice. No use, distribution or reproduction is permitted which does not comply with these terms.
*Correspondence: Bin Cao, Y2FvYmluYmRAMTYzLmNvbQ==
Disclaimer: All claims expressed in this article are solely those of the authors and do not necessarily represent those of their affiliated organizations, or those of the publisher, the editors and the reviewers. Any product that may be evaluated in this article or claim that may be made by its manufacturer is not guaranteed or endorsed by the publisher.
Research integrity at Frontiers
Learn more about the work of our research integrity team to safeguard the quality of each article we publish.