 Kristina Lebedeva
 Anatolijs Borodinecs
 Tatjana Odineca
95% of researchers rate our articles as excellent or good
Learn more about the work of our research integrity team to safeguard the quality of each article we publish.
Find out more
ORIGINAL RESEARCH article
Front. Energy Res. , 05 December 2023
Sec. Solar Energy
Volume 11 - 2023 | https://doi.org/10.3389/fenrg.2023.1297297
This article is part of the Research Topic Solar Radiation and Photovoltaic System Forecasting View all 5 articles
Electricity generation from photovoltaic (PV) in Latvia is currently below the necessary capacity required to contribute to achieving climate neutrality by 2050. However, photovoltaic offer households and companies the opportunity to align their electricity consumption with environmental goals while supporting the European Green Deal objectives. In recent years, there was a growing interest in the installation of photovoltaic microgenerators in Latvia. By June 2023, the total number of households microgenerators connected to the grid has reached 15,000, boasting a collective production capacity exceeding 120 MW. This significant increase is in stark contrast to the situation 5 years ago when Latvia had a mere 3 MW of photovoltaic capacity. Several factors contributed to this growth, including a surge in electricity prices, at times surging more than tenfold, and the implementation of renewable energy (RE) use support measures to facilitate the acquisition of RE systems. Furthermore, 2023 witnessed numerous amendments to Latvia’s energy policy documents and the introduction of the concept of citizen energy communities (CEC), indicating a growing emphasis on harnessing solar energy potential in the country. However, it remains crucial to base these endeavors on accurate, economically viable information regarding solar technologies, their costs and their anticipated long-term outcomes. This manuscript aims to provide an overview of the grid-connected potential of rooftop photovoltaic systems within a Latvian urban setting. Through extensive research, a model has been developed, employing a thoroughly tested simulation program for evaluating the generation capacity of photovoltaic systems. This model considers real electricity consumption data, the existing infrastructure and economic factors. The findings affirm the technical and economic viability of urban rooftop photovoltaic systems within the Latvian context. It has been established that the implementation of such citizen energy communities energy systems holds significant potential. These systems have the potential to be a promising solution for future electricity generation, addressing some of the demands while relieving strain on external power grids. However, the full potential can only be realized with improved infrastructure, and the system’s profitability is heavily contingent on market dynamics and political conditions. This study may also be applicable to other photovoltaic systems facing similar climate conditions.
Aligned with the prevailing discourse on global economic progress, the European Union is making significant efforts to adopt more robust measures aimed at advancing renewable energy. As the EU and the world strive to reduce carbon emissions and introduce sustainable energy systems to combat the effects of global climate change, renewable energy sources such as solar and wind will play an increasingly important role in future energy systems, benefiting from rapid cost reductions (Best and Burke, 2018; Soomar et al., 2022).
Solar photovoltaic (PV) electricity holds significant potential as a clean and cost-effective energy source. However, its contribution to overall electricity production remains limited primarily due to the initial expenses associated with installation. Over the past two decades, there has been a significant reduction in the costs associated with renewable energy technologies (Timilsina, 2021). Extensive examination of electricity pricing has revealed that solar PV systems are rapidly emerging as one of the most economically competitive options for generating electricity (Mandys et al., 2023; Keisang et al., 2021).
According to International Renewable Energy Agency (IRENA) data despite the rise in material and equipment costs, the weighted average cost of newly commissioned solar PV installations experienced a decrease in 2021. This reduction occurred due to the substantial time lag in transitioning from installed costs. Compared to the previous year, the global average levelized cost of electricity (LCOE) for newly installed utility-scale solar PV projects in 2021 experienced a 13% decrease.
Throughout the period of 2010–2021, there has been a rapid advancement in the competitiveness of renewable energy sources. Specifically, the global weighted average LCOE for newly commissioned utility-scale solar PV projects witnessed a remarkable 88% decrease between 2010 and 2021. Notably, the data indicates that the increases in material costs observed thus far have not been fully reflected in equipment prices. This suggests that the fossil fuel price crisis in 2022 will exert more significant pressure on prices compared to 2021, potentially leading to an overall increase in total installation costs across various markets (IRENA, 2022).
The REPowerEU plan (REPowerEU, 2023), an initiative by the European Union (EU) to reduce reliance on Russian fossil fuels, places significant emphasis on the rapid deployment of renewable energy and PV systems. As a result, renewable energy has become more competitive with fossil fuels in terms of electricity generation costs. When energy prices are high or fluctuating, renewable energy sources can often offer a more stable and predictable cost structure, making them an attractive option for electricity production. Fossil fuel prices can be volatile due to factors such as geopolitical tensions, supply disruptions and fluctuating demand. In contrast, renewable energy sources harness natural resources like sunlight and wind, which are essentially free and abundant. This inherent stability in the cost of renewable energy can provide long-term price predictability and protect against future price hikes in traditional energy sources.
In 2020, the capacity of solar energy production facilities in the European Union increased by 19% from 139 GW, reaching 164.9 GW. This happened despite adverse market conditions, which included insufficient supply of PV products due to continuous supply chain disruptions. Installed capacity is expected to continue to grow at double-digit levels, with solar taking up an increasing share of electricity generation across the EU. This capacity accounted for around 5% of the EU’s total electricity production (Polverini et al., 2023). The overarching goal of the REPowerEU strategy is to achieve more than 320 GW of solar PV capacity by 2025, more than doubling the amount installed in 2020, and nearly 600 GW by 2030.
PV has demonstrated ongoing evolution in its competitiveness against various other electricity sources among the available renewable energy solutions (Fazal and Rubaiee, 2023). In high-density cities, rooftop PV systems are viewed as a promising solution to address the rising energy consumption of buildings, playing a vital role in facilitating urban decarbonization efforts (Arowolo and Perez, 2023; Cuesta-Fernández et al., 2023; Ruan et al., 2023).
EU energy communities, where energy is produced and shared within a community, are a relatively new concept, though energy cooperatives have existed in many EU countries for a long time. At the moment, no one in Latvia is involved in the energy community because such possibilities were previously not legally permissible. Such an opportunity to get involved appeared only in February 2023. Energy communities are currently defined in the Energy Law and their operation is defined in the Electricity Market Law.
The purpose of this article is to provide an overview of the opportunities for Latvian multiapartment owners to participate as citizen energy communities (CEC) by grid-connected PV rooftop systems, at the same time delving into the challenges they may face. The evaluation of CEC potential, factors such as the capacity of PV systems to generate electricity, analysis of available roofs, possible grid restrictions, energy demand and economic considerations are taken into account. Considering the planning process for urban photovoltaic systems in Latvia, the purpose of this article is to provide an example using a simulation model for existing multi-apartment buildings (MAB). The analysis includes various parameters that allow a comprehensive assessment. The results of the study demonstrate the viability of introducing an urban CEC PV system in mid-latitude regions, and this approach can be replicated in other similar scenarios.
This section will provide a comprehensive overview of the procedures and methodologies employed in the study. The research commences with the collection of data pertaining to building stock, electricity consumption in buildings, the existing power grid infrastructure and rooftop PV system simulation in PolySun. The data are gathered from building residents and from relevant databases. Subsequently, the collected data are utilized to construct a building simulation model. Figure 1 shows the processes of the research methodology: the collected and calculated data are represented by rectangles without filling; models and methods - marked with grey rectangles. Details of all processes are provided in the following sections.
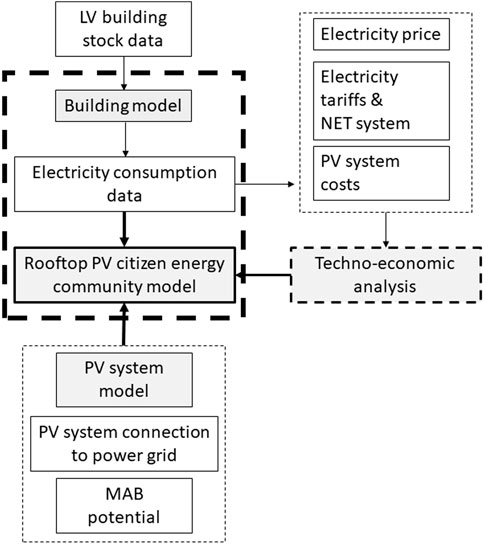
FIGURE 1. Research methodology.
At the beginning of 2021, there were 1,063,939 traditional dwellings (apartments or private houses) in Latvia. In Latvia, 70% of buildings were built between 1946 and 2000. From the end of the 1950s to the beginning of the 1990s, the construction of typical residential houses was widespread in Latvia. Alongside metropolitan microdistricts, small towns that were constructed around large factories or other important buildings (for example, Aizkraukle was built in the 1960s around Plavina HPP). The most common building series in the regions of Latvia are 103, 316 and 464 (Borodinecs et al., 2016)—the buildings have a thin rectangular shape and a limited number of floors: two, three, four or five. Building series 602, 467, and 119 were also built in big cities—the buildings have a rectangular shape, the number of floors—from five to sixteen. New series of mass-built apartment buildings were no longer created in Latvia after 1985. One of the reasons for this was the change of the state apparatus in 1991, which largely interrupted the design and construction system of existing residential areas and their apartment buildings (Garkaje and Viluma, 2016). Most of the inhabited traditional dwellings are apartments in multi-apartment buildings (73% or 592.5 thousand), while 25% or 198.5 thousand are individual houses (2021).
Multiapartment buildings (MAB) offer a promising prospect for PV systems deployment due to their large roofs and enhanced cost efficiency compared to individual homes. Nevertheless, the administrative framework of MAB necessitates economically driven choices regarding communal property. Due to the constantly evolving nature of electricity and PV markets, as well as rapidly changing policies, executive boards of MAB frequently lack the comprehensive knowledge required to make fully informed decisions.
In the previous subsection, Latvian typical building stock was analyzed. It was concluded that Latvian building stock is predominantly characterized by multiapartment buildings of up to five floors with flat or gable roofs. A five-story multiapartment building with 4 stairwells (60 apartments) and a flat roof was chosen for the study (Figure 2).
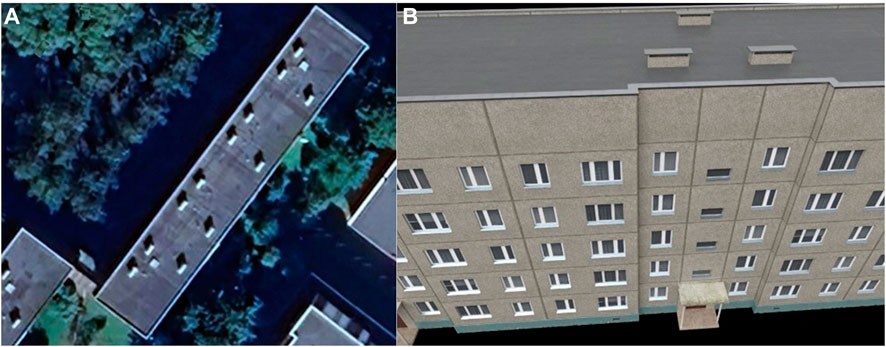
FIGURE 2. View of the selected building (A) from above; (B) from the facade.
The roof was modeled according to a real roof configuration, considering all the engineering systems that were installed on the roofs of this type of multi-apartment residential building - ventilation shaft outlets and infiltration hatches. During the dynamic simulation of the energy production of the PV system, the effect of obstacles was taken into account.
Referenced MAB has 60 apartments. Electricity consumption data for the year 2022 were collected from the real residents who have installed smart meters. Due to various factors, hourly electricity consumption data has been collected from only 31 apartments out of 60 apartments. Data were collected in Excel format. The data were completely sufficient to estimate MAB consumption. The consumption of different apartments with the same area and population was different, so the standard deviation of the load was calculated. Also, the consumption of common external electricity and common internal space lighting for the selected building was taken into account.
Calculated total electricity consumption of MAB for the year 2022 (Figure 3) was 79,664.65 kWh, common use electricity consumption was received in real terms from a common use smart meter and was about 9.8% (7,177.26 kWh) of the total electricity consumption of MAB, calculated electricity consumption of 60 apartments—72,547.39 kWh, with standard deviation from 0.27% to 6.37%. The average electricity consumption of one apartment was calculated—134 kWh. The calculation was done considering that two apartments were completely uninhabited, one was uninhabited for 5 months and the number of inhabitants decreased in three apartments at different times, which of course affected the electricity consumption.
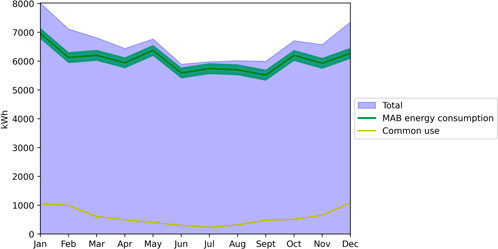
FIGURE 3. MAB electricity consumption per year.
The energy market has experienced a significant tightening as a result of the post-pandemic recovery, leading to a consistent increase in global energy prices since mid-2021 due to pent-up demand. The European energy market faced an exceptional situation when the Russian invasion of Ukraine occurred in February 2022. This event exerted unprecedented pressure on the market, causing a remarkable surge in wholesale gas and electricity prices in Europe (Ferriani and Gazzani, 2022). In the immediate aftermath of the invasion, energy prices experienced a rapid surge globally, remaining consistently elevated with a continuous 20% increase for a duration of 5 months (Yagi and Managi, 2023). The escalation in energy prices has resulted in an upsurge in household energy expenses. To investigate this impact, researchers (Guan et al., 2023)conducted a modeling study encompassing 116 countries, which accounted for 87.4% of the global population. By considering various energy price scenarios, it became evident that household energy costs could increase by 62.6%–112.9%, thereby contributing to a rise in household expenditure by 2.7%–4.8% (Guan et al., 2023).
The sluggish progress in energy transitioning to renewable energy sources (RES) and the reliance on fossil fuel imports have exacerbated the ongoing cost of living crisis. This situation has heightened the vulnerability of households to energy poverty. The Russia-Ukraine conflict has further aggravated the energy crisis, directly impacting the costs associated with heating, cooling, lighting and transportation, while indirectly raising the prices of other goods and services within global supply chains. Although all households bear the consequences, the effects differ depending on their income, spending habits, and the origin of the products they purchase. Providing targeted energy assistance can offer support to vulnerable households during this crisis. The Latvian government provided support to households for partial compensation of the expenses during the 2022/23 heating season, because it was during the heating season that the bills for utility payments were the highest due to the extreme increase in heating tariffs. By approving the amendments to the “Law on measures to reduce the extraordinary increase in energy resource prices”, the Cabinet of Ministers and the Saeima supported several support instruments for compensating the increase in energy resource prices for households.
State support helped overcome the crisis during the heating season, but only a part of households will receive support in the next heating season. The Latvian Cabinet of Ministers plans to introduce a targeted and automated state support system to reduce the impact of energy resource price increases on low-income households. In Latvia, the total charge for electricity in the bill consists of three items: charge for electricity according to the tariff of a freely chosen trader, charge for distribution and transmission service or connection provision and electricity supply service, value added tax (VAT). There are 39 active electricity dealers in Latvia and consumers can choose the most suitable offer for them. According to the current regulatory enactments, electricity can only be sold to users by registered traders who have concluded a System Use Agreement with the Distribution Network (Sadalestikls, 2023).
In this study, all multiapartment building consumers use the “Sadales tīkls” distribution system operator and various contracts with “Elektrum” electricity products and the electricity trader. From 1 July 2023, new tariffs came into force: Basic and Special—The are the same tariffs both for households and companies and there are no longer several time zones - the fee does not differ depending on the hour of the day. The basic tariff plan is suitable for regular consumption. The fixed part of this tariff, or the charge for capacity maintenance, is higher, while the variable part - the charge for electricity supply - is lower. The Special tariff, on the other hand, is suitable for small or seasonal consumption, when the connection is used irregularly or with very little electricity consumption, for example, for an apartment or summer house occupied only periodically during the winter period, companies with seasonal activity, garages, basements or similar. The variable part of this tariff is higher, but the fixed part is lower. The cost of the fixed part of the tariffs depends on the number of phases and capacity in your facility, while the variable part depends on the consumed electricity.
Table 1 summarizes data from the NordPool exchange for the last years.
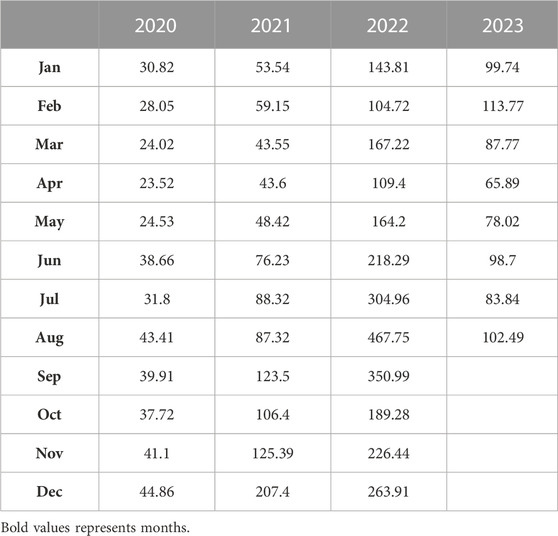
TABLE 1. The NordPool day-ahead prices, monthly (NordPool, 2023).
According to the data of the Public Services Regulatory Commission (Regulator), in the fourth quarter of 2022, the previously observed trend continued, where among households in the user segment, interest in variable (exchange) price contracts decreased, taking into account the rapid increase in the exchange price. Fixed-price contracts were chosen by 64.99% of households, and variable-price contracts by 11.96%, while interest in the universal service remained unchanged at 23.05%.
The selected tariff plan has no direct impact on the payback period of the solar panels and no special or additional tariffs, burdens or restrictions are imposed on solar panel owners. Solar panels are a valuable long-term investment, with a payback period that is particularly favorable due to increased self-consumption during sunny periods when electricity is being produced, as well as the current NETO metering system. It allows the electricity produced in the property and not immediately consumed to be stored and used within the year to cover the electricity consumption of the property during the time when the intensity of the sun is low.
Using the Basic tariff and the NETO metering system, the owners of solar panels will continue to pay only the distribution service fee for the delivery of the kilowatt-hours that are returned after being stored.
The payback of solar panel systems is mainly determined by the price of electricity, however, by producing electricity for immediate self-consumption, micro-generator owners can also significantly reduce the monthly payment for electricity supply, which is the variable part of the distribution system operator’s tariff. In addition, owners of microgenerators can use the distribution network as a “virtual battery” within the framework of the NETO metering system. They can transfer excess produced electricity to the network when it is not immediately needed for consumption, and later retrieve it back, paying only the distribution service fee for the delivery of the kilowatt-hours taken back.
Until 16.02.2023, when producing green energy with small solar panel or wind generator systems, a NETO settlement system could be used to fully capture the energy produced but not immediately consumed by households. Amendments to the Electricity Market Law expand the availability of the NET system and provide that two NETO systems (Table 2) will be available to electricity producers in Latvia in the near future:
- NETO accounting system (already existing system);
- NETO settlement system (new system).
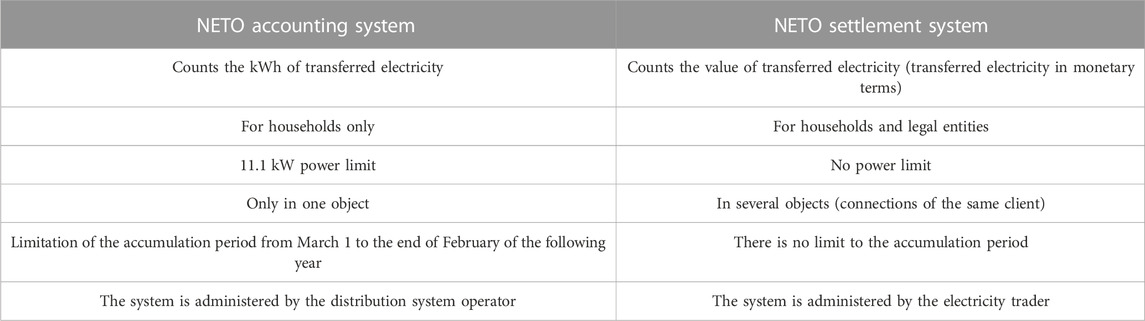
TABLE 2. NETO systems.
Amendments to the Electricity Market Law also stipulate that households can join the net metering system until 31 December 2023.
In order to determine the economic indicators of the system, information on the costs of the Latvian PV system is collected for 2020–2023 (Table 3). Data on the costs of systems already in operation (real costs of the object) were collected, as well as the received data were compared with the current offers of Latvian companies engaged in the design and installation of PV systems.

TABLE 3. PV system cost.
The price includes VAT (21%), as well as all costs related to the project, including the delivery of materials, installation of the system and preparation of documentation for commissioning. The price of the systems does not include power meters with internet connection, which will be needed for each apartment (each apartment will need 2 pieces). The approximate cost of one apartment will be 600 EUR. All calculations were made under the condition that the power generation capacity is up to 0.499 MW (i.e., a micro-generator), which does not require a permit from the Ministry of Economy. One should only contact the distribution system operator JSC “Sadales tīkls” to obtain the technical regulations for establishing an electricity connection.
In this study, the researchers applied the Polysun simulation software to assess the potential electricity generation from PV systems installed on the rooftops of the selected MAB (Figure 4). The Polysun simulation software (Vela Solaris, 2020) offers a user-friendly interface and valuable support for design, analysis and calculation of solar energy installations, consistently delivering accurate and reliable results (Abu Qadourah, 2022; Dyndał et al., 2022).
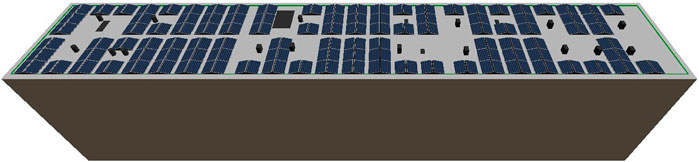
FIGURE 4. Selected BAM PV system model in Polysun.
There is one electricity transmission system operator in Latvia—JSC “Augstsprieguma tīkls” (AST, 2023) and 10 active distribution system operators (SPRK, 2023). The largest is “Sadales tīkls”, which provides electricity distribution services to more than 790,000 customers. The total length of the distribution electricity network reaches almost 93,000 km, and it covers 99% of the country’s territory. Distribution system service tariffs are approved by the Regulator (SPRK, 2023).
First of all, the consent of the MAB apartment owners must be obtained in accordance with the Apartment Property Law. The technical possibilities of MAB must be evaluated before the installation of solar panels—the safety of the building (walls, roof, etc.) must be checked, and a certified construction specialist must be consulted. It is recommended to carry out a technical survey of the building in order to find out the load-bearing capacity of the structures and to estimate how much and which equipment can be installed. The regulations of the Cabinet of Ministers 08.03.2022. No. 500 “General building regulations” have been amended to facilitate the construction process for installing solar panels. The technical parameters of the electricity connection, the condition of the building’s internal electrical networks and the possibility to safely build additional cables, if necessary, should also be evaluated. Once a suitable solar panel system has been selected and the necessary preparations for its deployment have been made, the “Distribution Network” should be contacted for permission to safely connect the solar panels for parallel work with the distribution system operator’s electrical network. The “Sadales tīkls” produces an interactive digital map (Sadales tikls, 2023), where all available networks and substation information, as well as available free power for generation can be consulted.
The building is enclosed within system boundaries, as it is the sole component subject to control by BAM citizen energy community, while the rest of the system in the possession of distribution system operator.
Within the framework of the project “Community Energy for the uptake of renewables in the electricity sector” (COME RES), an assessment was conducted to determine the solar energy potential of the roofs of Latvian energy community apartment buildings with an installed PV capacity of approximately 644 MW (COME RES, 2023). According to the distribution system operator map, the building selected for the study is located near the substation with the available free power for generation of 21.8 MW (see Figure 5; the selected building is circled in blue).
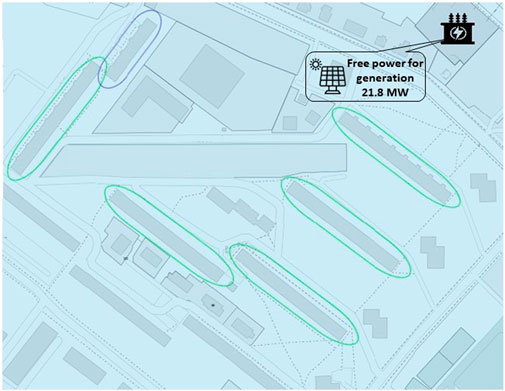
FIGURE 5. Selected building on the map.
During the survey of the district, it was found that there are 5 more buildings near the selected building (circled with a green sign in Figure 5) with the same roof structures, but with larger roof widths and as already written in 2.2.1. Subsection MABs in Latvia are very similar. The implication here is that Latvia has a significant theoretical potential for the creation of CEC. When analyzing the data of distribution system operators on power networks, there appears to be enough available power for electricity generation. Of course, this availability varies by within Latvia.
Online consultation/survey (Krug et al., 2023) among Latvian stakeholders showed that the CEC will play a very important role in the energy transition towards a low-carbon society: ensuring public acceptance of the transition to energy; providing a smart and flexible energy system; and ensuring sufficient renewable energy production. More than 90% of the respondents considered electricity generation as the most promising field of activity in the CEC, which emphasizes the importance of the legal and enabling regulation of the CEC activity in the electricity sector. The survey further highlighted the need to overcome the following hurdle for CEC:
− Lack of understanding of CEC as a concept/model;
− Lack of national/local policy attention to CECs as a concept and their potential benefits;
− Lack of networks and knowledge sharing between relevant stakeholders;
− Lack of economic incentives and financial support.
Based on the input data on the roof parameters of the selected building, a building model was created in PolySun software. Shading from objects on the roof was taken into account when choosing the location of the PV. As a result, a PV system with 208 PV modules with an installed capacity of 75.6 kWp was modeled.
The amount of electricity generated by the simulated MAB rooftop PV system is 61,393 kWh. Figure 6 shows the produced electricity of the PV system by month. In the latitudes of Latvia, the greatest amount of solar energy is from April to September (Shi et al., 2014). In order to accurately choose the necessary MAB rooftop PV system, it is necessary to analyze hourly data on energy production and energy consumption. It will be covered in the following sections of the article.
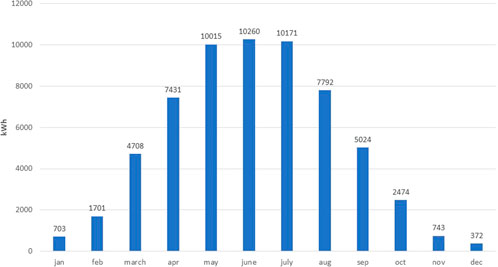
FIGURE 6. PV system production by month.
In order to evaluate the possibility of current MABs participating in the citizen energy community, both consumption and production loads are compared, along with their potential involvement in the NETO system, using it as an energy accumulator. Maximizing economic outcomes is closely tied to self-consumption, which refers to the direct use of photovoltaic (PV) generation within a building. When PV generation exceeds the immediate demand, resulting in an excess known as overproduction, this surplus is accumulated in the network, as seen in our case. The research results from Lithuania (Valančius and Mikučionienė, 2020), a neighboring country with a similar building stock and climatic conditions to Latvia, demonstrate that by utilizing the entire roof area of a five-story building for PV installation, it is possible to meet 49.8% of the building’s annual electricity demand. Similarly, using the roof of a nine-story building would cover 19% of its total electricity demand, while a sixteen-story building’s roof could cover 11% of its overall electricity needs. In our case, the average annual self-consumption rate of a five-story building stands at approximately 77%. Figure 7 illustrates a simulated MAB of PV generation alongside load consumption, with the generation shaded to highlight the distinction between self-consumption and overproduction.
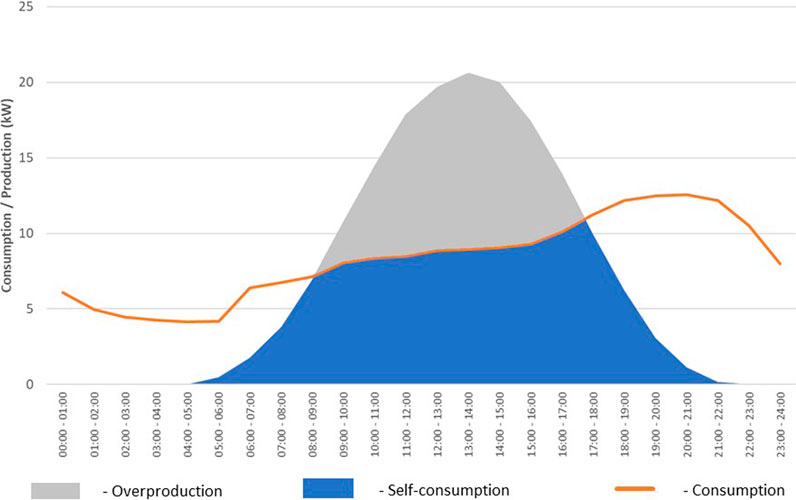
FIGURE 7. MAB PV system self-consumption and overproduction.
The sizing of a PV system is a customized procedure for each building due to the individuality of its load curve and production potential, which directly influences self-consumption. In this study, we addressed this challenge by using the PolySun software to simulate the PV system, considering the unique characteristics of the roof structure and accounting for the impact of shading. Furthermore, the real electricity consumption data of the building’s residents (as outlined in subsection 2.2.3) were utilized to ensure a realistic representation of the system’s performance.
For a more detailed definition of self-consumption and overproduction of the considered PV system, the hourly profiles of the building’s electricity consumption are analyzed and combined with the hourly simulation of the PV system. Figure 8 shows the average PV system seasonal production and the change in the MAB load profiles during the day (represents 4 seasons). Due to considerable variations between apartments, the standard deviation is calculated for both production and consumption (depicted as shading in the figures).
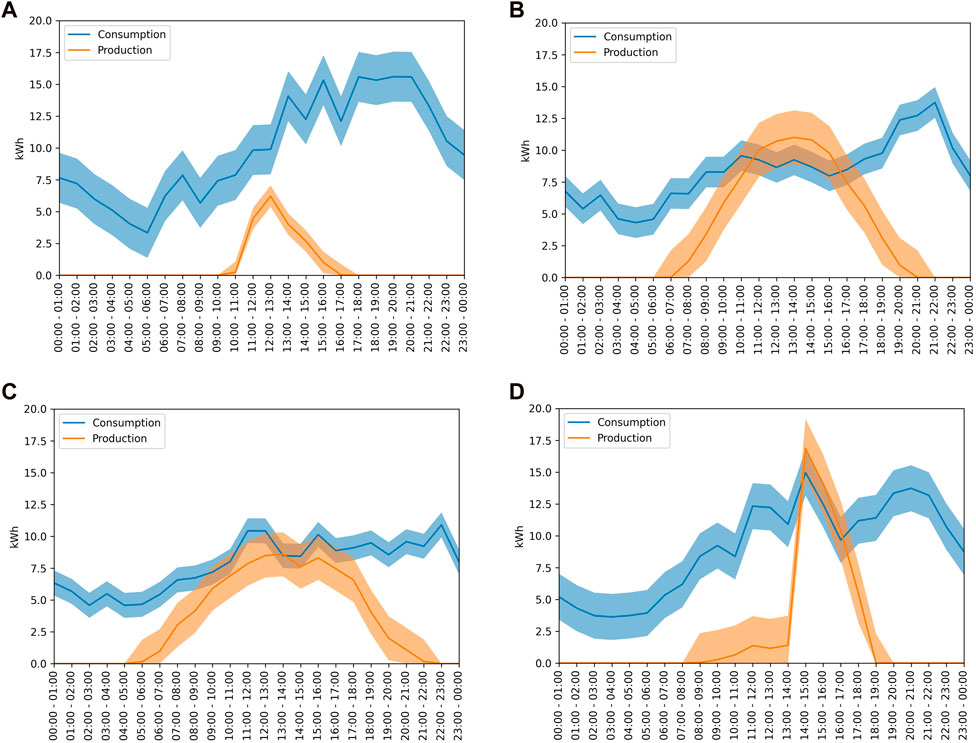
FIGURE 8. Average hourly PV production and consumption changes in different seasons.
The consumption consistently surpasses the electricity production, especially evident during winter. Conversely, in spring, summer and autumn, daylight hours showcase the production line surpassing the average load line. This means that the system generates surplus electricity for export after meeting the demand during these seasons. Comparing the different seasons, the generation and load curves exhibit similar trends within the day. However, the operating period of the PV system varies significantly. In summer, the systems can operate for more than 16 h, whereas in winter, it is less than half of that duration. In terms of values, production and loads exhibit opposing patterns. Loads are higher in winter and lower in summer, while production is higher in summer and relatively lower in winter. This overall disparity between production and loads necessitates reliance on an external network. Furthermore, it is observed that production and load curves rarely align perfectly; the load peak usually occurs later than the production peak, creating difficulties for the system to operate as intended (Figures 9, 10).
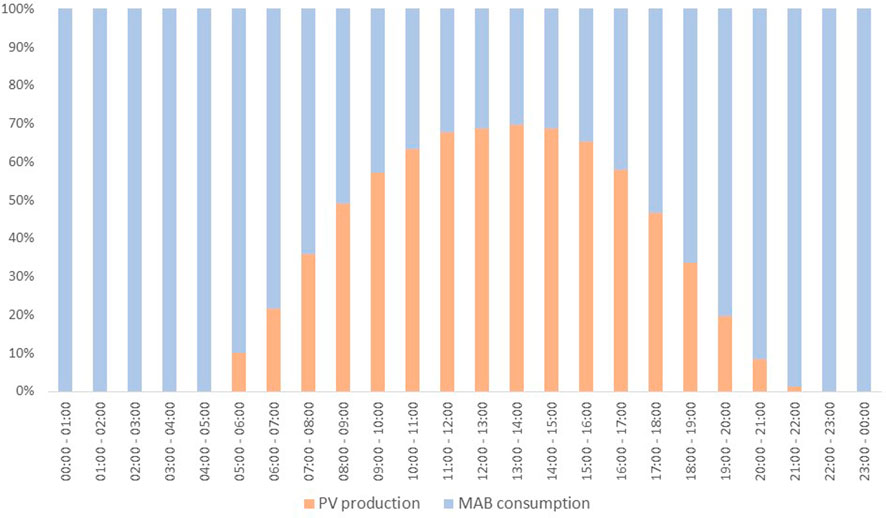
FIGURE 9. Percentage of PV system production and MAB consumption.
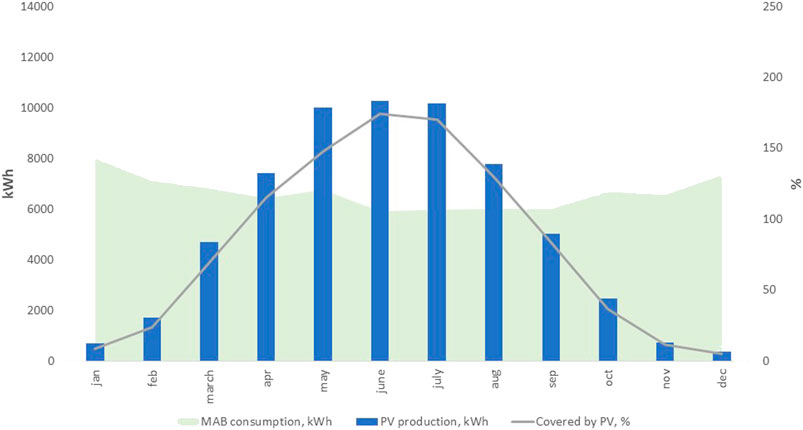
FIGURE 10. MAB rooftop PV system electricity balance.
Approximately 77% of the electricity consumed by the MAB can be covered by the PV system’s production. From April to August, there is a surplus of around 15,000 kWh of electricity, which can be accumulated in the network and used in accordance with the rules of the NETO system. Surplus electricity transfer potential to the grid in Latvia strongly depends on technical conditions of grid in specific region. The latest amendments in Latvia regulation set the 20% limits of on-site produced electricity which can be sold through the grid.
The primary goal of this model (Figure 11) is not to forecast citizen energy community (CEC) members behavior, as that falls within the realm of technology diffusion analysis. Instead, its purpose is to effectively communicate a pertinent and practical analysis to energy communities, aiding them in their decision-making process.
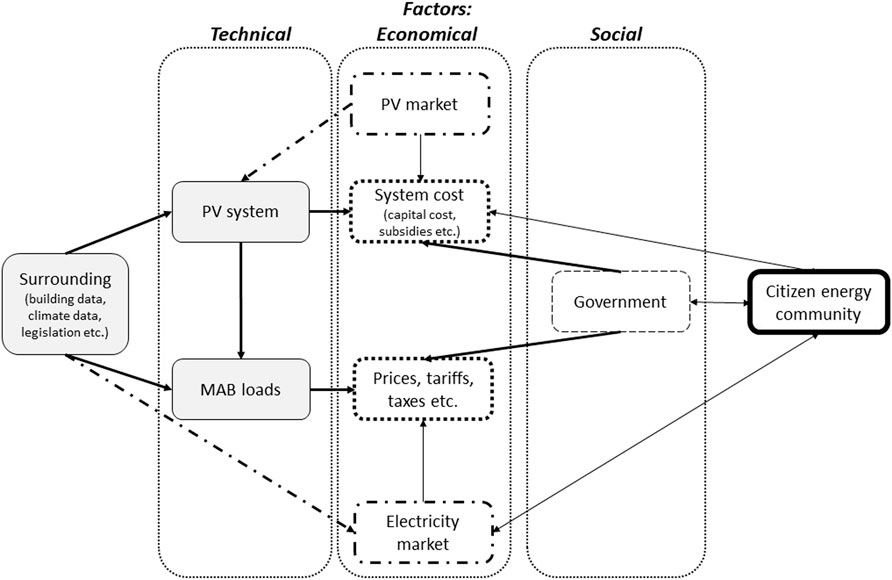
FIGURE 11. PV citizen energy community model.
One key aspect of this model involves taking a comprehensive approach that encompasses technical, economic and social factors relevant to the adoption of PV systems by consumers. In order to assess the worth of a PV system, it is essential to grasp what potential CEC members find valuable and to comprehend the technical, economic, and social factors that shape their decision-making process. The model demonstrates that CECs, acting as end-users, are integrated into the upper part of the model with feedback loops. This setup accommodates the constantly evolving PV market, leading to potential reductions in PV system costs, advancements in technology and improvements in financing conditions. Meanwhile, in the lower part of the model, a substantial increase in PV integration within the electricity market could potentially result in decreased electricity prices during PV production hours (Oprea and Bâra, 2023; Meriläinen et al., 2023). The government component is distinctly identified as a social factor and is interconnected with all sectors, highlighting the pervasive influence of policies (Arnold et al., 2022).
Techno-economic analysis typically aims to maximize the value derived from a particular investment opportunity. Within the context of a specific rooftop, the outcome is determined by three primary factors:
− The technical optimization criteria,
− The precise system cost (as discussed in section 2.2.6), and
− The degree of self-consumption (considering that excess energy generation receives reduced compensation).
In this study, various criteria were selected for analysis, including the solar energy production, self-consumption, self-sufficiency and potential of surpluses transfer to the network. Total PV production is compared to the overall energy demand. Self-consumption represents the PV-generated energy that is used internally. Self-sufficiency measures the percentage of energy demand met by PV generation. In situations where, solar energy production exceeds the energy demand, the surplus electricity can be supplied to the grid.
After the simulation and technical optimization of the PV system, an economic study was conducted to calculate the economic profitability and amortization time of the MAB rooftop PV system. The development and construction costs of proposed MAB are approximately 104,000 EUR, and the maintenance costs are approximately 1% of the original cost (van Sark et al., 2014).
To calculate production benefits, economic profitability was calculated using the following Eq. 1 calculating both the economic profitability of the PV system and the amortization period (Pérez and Alonso-Montesinos, 2023).
where n - is the useful life of the PV system, years; B- economic benefits of the photovoltaic plant, EUR; CAPEX - capital expenditure, EUR; OPEX - operational expenditure, EUR.
When calculating the economic profitability, the payback time can be calculated according to Eq. 2 to determine when the PV system will start to bring profit and whether the project will be economically profitable.
where A- is the PV system amortization time, years.
In our study, we choose CAPEX/OPEX factors as the main economic research factors, as they track expenditure throughout implementation and streamline the decision-making process for selecting which technologies to invest in and the optimal investment locations. In our calculations, we use the optimistic scenario that the amortization time of the PV system is 30 years. Commercial brochures of PV manufacturers declare that the lifetime of PV panels is between 20 and 30 years, scientists in the study (Libra et al., 2023) have calculated that the real lifetime of PV power plants is about 10–12 years. This can significantly reduce the profit of the PV power plant, but the investment is still worth it. In our case, the CAPEX ratio is 104.0KEUR the OPEX ratio is 1.04 KEUR and the estimated useful life is 25 years. The average selling price of electricity in Latvia was 225.91 EUR/MWh in 2022. In addition, thanks to the calculated percentages reflected in the study, the economic losses associated with dust deposition are considered (Zhao et al., 2021). After the study, it was determined that the MAB PV system with self-consumption rates ranging from 60% to 80%, provides the maximum economic benefit within 5% of the total cost of the system.
From an economic perspective, the CAPEX associated with PV systems is a crucial factor that influences the overall cost. In our specific scenario, the economic advantages of the MAB PV system spanned from 0 to 61.6 EUR per installed kW. Typically, systems with the maximum PV installation capacity tend to exhibit superior economic performance. The feasibility of the system’s economic viability is heavily contingent on several factors, including electricity prices, operational feasibility, PV system size and government financial incentives. In particular, the cost of electricity, as well as, in the case of Latvia, the distribution operator’s tariffs, which are factored into the overall price, exert the most significant influence on the system’s economic feasibility.
The main goal of this study is to identify and describe the value proposition of PV systems in Latvian MABs, thereby aiding the CEC organization in achieving the energy, economic and environmental goals of both building owners and society at large.
The article assesses the potential of a CEC centered around a rooftop PV system, while considering the constraints posed by roofing limitations, the state of infrastructure and economic factors within the Latvian context.
A test case was developed and simulated, based on a real MAB district in Riga, consisting of a single 5-story building with 60 apartments. Technical and economic factors were considered to provide a comprehensive potential of CEC (PV based) organization in the urban area.
According to the results of the scientists’ study (COME RES, 2023), the organization of CEC with rooftop PV systems has a significant power potential of 644 MW. Based on the calculations made, involving only 5-story MAB in Latvia, it is estimated that approximately 5000 CECs can be organized. Such systems will promote the transition to renewable energy resources and reduce the use of fossil fuels for electricity production. Such a system also has disadvantages, notably a significant gap between production and consumption. Consequently, PV systems alone may not fully meet the energy needs of MABs. This is due to the penetration of the PV system, which is dependent on the weather, and the instability of the generated power during the day and night and in different seasons. Therefore, the potential use of the NETO system available in Latvia as a surplus electricity accumulator was considered.
In terms of economic considerations, the initial capital expenditure significantly influences the overall costs of the systems. The financial viability of the system is notably reliant on factors such as electricity prices, system size specifications and government financial incentives. Among these factors, electricity prices exert the most significant influence on the economic feasibility.
This study confirms the viability of implementing such a system in mid-latitude regions and can serve as a valuable reference for expanding its application to other areas with comparable conditions.
Publicly available datasets were analyzed in this study. This data can be found here: https://www.nordpoolgroup.com/en/Market-data1/Dayahead/Area-Prices/LV/Monthly/?view=table (Automatic extraction of data from this website and/or use for commercial purposes is strictly prohibited under Nord Pool’s terms & conditions. For more information regarding data usage, contact cGRzQG5vcmRwb29sZ3JvdXAuY29t).
KL: Conceptualization, Data curation, Formal Analysis, Investigation, Methodology, Supervision, Validation, Writing–original draft, Writing–review and editing. AB: Conceptualization, Data curation, Formal Analysis, Funding acquisition, Investigation, Methodology, Project administration, Resources, Validation, Writing–original draft, Writing–review and editing. TO: Data curation, Software, Validation, Visualization, Writing–original draft.
The author(s) declare financial support was received for the research, authorship, and/or publication of this article. This work has been supported by ERA-NET-SES “Deployment of Smart Renewable Energy Communities” (DoRES).
The authors declare that the research was conducted in the absence of any commercial or financial relationships that could be construed as a potential conflict of interest.
All claims expressed in this article are solely those of the authors and do not necessarily represent those of their affiliated organizations, or those of the publisher, the editors and the reviewers. Any product that may be evaluated in this article, or claim that may be made by its manufacturer, is not guaranteed or endorsed by the publisher.
Abu Qadourah, J. (2022). Energy and economic potential for photovoltaic systems installed on the rooftop of apartment buildings in Jordan. Results Eng. 16, 100642. doi:10.1016/j.rineng.2022.100642
Arnold, F., Jeddi, S., and Sitzmann, A. (2022). How prices guide investment decisions under net purchasing — an empirical analysis on the impact of network tariffs on residential PV. Energy Econ. 112, 106177. doi:10.1016/j.eneco.2022.106177
Arowolo, W., and Perez, Y. (2023). Rapid decarbonisation of Paris, Lyon and Marseille’s power, transport and building sectors by coupling rooftop solar PV and electric vehicles. Energy Sustain. Dev. 74, 196–214. doi:10.1016/J.ESD.2023.04.002
AST (2023). Moving energy. Available at: https://ast.lv/en (Accessed July 06, 2023).
Best, R., and Burke, P. J. (2018). Adoption of solar and wind energy: the roles of carbon pricing and aggregate policy support. Energy Policy 118, 404–417. doi:10.1016/J.ENPOL.2018.03.050
Borodinecs, A., Zemitis, J., Sorokins, J., Baranova, D. v., and Sovetnikov, D. O. (2016). Renovation need for apartment buildings in Latvia. Mag. Civ. Eng. 68, 58–64. doi:10.5862/MCE.68.6
COME RES (2023). COME RES Horizon2020 project. Available at: https://come-res.eu/ (Accessed July 14, 2023).
Cuesta-Fernández, I., Vargas-Salgado, C., Alfonso-Solar, D., and Gómez-Navarro, T. (2023). The contribution of metropolitan areas to decarbonize the residential stock in Mediterranean cities: a GIS-based assessment of rooftop PV potential in Valencia, Spain. Sustain Cities Soc. 97, 104727. doi:10.1016/J.SCS.2023.104727
Dyndał, K., Marszalek, K. W., and Kąkol, Z. (2022). Design of complex energy systems (thin film photovoltaics, collectors, heat pumps and energy storage). Przeglad Elektrotechniczny 98 (9). doi:10.15199/48.2022.09.57
Fazal, M. A., and Rubaiee, S. (2023). Progress of PV cell technology: feasibility of building materials, cost, performance, and stability. Sol. Energy 258, 203–219. doi:10.1016/J.SOLENER.2023.04.066
Ferriani, F., and Gazzani, A. G. (2022). The impact of the war in Ukraine on energy prices: consequences for firms’ financial performance. SSRN Electron. J. 2022, 4216406. doi:10.2139/ssrn.4216406
Garkaje, L., and Viluma, A. (2016). Energy-efficient housing and micro-district architecture (in Latvian). Riga: REA Vēstnesis.
Guan, Y., Yan, J., Shan, Y., Zhou, Y., Hang, Y., Li, R., et al. (2023). Burden of the global energy price crisis on households. Nat. Energy 8, 304–316. doi:10.1038/s41560-023-01209-8
Keisang, K., Bader, T., and Samikannu, R. (2021). Review of operation and maintenance methodologies for solar photovoltaic microgrids. Front. Energy Res. 9. doi:10.3389/fenrg.2021.730230
Libra, M., Mrázek, D., Tyukhov, I., Severová, L., Poulek, V., Mach, J., et al. (2023). Reduced real lifetime of PV panels – economic consequences. Sol. Energy 259, 229–234. doi:10.1016/j.solener.2023.04.063
Mandys, F., Chitnis, M., and Silva, S. R. P. (2023). Levelized cost estimates of solar photovoltaic electricity in the United Kingdom until 2035. Patterns 4 (5), 100735. doi:10.1016/J.PATTER.2023.100735
Meriläinen, A., Montonen, J.-H., Kosonen, A., Lindh, T., and Ahola, J. (2023). Cost-optimal dimensioning and operation of a solar PV–BESS–heat pump-based on-grid energy system for a Nordic climate townhouse. Energy Build. 295, 113328. doi:10.1016/j.enbuild.2023.113328
NordPool (2023). Nord pool day-ahead prices. Available at: https://www.nordpoolgroup.com/en/Market-data1/Dayahead/Area-Prices/LV/Monthly/?view=table (Accessed July 07, 2023).
Oprea, S. V., and Bâra, A. (2023). Mind the gap between PV generation and residential load curves: maximizing the roof-top PV usage for prosumers with an IoT-based adaptive optimization and control module. Expert Syst. Appl. 212, 118828. doi:10.1016/j.eswa.2022.118828
Pérez, N. S., and Alonso-Montesinos, J. (2023). Economic and environmental solutions for the PV solar energy potential in Spain. J. Clean. Prod. 413, 137489. doi:10.1016/j.jclepro.2023.137489
Polverini, D., Espinosa, N., Eynard, U., Leccisi, E., Ardente, F., and Mathieux, F. (2023). Assessing the carbon footprint of photovoltaic modules through the EU Ecodesign Directive. Sol. Energy 257, 1–9. doi:10.1016/J.SOLENER.2023.04.001
REPowerEU (2023). REPowerEU. Available at: https://ec.europa.eu/commission/presscorner/detail/en/IP_22_3131 (Accessed July 03, 2023).
Ruan, T., Topel, M., Wang, W., and Laumert, B. (2023). Potential of grid-connected decentralized rooftop PV systems in Sweden. Heliyon 9 (6), e16871. doi:10.1016/J.HELIYON.2023.E16871
Sadalestikls (2023). AS Sadales tīkls - kvalitatīva un droša elektroenerģijas piegāde. Available at: https://sadalestikls.lv/en (Accessed July 06, 2023).
Sadales tikls (2023). ST digital map. Available at: https://karte.sadalestikls.lv/lv/briva-jauda (Accessed July 07, 2023).
Shipkovs, P., Kashkarova, G., Lebedeva, K., Migla, L., and Snegirjovs, A. (2014). Solar panels produced electricity impact on electricity network. Renew. Energy Power Qual. J. 1, 376–380. doi:10.24084/repqj12.344
Soomar, A. M., Hakeem, A., Messaoudi, M., Musznicki, P., Iqbal, A., and Czapp, S. (2022). Solar photovoltaic energy optimization and challenges. Front. Energy Res. 10. doi:10.3389/fenrg.2022.879985
SPRK (2023). The public utilities commission (PUC) or the regulator. Available at: https://www.sprk.gov.lv/en (Accessed July 06, 2023).
Timilsina, G. R. (2021). Are renewable energy technologies cost competitive for electricity generation? Renew. Energy 180, 658–672. doi:10.1016/J.RENENE.2021.08.088
Valančius, K., and Mikučionienė, R. (2020). Solar energy as a tool of renovating soviet-type multi apartment buildings. Sol. Energy 198, 93–100. doi:10.1016/j.solener.2020.01.046
van Sark, W., Rutten, G., and Cace, J. (2014). Inventory of the PV market in The Netherlands, utrecht. Available: http://www.zonnestroomnl.nl/wp-content/uploads/2014/08/markt-apr2014def.pdf (Accessed September 06, 2023).
Vela Solaris (2020). Polysun user manual. Winterthur: Vela Solaris. Available at: https://www.velasolaris.com/wp-content/uploads/2022/01/Tutorial_EN.pdf (Accessed July 13, 2023).
Yagi, M., and Managi, S. (2023). The spillover effects of rising energy prices following 2022 Russian invasion of Ukraine. Econ. Anal. Policy 77, 680–695. doi:10.1016/J.EAP.2022.12.025
Keywords: rooftop PV system, urban area, grid connected PV system, citizen energy community, techno-economic analysis
Citation: Lebedeva K, Borodinecs A and Odineca T (2023) The potential of multiapartment rooftop PV systems as citizen’ energy communities in Latvia. Front. Energy Res. 11:1297297. doi: 10.3389/fenrg.2023.1297297
Received: 19 September 2023; Accepted: 22 November 2023;
Published: 05 December 2023.
Edited by:
Mawloud Guermoui, Applied Research Unit for Renewable Energies, AlgeriaReviewed by:
Valerii Deshko, Kyiv Polytechnic Institute, UkraineCopyright © 2023 Lebedeva, Borodinecs and Odineca. This is an open-access article distributed under the terms of the Creative Commons Attribution License (CC BY). The use, distribution or reproduction in other forums is permitted, provided the original author(s) and the copyright owner(s) are credited and that the original publication in this journal is cited, in accordance with accepted academic practice. No use, distribution or reproduction is permitted which does not comply with these terms.
*Correspondence: Kristina Lebedeva, a3Jpc3RpbmEubGViZWRldmFAcnR1Lmx2
Disclaimer: All claims expressed in this article are solely those of the authors and do not necessarily represent those of their affiliated organizations, or those of the publisher, the editors and the reviewers. Any product that may be evaluated in this article or claim that may be made by its manufacturer is not guaranteed or endorsed by the publisher.
Research integrity at Frontiers
Learn more about the work of our research integrity team to safeguard the quality of each article we publish.