 Xinyue Kong*
 Tao Xu
- State Grid Jiangsu Electric Power Co., Ltd., Economic Research Institute, Nanjing, Jiangsu, China
The advancement of Financial Technology (FinTech) is crucial for government entities, the National Grid, and various energy corporations to facilitate the transition towards sustainable and green production methods. This study investigates the relationship between FinTech and Total Factor Energy Efficiency (TFEE) using data from a selected sample of 254 city groups in China. We examine how the development of FinTech impacts TFEE from both non-spatial and spatial perspectives. The results from the non-spatial panel model indicate that FinTech development has a significant positive impact on TFEE. Comparative studies were conducted using fixed effects (FE), feasible generalized least squares (FGLS) models, and system generalized method of moments (GMM) models, and the main findings remained consistent, confirming the robustness of our conclusions. Spatial autocorrelation results reveal a significant positive spatial spillover effect on TFEE. Both the spatial Durbin model and the dynamic spatial Durbin model demonstrate that FinTech also has a significant positive impact on TFEE, and this effect increases over time. These conclusions remain robust even after considering various spatial weight matrices and alternative methods for calculating TFEE. Additionally, we discovered that the digital economy plays a vital role in strengthening the relationship between FinTech and TFEE. Heterogeneity analysis indicates that, compared to cities without resource-based economies, FinTech development in growing resource-based cities has a more substantial impact on TFEE.
1 Introduction
Climate change stands as one of the most pressing challenges confronting the world today, with far-reaching impacts spanning macroeconomics, microenterprises, and financial markets. In its pursuit of rapid urbanization and industrialization, China has historically relied on large-scale investments (Kuang et al., 2016). However, conventional and radical development approaches have exacted a heavy toll on energy resources, resulting in issues such as resource depletion and climate change (Song et al., 2014). China’s unprecedented economic growth over the past few decades has led to a significant increase in energy consumption, primarily driven by the industrial and manufacturing sectors. The energy sector has played a central role in this growth, with coal being a dominant energy source for decades. This heavy reliance on coal has not only strained domestic energy resources but has also contributed substantially to greenhouse gas emissions, making China one of the world’s largest emitters of carbon dioxide. To address these pressing climate and environmental concerns, the Chinese government introduced the “dual carbon target” in 2020, pledging its commitment to fostering high-quality green economic development (Fang et al., 2023). Notably, enhancing energy efficiency emerges as a pivotal strategy in mitigating current climate and environmental challenges (Aldieri et al., 2022; Fang et al., 2022). The electricity sector, as a critical component of China’s energy landscape, plays a significant role in achieving these energy efficiency goals. China’s rapidly growing urban areas and industries heavily depend on electricity for their operations. As such, improving the energy efficiency of electricity generation, transmission, and consumption becomes essential in the context of both environmental sustainability and economic growth. China has implemented a series of policies that offer actionable guidelines for advancing high-quality development in the electricity sector. The government has also integrated resource consumption and environmental pollution into its socioeconomic development evaluation framework, with many scholars utilizing Total Factor Energy Efficiency (TFEE) as a key metric for gauging economic transformation (Hu and Wang, 2006). Among the methods employed to measure TFEE, Data Envelopment Analysis (DEA) and Stochastic Frontier Analysis (SFA) have gained widespread acceptance. Moreover, scholars have made significant enhancements to the relaxed SBM model. The super-efficient SBM model, which accounts for unexpected outputs, has found extensive application within academic circles for assessing total factor energy efficiency (Ren et al., 2022).
In the context of China’s “dual carbon” goals, the financial sector is emerging as a critical enabler and effective regulatory tool for achieving high-quality economic development. With the advent of the new wave of the “digital revolution,” the convergence of information technologies such as artificial intelligence, big data, cloud computing, blockchain, and the Internet of Things with financial services is ongoing, making financial technology (FinTech) an integral component of the modern financial system (Cheng and Qu, 2020). It is worth noting that FinTech enhances the capacity of green finance and contributes to the path of carbon reduction. It represents a form of financial innovation that harmonizes traditional financial elements with extensive data and other technologies, possessing attributes of empowerment and environmental sustainability. This positions it as a driver of progress for Total Factor Energy Efficiency (TFEE) (Razzaq and Yang, 2023). In the digital economy realm, FinTech propels innovation in financial formats and business models. This innovation fosters the accumulation of data elements, stimulates structural transformations in TFEE, and guides it toward digital transformation. Consequently, under the conditions of the digital economy, FinTech demonstrates a greater capability to enhance energy efficiency compared to traditional economic conditions (Liu et al., 2023). In order to inject fresh vitality into the digital transformation of the financial sector, the People’s Bank of China issued the “Development Plan for Financial Technology (FinTech) (2022–2025)” in January 2022. This plan sets forth new developmental goals, including “aiming for carbon peak and carbon neutrality,” “creating a digital green service system,” and “supporting the green transformation and low-carbon sustainable development of the real economy.” Within this context, an examination of the emission reduction and efficiency improvement effects of FinTech development is of paramount theoretical and practical significance for deepening reforms and constructing China’s pollution control and governance system.
When reviewing existing research, it becomes evident that numerous articles have concentrated on the interplay between FinTech and corporate sustainable development, as well as the distinctive features characterizing FinTech’s evolution (Lin et al., 2022). While some scholars have commenced employing search engine indices to gauge regional levels of FinTech, these studies are predominantly oriented toward exploring the ramifications on corporate innovation and the sustainability of businesses (Wang et al., 2023). Furthermore, extant research suggests that FinTech development generates “spillover effects” and “siphon effects” (Hall, 2002; Tang et al., 2019). On the one hand, financial technology leverages the rapid dissemination and application of information technology to reduce geographical barriers, mitigate “information asymmetry,” alleviate conflicts in supply and demand between banks and enterprises, diminish financing constraints and transaction costs, and catalyze innovation and entrepreneurship (Xie et al., 2018). On the other hand, the application of artificial intelligence and other technological means for cost reduction and risk management has bolstered the accessibility of financial services across urban areas. This, in turn, aids in dismantling barriers to green development resulting from geographical disparities. Additionally, FinTech companies often cluster together, forming FinTech hubs. This prompts questions concerning the impact of FinTech hub development on Total Factor Energy Efficiency (TFEE). Does FinTech synergize with the growth of the digital economy and contribute to augmenting Total Factor Energy Efficiency (TFEE)? Are there regional variations in the influence of FinTech development on TFEE?
Based on the issues mentioned above, we utilize panel data derived from 254 cities in China to explore the spatial evolution patterns and the ramifications of FinTech and TFEE. This study makes several noteworthy contributions. Firstly, it explores the influence of financial technology on TFEE from a macro perspective within cities. We delve into the spatial evolution patterns of these two variables and scrutinize the spatial effects of financial technology on TFEE through spatial and dynamic spatial Durbin models. Additionally, we investigate the short-term and long-term effects of financial technology development on TFEE using the dynamic spatial Durbin model. Secondly, in contrast to many previous studies that focused primarily on the company level, this article adopts the super-efficiency SBM model and SBM-DDF model to compute TFEE for prefecture-level cities in China and examines its spatial dependence. Third, we explore the drivers behind the impact of FinTech development on TFEE. We further investigate the synergistic relationship between the level of the digital economy and fintech development. Finally, we assess whether resource endowments and urban differences affect the impact of fintech on TFEE. Few studies have addressed the drivers and regional heterogeneity between fintech and TFEE.
2 Literature review and hypothesis development
The research framework of this paper is illustrated in Figure 1. Firstly, the TFEE was calculated using the highly efficient SBM model and SBM-DDF model, and a FinTech index was constructed based on text analysis techniques. Secondly, a non-spatial panel model was employed to examine the relationship between TFEE and the FinTech index, thereby validating Hypothesis 1 proposed in this study. Furthermore, we investigated the impact of spatial effects. The applicability of spatial econometric models was confirmed through spatial correlation tests, and a series of tests were conducted to identify the appropriate spatial econometric model. We explored spatial effects, heterogeneity, and moderating effects between the two, thereby validating Hypotheses 2, 3. Finally, robustness tests were conducted to ensure the reliability of the experimental results.
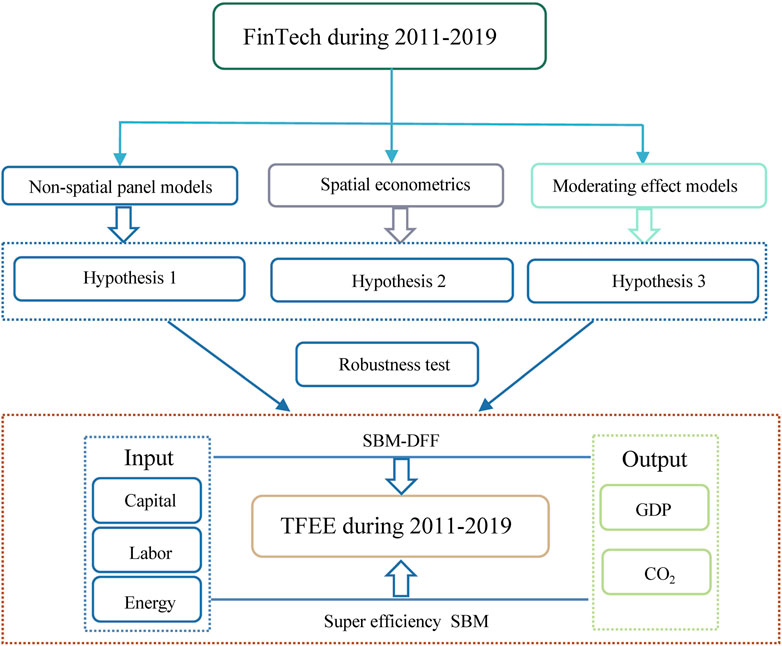
FIGURE 1. Research framework.
Energy is the foundation of human production, innovation, and development. However, the large-scale consumption of energy has raised concerns about climate and environmental issues, making energy efficiency a crucial topic for sustainable development. Scholars have focused on energy efficiency, which aims to achieve a balance between more economic value and less energy consumption, and it can be explained from both technological and economic perspectives. At the current research stage, there are two primary measures of energy efficiency: single-factor energy efficiency and total-factor energy efficiency. Single-factor energy efficiency quantitatively examines the relationship between energy consumption and economic output but has limitations as it neglects the influence of other factors. Consequently, total-factor energy efficiency has become the predominant measurement method. Data Envelopment Analysis (DEA) and Stochastic Frontier Analysis (SFA) are widely adopted measurement methods (Chen et al., 2021). They employ different models, with DEA primarily including radial, SBM, and EBM models. Scholars continuously enhance these methods. Substantial improvements have been made in SBM models based on the slack-based approach. For instance, the super-efficiency SBM model, which includes unexpected outputs, has been widely applied in the academic community for energy efficiency research (Ren et al., 2021; Ren, 2022). Factors affecting total-factor energy efficiency encompass technological aspects, resource endowment, policy, and economic factors. Technological factors can enhance energy efficiency, such as the integration of information technology and manufacturing (Dong et al., 2021). Regarding resource endowment, human capital and resource endowment significantly impact total-factor energy efficiency (Hui et al., 2021). Environmental regulatory policies can strengthen total-factor energy efficiency, exhibiting a “U”-shaped relationship with it (Wu et al., 2020a; Galeotti et al., 2020). Furthermore, economic development and technological advancements can also improve energy efficiency (Tang and He, 2021).
Financial technology, or fintech, represents the integration of financial services with information technology. Its scope continues to expand with advancements in digital technology and its entry into new sectors, making it a focal point for governments, academia, and the financial industry (Gomber et al., 2017). Researchers have been actively studying the intersection of technology and finance, with a primary focus on defining and measuring fintech and assessing its impact on economic development and environmental protection. The term “fintech” is a portmanteau of “financial” and “technology” and has gained extensive attention from scholars, driving rapid growth in fintech-related industries. According to the Financial Stability Board’s report on the “Impact of Financial Technology on Financial Stability,” fintech is defined as technology-driven financial innovations that have the potential to fundamentally change the financial services sector and even the entire economy. It involves innovative technologies driven by technological advancements, promoting the maturation of areas such as banking technology, insurance technology, and securities technology. Currently, there are primarily two broad methods for constructing fintech indices. The first method involves using stock price indices, while the second method employs “text data mining” based on text data from internet platforms to synthesize fintech indices. Regarding research on the economic impact of fintech, scholars have found that fintech can enhance productivity (Hu and Li, 2023), facilitate industrial structural transformation (Ge et al., 2022), and promote the digital transformation of the financial industry (Suryono et al., 2020), thereby contributing to economic transformation and development. Several scholars have also investigated the effects of fintech on environmental protection and green sustainable development. They have found that fintech development alleviates financing constraints, which can boost regional green innovation and reduce regional carbon emissions. Wang and Ma (2018) found that fintech can optimize industrial structures, reduce unexpected corporate outputs, and consequently lower carbon emissions. Liu et al. (2019) argue that fintech can promote the development of green finance, leading to environmental benefits.
As previously discussed, prior research has extensively explored the link between fintech and its impact on economic development and the environment. Furthermore, scholars have extensively examined the measurement methods of fintech and Total Factor Energy Efficiency (TFEE), as well as the influence of environmental policies, digital economy, and technological advancements on TFEE. However, there is relatively limited research on the relationship between fintech and TFEE. Fintech is the product of deep integration between finance and artificial intelligence technology. It can effectively mitigate information asymmetry, enhance resource allocation efficiency, and improve technological innovation capabilities, thereby providing an endogenous driving force for enhancing TFEE (Jiang et al., 2021). The collaborative development of fintech and traditional financial institutions can significantly improve market transparency, which is beneficial for alleviating financing constraints faced by energy enterprises and enhancing corporate energy efficiency (Heiskanen, 2017). Therefore, this paper proposes the following hypothesis:
Hypothesis 1: The development of fintech contributes to the enhancement of TFEE.
The improvement of Total Factor Energy Efficiency (TFEE) requires a deeper consideration, especially when it comes to spatial effects. The key to the positive impact of fintech on TFEE is how to control potential spatial spillover effects. Researchers have already started exploring how to use fintech to optimize resource allocation and the flow of production factors, promoting a more balanced TFEE. This includes managing resources through smart contracts, blockchain technology, and big data analytics to reduce resource wastage and enhance TFEE. Fintech combines technology spillover effects with inclusive effects, with fintech companies often clustering together to form fintech hubs, creating a “siphon effect” (Ma et al., 2022). However, further research is needed to address challenges related to spatial spillover effects to fully realize the potential of fintech.
The development of the digital economy, including the application of technologies such as big data, artificial intelligence, and cloud computing, has had far-reaching impacts in various sectors (Bui and Nguyen, 2023). In the energy sector, digital economic technologies can provide more comprehensive energy data analysis and monitoring, helping businesses better understand their energy usage. This data-driven approach assists businesses in managing and planning their energy consumption more effectively, thus improving energy efficiency (Wang et al., 2022). As part of the digital transformation, fintech provides businesses with more financial tools and services to support their energy efficiency efforts. Digital financial tools can help companies manage energy costs, cash flow, as well as investment and financing activities (Chen et al., 2023). The convergence of fintech and the digital economy has fostered innovative energy solutions. For example, fintech tools like digital payments and blockchain technology offer new ways for energy trading and distribution, promoting the development of distributed energy (Ahl et al., 2019). In summary, the synergistic benefits of the digital economy and fintech have the potential to significantly enhance Total Factor Energy Efficiency. Therefore, this paper proposes:
Hypothesis 2: After controlling for spatial spillover effects, the development of fintech can significantly enhance TFEE.
Hypothesis 3: The development of fintech and the digital economy generates synergistic benefits that contribute to improving TFEE.
3 Variables and data
3.1 Measurement of financial technology
The core explanatory variable in this study is financial technology. Following the methodology outlined by Li et al. (2020), we have selected 48 keywords related to financial technology. Utilizing web crawler technology, we systematically counted the number of news pages containing these keywords in Baidu News Advanced Search for cities and regions at or above the municipal level. Subsequently, we aggregated the total search results for the 48 keywords for each city and year. Given the right-skewed distribution of this indicator, we applied a logarithmic transformation to obtain the final FinTech index. Detailed descriptions of the variables are provided in Table 2.
3.2 Measurement of TFEE
In this study, Total Factor Energy Efficiency (TFEE) is the most important research object. Under the traditional efficiency evaluation index, there is a large difference with the actual situation. TFEE integrates the relationship between energy and capital and labor, etc., to become the mainstream research direction of the current energy efficiency evaluation. At present, there are very many measurement methods of TFEE improved based on the DEA model proposed by Farrell (1957). In this paper, an evaluation model for measuring TFEE is developed based on the super-efficient SBM model containing non-expected outputs proposed by Tone and Tsutsui (2010). The model regroups the decision units with efficiency value of 1 and solves the problem of missing information of effective decision units. The specific formula is as follows:
In Eq. 1, 2,
The specific metrics for the TFEE calculation are demonstrated in Table 1. The formula for the capital stock is
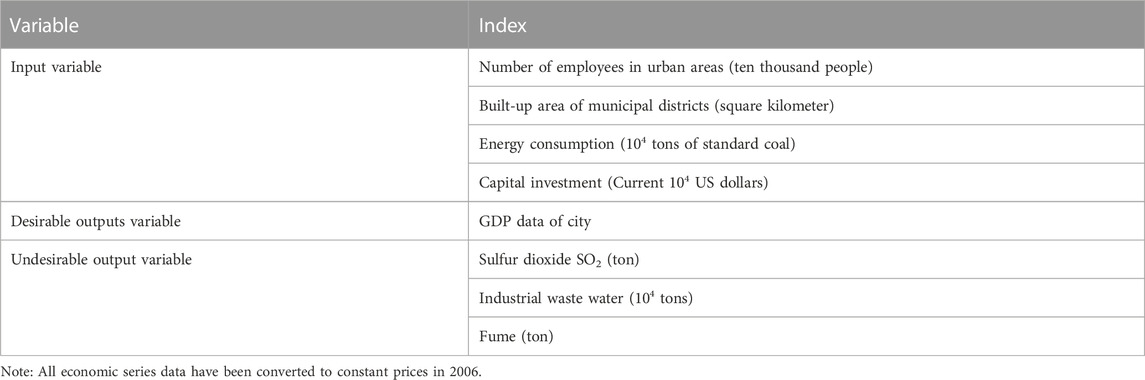
TABLE 1. Input-output indices.
3.3 Other explanatory variables
In addition to the aforementioned variables, this article aims to enhance the reliability of model estimation results by introducing relevant control variables. The selected control variables in this study encompass: The level of urbanization, measured as the proportion of the urban population to the total population (lnurban); The level of economic development, represented by the per capita gross domestic product of each city (lngdppc); The level of technology investment, indicated by the proportion of technology expenditure to the city’s GDP; The degree of openness to the global market, quantified by the total amount of foreign direct investment (lnFDI); The level of environmental regulation, expressed as the ratio of pollution fees to environmental tax revenue relative to total tax revenue (lner) (Wu et al., 2020b; Lee and Lee, 2022). Due to a significant lack of data in some cities, this article ultimately focuses on a sample of 254 cities in China. The data used in this study primarily originates from the China Urban Statistical Yearbook and the China Energy Statistical Yearbook. Table 2 presents an overview of the key variables described in this research.
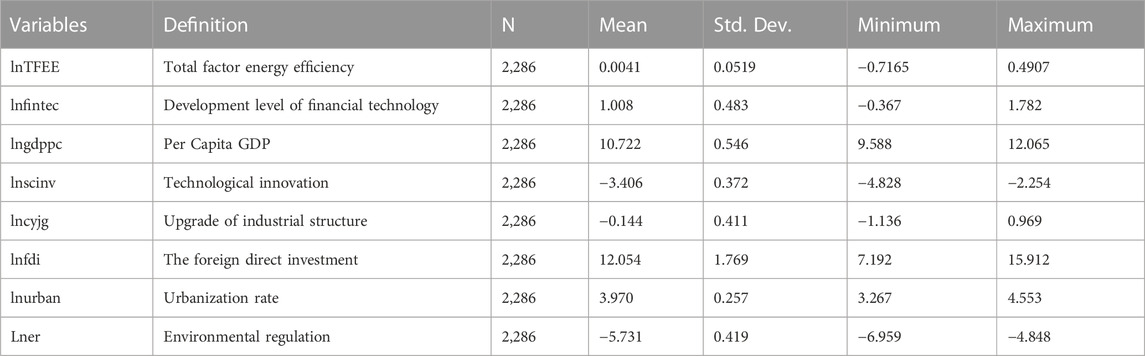
TABLE 2. Data description.
According to Zhao et al. (2020), the digital economy development index is constructed using the entropy value method. The entropy value method is an objective allocation method that determines indicator weights based on the magnitude of the variability of the indicators, which can overcome the subjectivity of artificially determining the weights and the subjectivity of overlapping information between multiple indicator variables, and is therefore suitable for the comprehensive assessment of multiple indicators. Table 3 shows the categories of all the indicators and their descriptions.
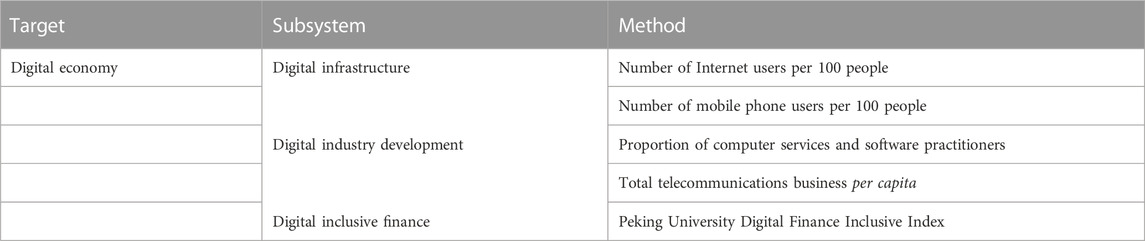
TABLE 3. Index system for the development of the digital economy.
4 Methodology
This article employs panel data encompassing 254 cities in China to investigate the spatiotemporal evolution patterns and impacts of regional financial technology (FinTech) development on Total Factor Energy Efficiency (TFEE). To achieve this, we undertake empirical research by constructing various models, including the fixed effects (FE) model, feasible generalized least squares (FGLS) model, system generalized method of moments (GMM) model, spatial Durbin model, and dynamic spatial Durbin model.
4.1 Spatial correlation test
Before conducting spatial econometric analysis, it is customary to perform spatial autocorrelation testing. Initially, spatial autocorrelation testing is applied to the data on TFEE to examine systematic spatial changes in TFEE. A larger absolute value of the global Moran index indicates a stronger spatial correlation. The global Moran index is defined as follows:
where
In selecting spatial weight matrices for result robustness, this paper employs four distinct types. The Queen neighbor matrix (0-1), the elements of this matrix are dummy variables, for the two regions with a common boundary or node, the dummy variables are assigned the value of 1, otherwise it is 0. Inverse geographic distance matrix (Geo), the elements of this matrix are the inverse of the Euclidean distance between the two regions. Economic distance matrix (Eco), the elements of which are the inverse of the difference between the economic levels of the two regions. The economic-geographical distance matrix (Eco-Geo), which takes into account both the link between the economic levels of the two regions and the geographical distance, and which is the Hadamard product of the distance matrix and the economic distance matrix.
4.2 Spatial Durbin model
If Total Factor Energy Efficiency (TFEE) is found to have a spatial spillover effect after spatial correlation test, according to LeSage and Pace (2008), this paper chooses a spatial Durbin model that considers both spatial lag and spatial error. Its benchmark formula is as follows:
where
In order to explore the spatiotemporal effects of TFEE, we introduced the lagged term of the dependent variable (
where
In Eq. 7,
The partial derivatives in Eq. 8 reflect the short-run impact of the explanatory variables in a given spatial unit on TFEE. The specific equation for the same long term impact is given below:
In Eqs 9, 10,
Equations 8, 10 are matrix formulas consisting of the partial differentials of the explained variables with respect to the explanatory variables, representing short-term and long-term effects, respectively. After further decomposition, the elements on the diagonal of the matrix are the direct effects of the decomposition, indicating the impact of fintech on TFEE in that city, as well as spatial spillover effects within the region. The elements on the off diagonal are the indirect effects of the decomposition, indicating the impact of the city’s fintech on the TFEE of other cities, as well as interregional spatial spillover effects. The total effect is equal to the sum of the direct and indirect effects.
5 Empirical results and discussion
5.1 Spatial autocorrelation of TFEE
The global autocorrelation test is employed to assess the presence of spatial effects among TFEEs in various regions. Utilizing both the 0-1 spatial weight matrix and the economic distance spatial weight matrix, we calculated the Moran index of TFEE. The typical range for Moran’s I falls within [-1,1]. As depicted in Table 4, irrespective of the matrices used, the Moran’s I values for TFEE consistently exceed 0, with statistically significant p-values at the 5% level. This suggests that there is spatial interdependence within the TFEE data among spatial units. Therefore, employing a spatial econometric model for our research is justified.
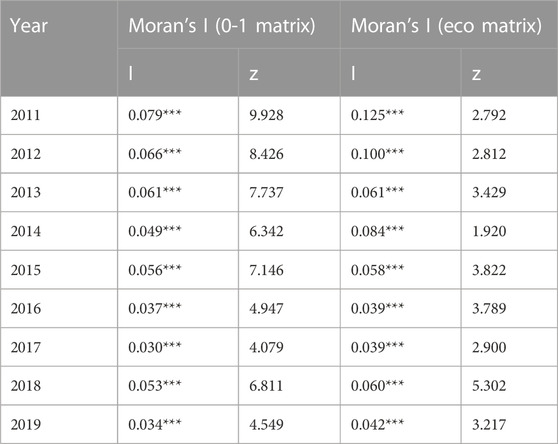
TABLE 4. The spatial correlation test results.
To further investigate the spatial clustering patterns of TFEEs across different regions, this paper conducts local autocorrelation tests, with calculation results presented in Figures 2–4. Figure 2 depicts the scatter plot of Moran’s I based on the 0-1 spatial weight matrix for the year 2011. The horizontal axis represents the observed values of lnTFEE, while the vertical axis represents the spatial lag term of lnTFEE and the lnTFEE values of neighboring spatial units. The figure is divided into four quadrants: the first quadrant signifies High-High (H-H) areas, the second quadrant represents Low-High (L-H) areas, the third quadrant corresponds to Low-Low (L-L) areas, and the fourth quadrant indicates High-Low (H-L) areas. As Figure 2 illustrates, a substantial number of cities are distributed in the first and third quadrants, indicating significant spatial autocorrelation in TFEE in 2011. Furthermore, noteworthy “high-high” and “low-low” aggregation effects are observed. Figures 3, 4 reveal similar “high-high” and “low-low” clustering effects and significant spatial autocorrelation in 2014 and 2018, respectively. From Figure 3, it can be observed that in 2014, China’s urban Total Factor Energy Efficiency (TFEE) was primarily concentrated in the first quadrant, the second quadrant, and the third quadrant, indicating a significant spatial autocorrelation. Similarly, in the low-low cluster area of China’s urban TFEE in 2018, there is a gradual diffusion pattern emerging, but still maintaining strong spatial autocorrelation. Hence, this article affirms the spatial autocorrelation characteristics of TFEE, aligning with the research findings of several scholars (Song et al., 2014; Chen et al., 2023).
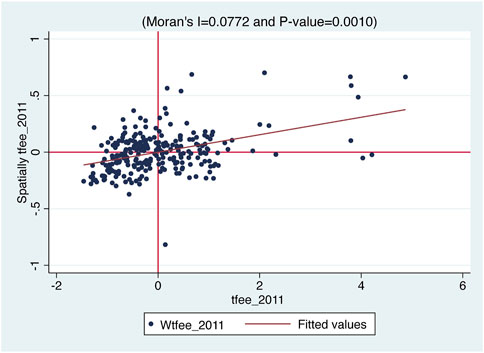
FIGURE 2. Local Moran index of TFEE in 2011.
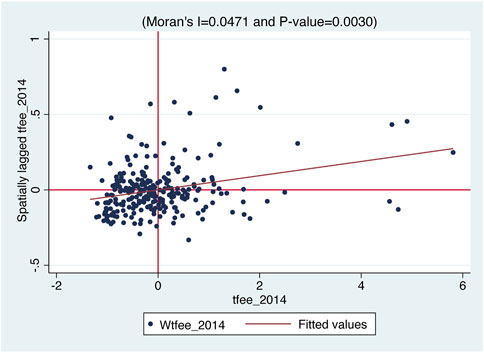
FIGURE 3. Local Moran index of TFEE in 2014.
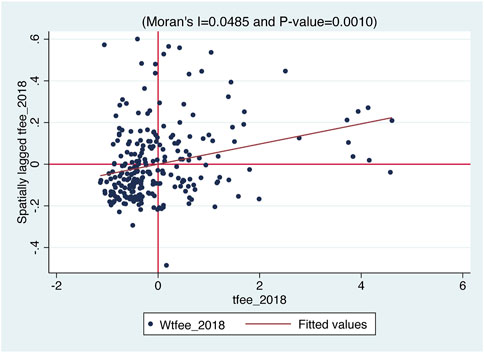
FIGURE 4. Local Moran index of TFEE in 2018.
5.2 Selection of the spatial econometric model
Following Elhorst’s (2012) study, we conducted a battery of tests, including LM tests, robust LM tests, LR tests, and Wald tests, on the regression results of fintech and TFEE to determine the most appropriate type of spatial econometric model. Table 5 presents the test results for both the 0-1 weight matrix and economic distance space weight matrix. The LM and RLM spatial correlation tests rejected the null hypothesis at a significance level of 1%, indicating that the Durbin Model is better suited to describe the relationship between fintech and TFEE. Furthermore, we utilized Wald and LR tests to select the optimal spatial econometric model. As shown in Table 5, the Wald test results (15.77, p < 0.01; 25.25, p < 0.01) and LR test results (17.95, p < 0.01; 33.09, p < 0.01) demonstrate that the SDM model cannot be simplified into a spatial error or lag model, thus affirming the robustness of the spatial Durbin model. In conclusion, the choice of the SDM model in this article is justified.
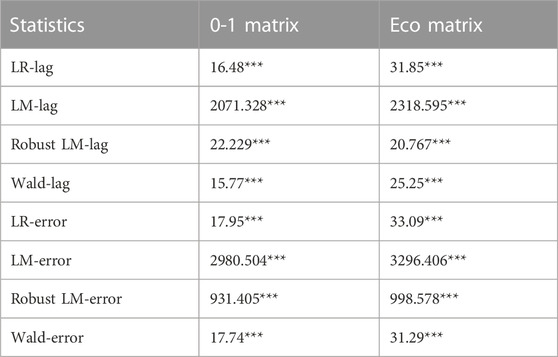
TABLE 5. Model screening results.
5.3 Panel model regression results
In the benchmark regressions, this paper reports the impact of fintech on TFEE in the full sample. First, this paper reports the regression results for fixed effects (FE). Second, this paper also considers the bias caused by autocorrelation, heteroskedasticity, and cross-section correlation to the estimation results by using Feasible generalized least squares (FGLS). In addition, System Generalized Moment Estimation (SYS-GMM), which takes into account some endogeneity, is also shown in the table (Arellano and Bond, 1991). When controlling for urban and annual fixed effects, the estimated coefficient of financial technology (lnfintec) stands at 0.0168, signifying statistical significance at the 1% level. However, this estimate appears notably large. In contrast, the FGLS estimation yields a coefficient of 0.0124, also significant at the 1% level. Additionally, the estimated coefficient of SYS-GMM amounts to 0.0201, demonstrating significance at the 5% level. These statistical results collectively suggest that financial technology (lnfintec) has a significant positive impact on TFEE. In Model 2, considering the fintech estimation coefficient from the FGLS model, for every 1-unit increase in the fintech level, total factor energy efficiency increases by 0.0124. The development of financial technology has thus positively contributed to the advancement of TFEE. Several factors may account for this effect. Firstly, financial technology drives financial innovation by harnessing the power of big data, artificial intelligence, and digital technology. Secondly, it empowers financial institutions to mitigate information asymmetry and overcome green financing obstacles for small and micro enterprises. Furthermore, it provides technical support for assessing environmental risks, thereby fostering TFEE development from a multifaceted perspective.
In order to address potential endogeneity issues between financial technology indicators and TFEE, we employed the SYS-GMM model for estimation, enhancing the robustness of our results. In practical applications, finding appropriate instrumental variables is crucial, and the Generalized Method of Moments (GMM) essentially serves as a tool for this purpose. Martens et al. (2006) proposed that the Instrumental Variable (IV) method is a viable approach to mitigate problems related to endogenous explanatory variables. The lag term of endogenous variables exhibits a high correlation with the current endogenous variables, thereby meeting the necessary conditions and effectively avoiding weak instrumental variables (Bollen, 2012). Additionally, due to the presence of endogenous variables in the lagged portion, which may not be related to the current disturbance term, exogeneity conditions are satisfied (French and Popovici, 2011). In summary, we selected the first-order lag term of TFEE as the instrumental variable. The regression results in Table 6 indicate that the p-value of the AR (2) test for the model is 0.967, failing to reject the original hypothesis. Consequently, the second-order sequence of error terms is not correlated, signifying the reasonableness of the model specification. Furthermore, the Hansen value is 4.35, with a corresponding p-value of 0.226, suggesting the absence of over-identification. These findings affirm the effectiveness of the instrumental variables chosen in our study and underscore the reliability of our regression results. Collectively, these statistical results provide strong evidence that financial technology (lnfintec) exerts a significant positive impact on TFEE. Hence, Hypothesis 1 is substantiated.
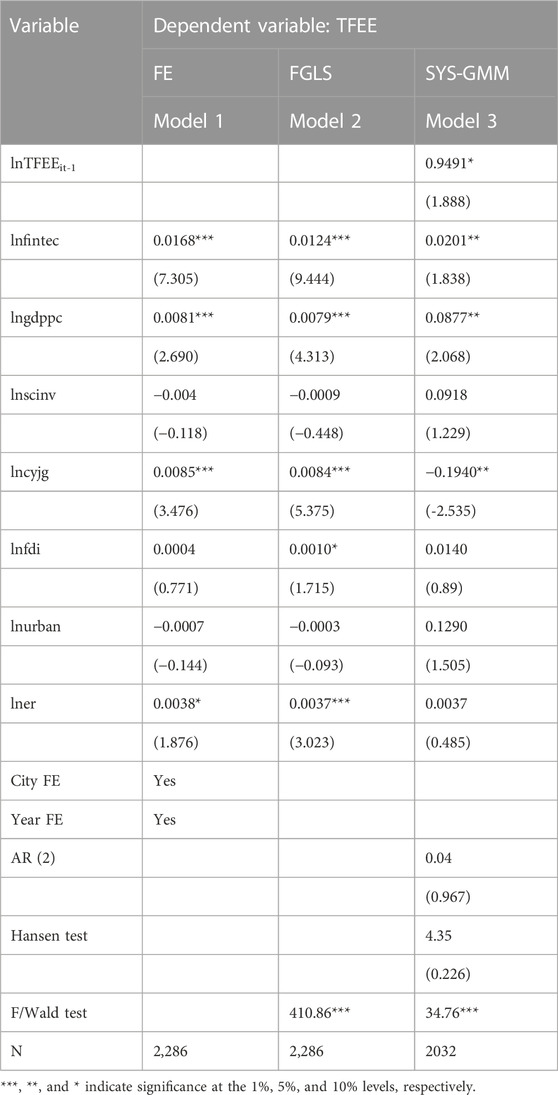
TABLE 6. The impact of financial technology on TFEE.
Based on the preceding theoretical analysis, we propose that digital technology’s impact on TFEE exhibits spatial spillover effects and generates a “siphon effect.” The results are displayed in Table 7. It is evident that spatial correlation coefficients, derived from different spatial weight matrices, exhibit a statistically significant positive trend at the 1% significance level. This observation highlights the presence of spatial spillover effects on Total Factor Energy Efficiency (TFEE). This can be attributed to the fact that regions in closer proximity tend to share stronger financial and technological correlations, increasing the likelihood of mutual contributions to TFEE progress. Specifically, under the 0-1 spatial weight matrix, the regression coefficients of fintech (lnfintec) are 0.0078 and 0.0101, respectively, which are positive at the 1% significance level, indicating that the current development of fintech enhances the financial support and technological development of the local firms, which is conducive to the enhancement of TFEE. under the economic distance spatial weight matrix, the regression coefficient of fintech (lnfintec) is 0.0127, respectively. Regression coefficients are 0.0127 and 0.0117, respectively, which are positive at 1% significance level, which indicates that fintech development has a significant positive impact on TFEE. The estimation results of the dynamic SDM model show that the coefficient of the time lag term (lnTFEE_L1.) of lnTFEE is −0.1963, which is significantly negative at 1%, suggesting that the TFEE of the local previous period will instead inhibit the improvement of the TFEE of the current period. However, the coefficient of the spatial lag term of lnTFEE (W*lnTFEE_L1.) is 0.2472, which is significantly positive at the 1% significance level, indicating that the previous period’s TFEE in the neighboring cities can significantly enhance the current period’s TFEE in the city. In addition, the regression results of the Dynamic SDM are basically the same as those of the SDM under the different matrices, which indicates that the regression results are credible. We also notice that the coefficient of economic development level (lngdppc) is significantly positive, which indicates that economic development is also an important means to increase TFEE. In conclusion, the results support Hypothesis 2, indicating that, after accounting for spatial spillover effects, the development of fintech can significantly enhance TFEE.
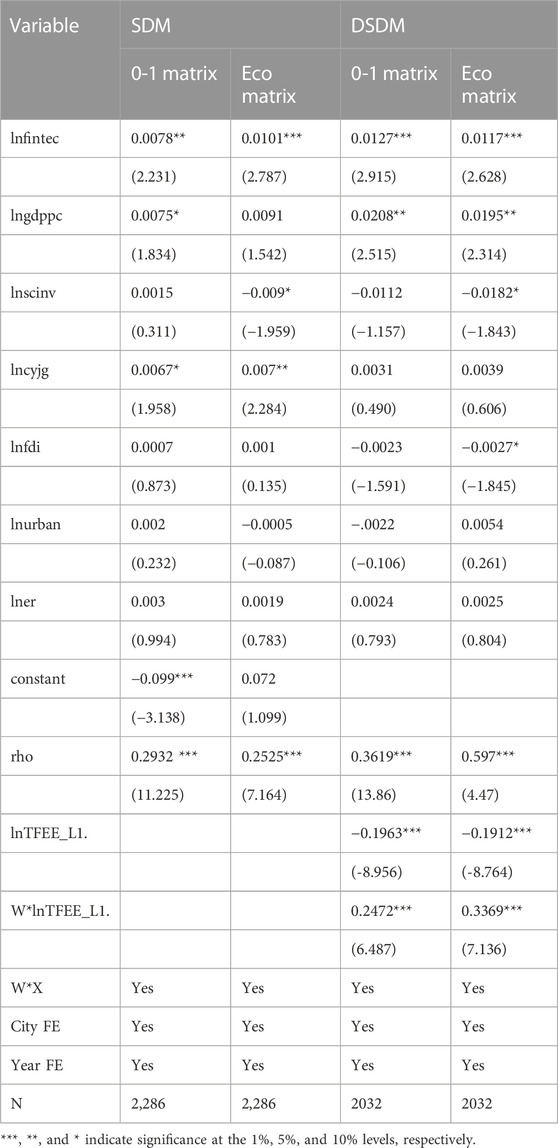
TABLE 7. The result of Durbin models.
LeSage and Pace (2008) argue that decomposing spatial effects into direct and indirect effects can effectively mitigate bias in spatial regression point estimation. Therefore, this article decomposes the regression results of DSDM under the economic distance matrix. Table 8 displays the long-term and short-term effects after decomposition. In the long run, the direct effect coefficient of financial technology (lnfintec) is significantly positive, suggesting that the local level of financial technology development positively influences local TFEE. The indirect effect coefficient of financial technology (lnfintec) is also significantly positive. Two possible mechanisms could explain this impact: first, the development of fintech in surrounding cities may promote local TFEE, and second, the advancement of fintech in neighboring cities may boost their own TFEE, subsequently promoting local TFEE. In the short term, the direct effect coefficient of financial technology (lnfintec) remains significantly positive, indicating that local financial technology progress immediately boosts local TFEE. Similarly, the indirect effect coefficient of financial technology (lnfintec) is significantly positive, suggesting that the short-term advancement of financial technology levels in neighboring cities has a positive promoting effect on TFEE.
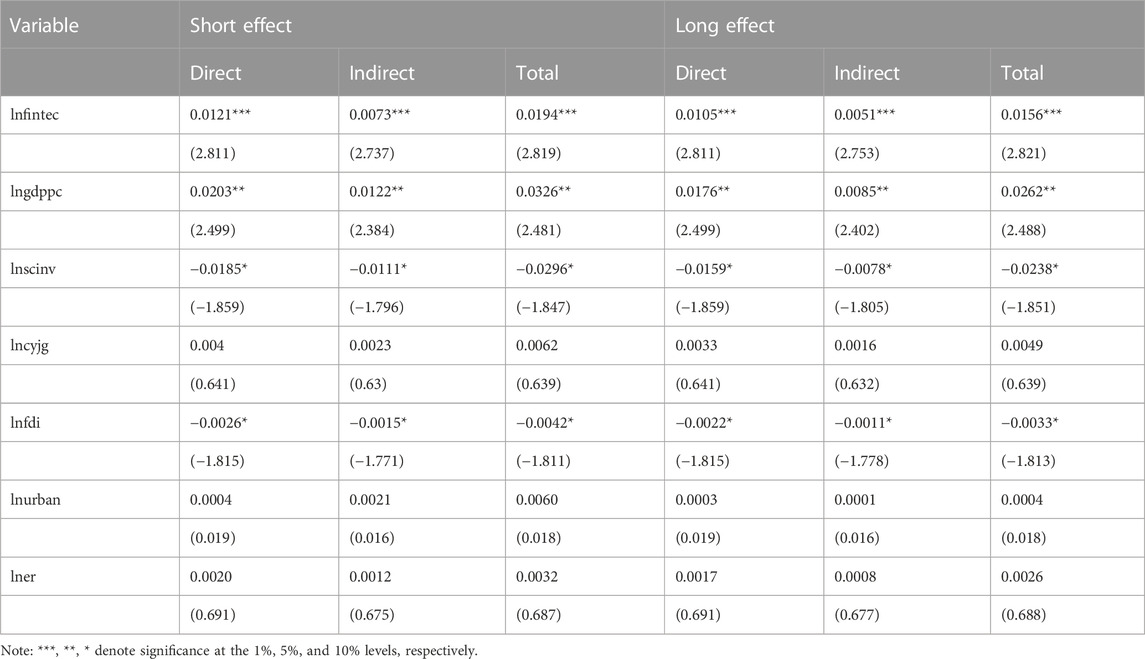
TABLE 8. Spatial spillover effect.
5.4 Further analysis
The term “digital economy” refers to a series of economic activities that utilize digitized knowledge and information as key production factors. It relies on modern information networks as essential carriers and leverages the effective use of information and communication technology to drive efficiency improvements and optimize economic structures. In the literature review section, we have elucidated the theoretical potential of synergistic benefits arising from the development of the digital economy and fintech in enhancing TFEE. In order to investigate the synergistic effects of digital economic development and fintech on the promotion of TFEE, this paper constructs a moderating effect model by including “lndigeco” and interaction terms within the SDM model. The results are presented in Table 9. Irrespective of the chosen spatial weight matrices, both “lnfintec” and its interaction term yield significantly positive results. This indicates that as the digital economy advances, the role of fintech in enhancing TFEE will be further reinforced. The examination of the two spatial weight matrices lends credibility to our empirical findings. First, the progression of Internet communication technology has transformed the information industry into a technology-intensive sector, which, in turn, enhances TFEE through knowledge spillover and technological innovation. Second, digital technology effectively addresses the issue of information mismatches, thus facilitating the co-development of fintech and further improving the allocation efficiency of traditional factors such as capital and labor. Hence, we have confirmed Hypothesis 3, demonstrating that the development of the digital economy and fintech can synergistically promote TFEE.
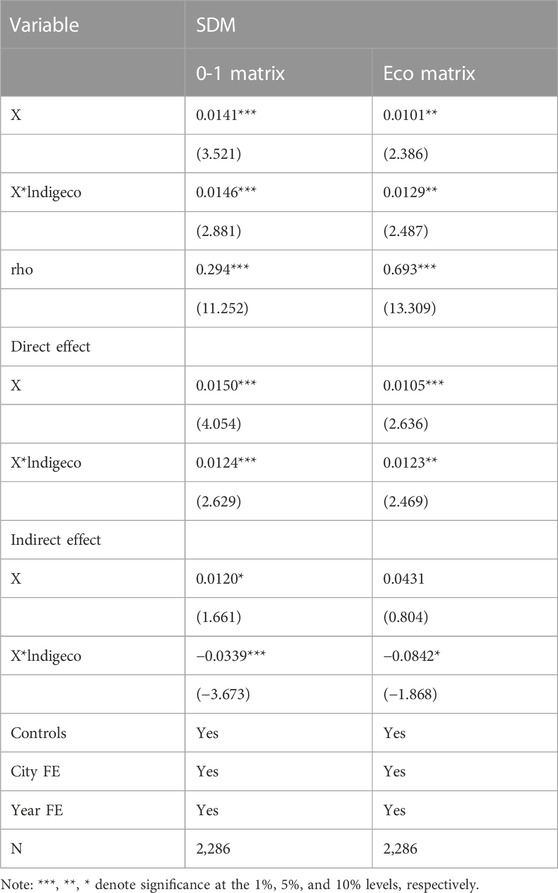
TABLE 9. Digital economic development and TFEE.
This paper provides robust evidence that fintech can effectively contribute to TFEE. However, does this positive effect appear to be characterized by heterogeneity with city resource endowment? Based on the National Sustainable Development Plan for Resource Cities issued by the Chinese government in 2013, this paper classifies the sample cities into four categories: non-resource cities, growing resource cities, mature resource cities, declining cities, and regenerative resource cities. In the model, we add three dummy variables for growing resource cities (grcity), mature resource cities (mrcity), and declining and regenerative resource cities (rrcity), and we add the interaction terms of the three dummy variables. Table 10 shows the results of regional heterogeneity. The effects of the dummy variables are completely absorbed by the city fixed effects and therefore cannot be found in the table. With different spatial weight matrices, the model regression results have insignificantly positive coefficients for mrcity and rrcity as well as their interaction terms, but significantly negative coefficients for grcity and its interaction term. This suggests that there is no difference in role between mature resource cities and non-resource cities. Similarly, there is no difference in effect between regenerating and declining resource cities and non-resource cities. However, FinTech in growing resource cities is attenuated in promoting TFEE. The reason for the above phenomenon is that, firstly, the non-resource cities’ pay more attention to industrial restructuring and technological innovation to form a better environment for the development of digital technology, which can better enhance TFEE. secondly, other resource-based resource industries have matured and pay more attention to industrial restructuring and the development of high-tech industries, which would make the role of Fintech greater. Therefore, even resource-rich cities still need the key role of fintech and technological innovation for TFEE.
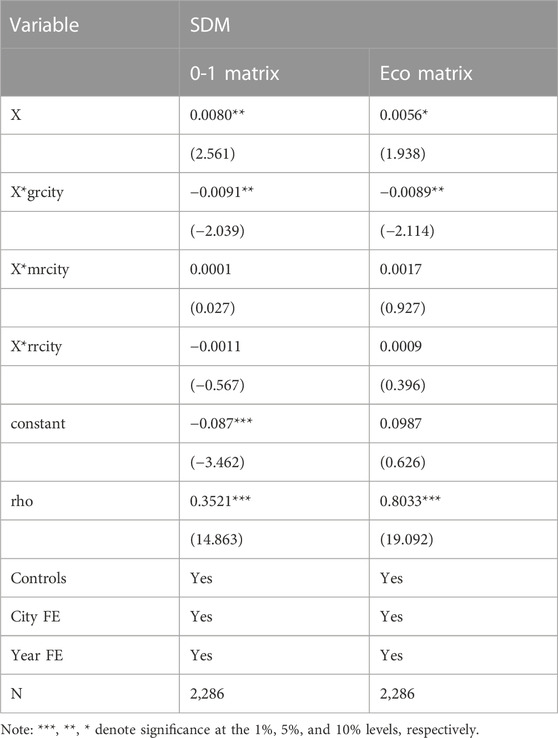
TABLE 10. Heterogeneity of different regions.
5.5 Robustness test
This article underscores the critical importance of spatial weight matrices in spatial econometric analysis. To ensure the robustness of our results, two additional spatial weight matrices are employed for re-estimation. The regression results for the anti-geographic distance spatial weight matrix and the economic-geographic nested matrix are presented in Table 11. Upon reviewing the regression results in Table 11, it becomes evident that the core explanatory variables maintain their significance, and the direction of the positive and negative regression coefficients remains consistent across different matrices. Furthermore, the spatial correlation coefficients exhibit significant positivity at the 1% significance level. The direct effects also demonstrate significant positivity, indicating that the development of local fintech has a substantial positive influence on local TFEE, with a similarly positive impact on the TFEE of adjacent cities.
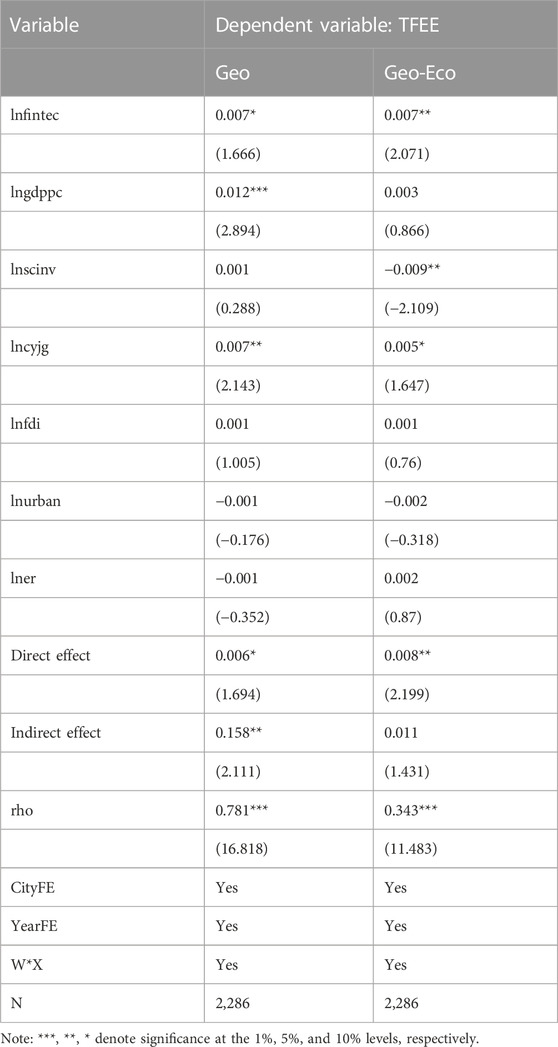
TABLE 11. Robustness check of other spatial weight matrices.
Considering the possible impact on the results of the benchmark regression due to data measurement, this paper replaces the measure of the explanatory variable TFEE. In the benchmark regression due to the application of the super-efficient SBM model for measurement. According to (Zhang et al., 2020), the SBM model can be further combined with DDF so that the radiality and directionality of the DDF model can be effectively avoided. Therefore, this paper further, considers the re-measurement of TFEE based on the original input-output data by applying the SBM-DDF model. Based on the new data, this paper re-runs the regression, and the empirical results are shown in Table 12. According to the regression results, it can be seen that the significance of the main core variables as well as the sign of the regression coefficients are basically the same. In addition, the spatial correlation coefficient is still significantly positive at the 1% significance level. The direct effects are also significantly positive, confirming that fintech has a significant positive impact on local TFEE, and equally significant impact on TFEE in neighboring cities. Therefore, the core findings of this paper remain robust.
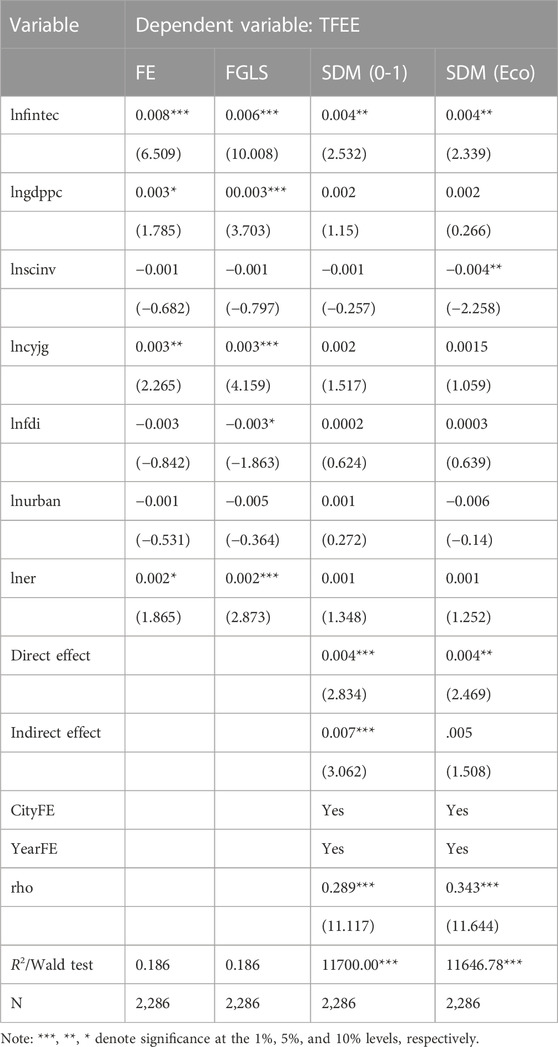
TABLE 12. Robustness check of replace the interpreted variable.
6 Conclusion and policy recommendations
TFEE plays an essential role in the high-quality development of China’s economy, but it remains to be examined whether the current development of regional FinTech has the ability to promote energy efficiency. First, utilizing data spanning from 2011 to 2019 from 254 Chinese cities, TFEE is measured for each city through the super-efficient SBM model and SBM-DDF. Second, the spatial Durbin model and the dynamic spatial Durbin model are employed to investigate the spatio-temporal relationship between regional FinTech development and TFEE. The key findings of this study are as follows: 1) The development of financial technology significantly elevates urban Total Factor Energy Efficiency (TFEE). This conclusion remains consistent even after subjecting the analysis to a battery of robustness tests, confirming the reliability of our findings. This finding expands the implementation pathways for the Chinese government’s efforts to reduce pollution and enhance efficiency. 2) Regardless of the spatial weight matrix used, spatial correlation coefficients are significantly positive at the 1% significance level, indicating a spatial spillover effect on TFEE. After controlling for spatial spillover effects, this paper confirms that the impact of regional fintech development on local TFEE remains positive and significant, extending to surrounding cities. Furthermore, our study reveals that the impact of financial technology exhibits a dynamic cumulative effect, meaning that over time, the positive influence of financial technology on TFEE gradually strengthens. 3) The study also reveals that the synergistic effect of digital economic development and fintech development leads to an amplified positive effect on TFEE with the advancement of the digital economy. 4) Heterogeneity analysis indicates that the impact of FinTech development on TFEE is more pronounced in mature resource cities as well as non-resource cities. The above findings expand new ideas for research on FinTech. At the same time, they provide a new theoretical path and a reliable empirical basis for energy conservation and efficiency in developing countries such as China.
Based on these findings, the following recommendations are proposed: 1) The government can facilitate more accessible financing and investment pathways for renewable energy projects through financial technology platforms. This can include leveraging FinTech innovations to provide flexible and cost-effective financing channels to attract more investors to the renewable energy sector. 2) Inter-city cooperation should be strengthened to harness the positive spillover effect of TFEE. Careful consideration should be given to avoid inefficient industrial transfers due to policy disparities. 3) Resource-oriented cities should enhance support for fintech development while improving resource utilization efficiency and industrial structures. 4) Local governments should vigorously support science and technology innovation and the digital economy. The development of financial technology can boost local TFEE and have a positive effect on surrounding cities. Therefore, establishing regional science and technology financial centers and collaborative alliances can facilitate the circulation of resources such as talent, information, and finance, ultimately improving total factor energy efficiency in each region.
While this study offers empirical insights and policy recommendations, it is important to acknowledge several limitations. For instance, due to data availability constraints, the research sample does not encompass all regions of China, with notably smaller sample sizes in the western regions. Furthermore, there is room for refinement in the methods used for measuring Total Factor Energy Efficiency (TFEE). The mechanisms and transmission pathways between spillover effects and TFEE warrant further investigation. In the future, we intend to broaden the sample scope to comprehensively examine the relationship and mechanisms between financial technology and TFEE. Additionally, we aspire to extend this research to other developing countries to derive more universally applicable conclusions and recommendations. Lastly, we will delve into other avenues for enhancing TFEE.
Data availability statement
The original contributions presented in the study are included in the article/Supplementary Material, further inquiries can be directed to the corresponding author.
Author contributions
XK: Conceptualization, Data curation, Funding acquisition, Methodology, Resources, Visualization, Writing–original draft. TX: Investigation, Project administration, Supervision, Visualization, Writing–review and editing.
Funding
The authors declare that no financial support was received for the research, authorship, and/or publication of this article.
Conflict of interest
Authors XK and TX were employed by State Grid Jiangsu Electric Power Co., Ltd.
Publisher’s note
All claims expressed in this article are solely those of the authors and do not necessarily represent those of their affiliated organizations, or those of the publisher, the editors and the reviewers. Any product that may be evaluated in this article, or claim that may be made by its manufacturer, is not guaranteed or endorsed by the publisher.
References
Ahl, A., Yarime, M., Tanaka, K., and Sagawa, D. (2019). Review of blockchain-based distributed energy: implications for institutional development. Renew. Sustain. Energy Rev. 107, 200–211. doi:10.1016/j.rser.2019.03.002
Aldieri, L., Gatto, A., and Vinci, C. P. (2022). Is there any room for renewable energy innovation in developing and transition economies? Data envelopment analysis of energy behaviour and resilience data. Resour. Conserv. Recycl. 186. doi:10.1016/j.resconrec.2022.106587
Arellano, M., and Bond, S. (1991). Some tests of specification for panel data: Monte Carlo evidence and an application to employment equations. Rev. Econ. Stud. 58 (02), 277–297. doi:10.2307/2297968
Bollen, K. A. (2012). Instrumental variables in sociology and the social sciences. Annu. Rev. Sociol. 38, 37–72. doi:10.1146/annurev-soc-081309-150141
Bui, T. H., and Nguyen, V. P. (2023). The impact of artificial intelligence and digital economy on vietnam’s legal system. Int. J. Semiot. Law - Rev. Int. Sémiot. Jurid. 36, 969–989. doi:10.1007/s11196-022-09927-0
Chen, Y., Kumara, E. K., and Sivakumar, V. (2023). RETRACTED ARTICLE: investigation of finance industry on risk awareness model and digital economic growth. Ann. Oper. Res. 326, 15. doi:10.1007/s10479-021-04287-7
Chen, Z., Song, P., and Wang, B. (2021). Carbon emissions trading scheme, energy efficiency and rebound effect – evidence from China’s provincial data. Energy Policy 157, 112507. doi:10.1016/j.enpol.2021.112507
Cheng, M., and Qu, Y. (2020). Does bank FinTech reduce credit risk? Evidence from China. Pac.-Basin Finance J. 63, 101398. doi:10.1016/j.pacfin.2020.101398
Dong, F., Li, Y., Zhang, X., Zhu, J., and Zheng, L. (2021). How does industrial convergence affect the energy efficiency of manufacturing in newly industrialized countries? Fresh evidence from China. J. Clean. Prod. 316, 128316. doi:10.1016/j.jclepro.2021.128316
Elhorst, J. P. (2012). Dynamic spatial panels: models, methods, and inferences. J. Geogr. Syst. 14, 5–28. doi:10.1007/s10109-011-0158-4
Elhorst, J. P. (2014). SpringerBriefs in regional science. Berlin, Heidelberg: Springer Berlin Heidelberg. doi:10.1007/978-3-642-40340-8Spatial econometrics: from cross-sectional data to spatial panels
Fang, G., Gao, Z., Tian, L., and Fu, M. (2022). What drives urban carbon emission efficiency? – Spatial analysis based on nighttime light data. Appl. Energy. 312. doi:10.1016/j.apenergy.2022.118772
Fang, G., Chen, G., Yang, K., Yin, W., and Tian, L. (2023). Can green tax policy promote China’s energy transformation?— A nonlinear analysis from production and consumption perspectives. Energy 269. doi:10.1016/j.energy.2023.126818
Farrell, M. J. (1957). The measurement of productive efficiency. J. R. Stat. Soc. Ser. Gen. 120, 253–290. doi:10.2307/2343100
French, M. T., and Popovici, I. (2011). That instrument is lousy! In search of agreement when using instrumental variables estimation in substance use research. Health Econ. 20, 127–146. doi:10.1002/hec.1572
Galeotti, M., Salini, S., and Verdolini, E. (2020). Measuring environmental policy stringency: approaches, validity, and impact on environmental innovation and energy efficiency. Energy Policy 136, 111052. doi:10.1016/j.enpol.2019.111052
Ge, T., Cai, X., and Song, X. (2022). How does renewable energy technology innovation affect the upgrading of industrial structure? The moderating effect of green finance. Renew. Energy 197, 1106–1114. doi:10.1016/j.renene.2022.08.046
Gomber, P., Koch, J.-A., and Siering, M. (2017). Digital Finance and FinTech: current research and future research directions. J. Bus. Econ. 87, 537–580. doi:10.1007/s11573-017-0852-x
Hall, B. H. (2002). The financing of research and development. Oxf. Rev. Econ. Policy 18, 35–51. doi:10.1093/oxrep/18.1.35
Heiskanen, A. (2017). The technology of trust: how the Internet of Things and blockchain could usher in a new era of construction productivity. Constr. Res. Innov. 8, 66–70. doi:10.1080/20450249.2017.1337349
Hu, W., and Li, X. (2023). Financial technology development and green total factor productivity. Sustainability 15, 10309. doi:10.3390/su151310309
Hu, J.-L., and Wang, S.-C. (2006). Total-factor energy efficiency of regions in China. Energy Policy 34, 3206–3217. doi:10.1016/j.enpol.2005.06.015
Hui, W., Xin-gang, Z., Ling-zhi, R., Ji-cheng, F., and Fan, L. (2021). The impact of technological progress on energy intensity in China (2005–2016): evidence from a geographically and temporally weighted regression model. Energy 226, 120362. doi:10.1016/j.energy.2021.120362
Jiang, X., Wang, X., Ren, J., and Xie, Z. (2021). The nexus between digital finance and economic development: evidence from China. Sustainability 13, 7289. doi:10.3390/su13137289
Kuang, W., Liu, J., Dong, J., Chi, W., and Zhang, C. (2016). The rapid and massive urban and industrial land expansions in China between 1990 and 2010: a CLUD-based analysis of their trajectories, patterns, and drivers. Landsc. Urban Plan. 145, 21–33. doi:10.1016/j.landurbplan.2015.10.001
Lee, C.-C., and Lee, C.-C. (2022). How does green finance affect green total factor productivity? Evidence from China. Energy Econ. 107, 105863. doi:10.1016/j.eneco.2022.105863
LeSage, J. P., and Pace, R. K. (2008). SPATIAL ECONOMETRIC MODELING OF ORIGIN-DESTINATION FLOWS. J. Reg. Sci. 48, 941–967. doi:10.1111/j.1467-9787.2008.00573.x
Li, C., Yan, X., Song, M., and Yang, W. (2020). Fintech and corporate innovation——evidence from Chinese NEEQ-listed companies. China Ind. Econ., 81–98. doi:10.19581/j.cnki.ciejournal.2020.01.006
Li, Y., and Chen, Y. (2021). Development of an SBM-ML model for the measurement of green total factor productivity: the case of pearl river delta urban agglomeration. Renew. Sustain. Energy Rev. 145, 111131. doi:10.1016/j.rser.2021.111131
Lin, L., Huang, Z., and Jia, X. (2022). Influencing factors of employee brand equity from the perspective of FinTech. Front. Psychol. 13, 1047936. doi:10.3389/fpsyg.2022.1047936
Liu, R., Wang, D., Zhang, Li, and Zhang, L. (2019). Can green financial development promote regional ecological efficiency? A case study of China. Nat. Hazards 95, 325–341. doi:10.1007/s11069-018-3502-x
Liu, Y., Ma, C., and Huang, Z. (2023). Can the digital economy improve green total factor productivity? An empirical study based on Chinese urban data. Math. Biosci. Eng. 20, 6866–6893. doi:10.3934/mbe.2023296
Lu, P., Liu, J., Wang, Y., and Ruan, L. (2021). Can industrial agglomeration improve regional green total factor productivity in China? An empirical analysis based on spatial econometrics. Growth Change 52, 1011–1039. doi:10.1111/grow.12488
Lyu, Y., Wang, W., Wu, Y., and Zhang, J. (2023). How does digital economy affect green total factor productivity? Evidence from China. Sci. Total Environ. 857, 159428. doi:10.1016/j.scitotenv.2022.159428
Ma, R., Li, F., and Du, M. (2022). How does environmental regulation and digital finance affect green technological innovation: evidence from China. Front. Environ. Sci. 10, 928320. doi:10.3389/fenvs.2022.928320
Martens, E. P., Pestman, W. R., De Boer, A., Belitser, S. V., and Klungel, O. H. (2006). Instrumental variables: application and limitations. Epidemiology 17, 260–267. doi:10.1097/01.ede.0000215160.88317.cb
Razzaq, A., and Yang, X. (2023). Digital finance and green growth in China: appraising inclusive digital finance using web crawler technology and big data. Technol. Forecast. Soc. Change 188, 122262. doi:10.1016/j.techfore.2022.122262
Ren, S., Hao, Y., and Wu, H. (2022). The role of outward foreign direct investment (OFDI) on green total factor energy efficiency: does institutional quality matters? Evidence from China. Resour. Policy 76, 102587. doi:10.1016/j.resourpol.2022.102587
Ren, S., Hao, Y., and Wu, H. (2022). The role of outward foreign direct investment (OFDI) on green total factor energy efficiency: does institutional quality matters? Evidence from China. Resour. Policy 76, 102587. doi:10.1016/j.resourpol.2022.102587
Ren, S., Hao, Y., Xu, L., Wu, H., and Ba, N. (2021). Digitalization and energy: how does internet development affect China’s energy consumption? Energy Econ. 98, 105220. doi:10.1016/j.eneco.2021.105220
Song, Z., Zhang, C., Yang, G., Feng, Y., Ren, G., and Han, X. (2014). Comparison of biogas development from households and medium and large-scale biogas plants in rural China. Renew. Sustain. Energy Rev. 33, 204–213. doi:10.1016/j.rser.2014.01.084
Suryono, R. R., Budi, I., and Purwandari, B. (2020). Challenges and trends of financial technology (fintech): a systematic literature review. Information 11, 590. doi:10.3390/info11120590
Tang, L., and He, G. (2021). How to improve total factor energy efficiency? An empirical analysis of the Yangtze River economic belt of China. Energy Oxf 235, 121375. doi:10.1016/j.energy.2021.121375
Tang, S., Lai, X., and Huang, R. (2019). How can fintech innovation affect TFP: facilitating or inhibiting? ———theoretical analysis framework and regional practice. China Soft Sci. Mag., 134–144. doi:10.3969/j.issn.1002-9753.2019.07.013
Tone, K., and Tsutsui, M., 2010. Dynamic DEA: a slacks-based measure approach☆. Omega 38, 145–156. doi:10.1016/j.omega.2009.07.003
Wang, J., Wang, B., Dong, K., and Dong, X. (2022). How does the digital economy improve high-quality energy development? The case of China. Technol. Forecast. Soc. Change 184, 121960. doi:10.1016/j.techfore.2022.121960
Wang, S., and Ma, Y. (2018). Influencing factors and regional discrepancies of the efficiency of carbon dioxide emissions in Jiangsu, China. Ecol. Indic. 90, 460–468. doi:10.1016/j.ecolind.2018.03.033
Wang, X., Song, M., Meng, X., and Li, N. (2023). Fintech and structural features of manufacturing innovation - and discussion on the effects differences of pilot policy of combination technology and finance. J. Southwest Univ. Soc. Sci. Ed. 49, 119–133. doi:10.13718/j.cnki.xdsk.2023.04.011
Wu, H., Hao, Y., and Ren, S. (2020a). How do environmental regulation and environmental decentralization affect green total factor energy efficiency: evidence from China. Energy Econ. 91, 104880. doi:10.1016/j.eneco.2020.104880
Wu, H., Hao, Y., and Ren, S. (2020b). How do environmental regulation and environmental decentralization affect green total factor energy efficiency: evidence from China. Energy Econ. 91, 104880. doi:10.1016/j.eneco.2020.104880
Xie, X., Shen, Y., Zhang, H., and Guo, F. (2018). Can digital finance promote entrepreneurship? — Envidence from China. Chin. Econ. Q. 17, 1557–1580. doi:10.13821/j.cnki.ceq.2018.03.12
Zhang, B., Yu, L., and Sun, C. (2022). How does urban environmental legislation guide the green transition of enterprises? Based on the perspective of enterprises’ green total factor productivity. Energy Econ. 110, 106032. doi:10.1016/j.eneco.2022.106032
Zhang, J., Kang, L., Li, H., Ballesteros-Pérez, P., Skitmore, M., and Zuo, J. (2020). The impact of environmental regulations on urban Green innovation efficiency: the case of Xi’an. Sustain. Cities Soc. 57, 102123. doi:10.1016/j.scs.2020.102123
Keywords: financial technology, total factor energy efficiency, energy transformation, digital economy, spatial measurement
Citation: Kong X and Xu T (2023) How FinTech affects total factor energy efficiency? Evidence from Chinese cities. Front. Energy Res. 11:1296820. doi: 10.3389/fenrg.2023.1296820
Received: 19 September 2023; Accepted: 09 November 2023;
Published: 23 November 2023.
Edited by:
Michael Carbajales-Dale, Clemson University, United StatesReviewed by:
Adriana Grigorescu, National School of Political Studies and Public Administration, RomaniaRuijin Du, Jiangsu University, China
Guochang Fang, Nanjing University of Finance and Economics, China
Copyright © 2023 Kong and Xu. This is an open-access article distributed under the terms of the Creative Commons Attribution License (CC BY). The use, distribution or reproduction in other forums is permitted, provided the original author(s) and the copyright owner(s) are credited and that the original publication in this journal is cited, in accordance with accepted academic practice. No use, distribution or reproduction is permitted which does not comply with these terms.
*Correspondence: Xinyue Kong, MTM4NTE5NjkyMTZAMTM5LmNvbQ==