 Ding Xiaoyan1
 Guo Guihong
 Ding Longting
95% of researchers rate our articles as excellent or good
Learn more about the work of our research integrity team to safeguard the quality of each article we publish.
Find out more
ORIGINAL RESEARCH article
Front. Energy Res. , 29 November 2023
Sec. Sustainable Energy Systems
Volume 11 - 2023 | https://doi.org/10.3389/fenrg.2023.1295404
This article is part of the Research Topic Sustainable Road Infrastructure: Technologies and Assessments View all 14 articles
The new generation of pavement technology with the goal of longevity is an important supporting technology that can promote the achievement of sustainable development of high-speed roadways. To further investigate the evolution trend of long-life pavement performance, this paper paved experimental sections to explore the correlations between pavement structure combinations and pavement performances. This paper presented four experimental sections with different pavement structures, asphalt concrete layer thicknesses, and pavement materials. Then, this paper analyzed the effects of the seasonal factors, pavement structure, and lanes on the deflection value and rut depth from three dimensions by the Pearson correlation coefficient (PCC). Finally, this paper used the analysis of variance (ANOVA) to analyze the relationships between the layer thickness of various materials in the pavement structure and the pavement performances, including the deflection value, international roughness index (IRI), texture depth (TD), British Pendulum Number (BPN), sideway force coefficient (SFC), rut depth, and disease area. The results showed that the seasonal factors significantly affected the deflection values of pavement structures with PCCs of 0.61, 0.72, 0.53, and 0.78. The high temperatures increased the average deflection values by 22.85%, 72.88%, 77.61%, and 88.13%, respectively. Under the influence of high temperature in summer and traffic loads, the increased ranges of average rut depth were −0.2%, 4.89%, 9.56%, and 7.31%, respectively. The results of ANOVA showed that the pavement structure type and thickness of each structural layer significantly affected the deflection value, and there also was a strong correlation between the pavement structure type, thickness, BPN, and SFC with p-values less than 0.05. Increasing the thickness of the asphalt surface was beneficial for reducing the area of defects, while laying the semi-rigid base layer was beneficial for maintaining the deflection value and rut depth at a lower level.
Achieving durable asphalt pavements could minimize the structural damage caused by minor pavement cracks, which would reduce the high repair and maintenance costs. The structure and technology of long-life asphalt pavement had been proven to be an effective way to improve the pavement quality and service life (Bushmeyer, 2002; Ferne, 2006; Wang and Zhou, 2019). However, theoretical analysis, mechanical calculation, finite element analysis, and other methods were commonly used in the study of pavement structure performances (Yang et al., 2010; Martin et al., 2012; Zheng, 2014). There was a certain deviation between the calculated results and the actual values. Therefore, it is necessary to construct the experimental sections with the long-life pavement structures to explore the correlation between the pavement structure combinations and pavement performances, and to further investigate the evolution trend of long-life pavement performances.
The long-life pavement structures had received widespread attention. After continuous research and development, researchers conducted many meaningful research studies and achievements, especially regarding the relationships between pavement structure combinations and pavement performances. Xu and Sun (1996) analyzed the effects of pavement structure combinations on the performances of asphalt pavements and established a quantitative relationship between the pavement structure combinations and road performances, and a prediction model for road performance. Cui et al. (2008) established a finite element model using the measured tire loads and analyzed the mechanical characteristics of asphalt pavement structures. The research results showed that increasing the thickness of the surface layer and the modulus of the middle layer was very beneficial for handling the inter-stress. Liu (2012) established four types of pavement structure combination models using ABAQUS software and analyzed the stress and strain distribution characteristics inside the long-life asphalt pavement structure with a semi-rigid base under the conditions of different axle types and vehicle speeds. Wang et al. (2013) analyzed the structural plasticity damage of composite pavement (continuous reinforcement concrete pavement and asphalt concrete) and studied the laws of structural stresses and damages under different loading conditions. The analysis results showed that there were differences in the distribution of structural damage along the depth range. Zhu et al. (2023) prepared a new composite geomaterial layer for the pavement structure with a semi-rigid base to reduce the impact of reflective cracks and prolonged the service time of the pavement structure. The results showed that the composite geomaterial layer prolonged the time of crack expansion from the subgrade to the surface layer and improved the structural life of the pavement by 78.3% compared to the control group. To evaluate the effects of asphalt concrete mixtures on pavement performance, seven different flexible pavement structures were investigated using AASHTOWare Pavement ME Design. The results manifested that the mixture types and their positions in the structure had profound effects on pavement performances and inter-stress (Shakhan et al., 2023).
During the serviceable period, the performance evolution of long-life pavement structures under environmental factors and traffic loads had received much attention. Conducting the experimental sections was the most effective method to obtain the evolution law of road performances. At present, based on the physical simulation test, full-scale loop roads, and the accelerated loading test, many scholars have conducted research on the degradation of pavement structural performance. Erlingsson (2010) conducted accelerated load tests to study the response behavior and performance of commonly used pavement structures in Sweden. The results showed that the actual measurement results of rutting depth could be fitted and predicted by the Power function. In addition, the rise of groundwater level increased the permanent deformation of the pavement structure. Zhou studied the structural and mechanical responses of asphalt pavement and the nonlinear characteristics of pavement materials using full-scale tests, material tests, and actual measurement verification. The method for analyzing asphalt pavement structures based on material nonlinearity was established (Zhou et al., 2018; Zhou and Wang, 2018). Yang et al. (2021) assessed the difference in the performances of pavement structures under conventional loading and accelerated loading by the accelerated pavement tests (APTs). The test results showed that the pavement would produce deeper rutting under the same axle loading cycle in the context of APT, forming an accelerated loading effect. Ritter et al. (2012) analyzed and compared the structural performance of flexible road pavements throughout the service life through APT. The measurement results showed a significant decrease in the structural strength of two full-scale flexible road pavements. The comparison of the data showed that there were significant differences in the total decrease of structural strength and the rate of deterioration. Chun et al. (2017) evaluated the structural benefits of a prime coat by APT. Two full-scale field test sections were built using different interlayer conditions between asphalt concrete and the base layer. The experimental results indicated that the prime coat application was beneficial for slowing down the decay of pavement structural performance, including fatigue cracking, top-down cracking, and subgrade rutting. Zhu S. et al. (2023) studied the skid resistance and its evolution trend prediction models of different asphalt mixtures using a small accelerated loading device (MLS11). The results showed that the dense-graded asphalt mixtures with a smaller oil–stone ratio had better skid resistance.
From the aforementioned research, the literature showed that many researchers have conducted extensive research on the effects of pavement structure on performances and have achieved many meaningful research achievements (Lee et al., 2007; Wang et al., 2022; Zhu et al., 2023). However, they only observed a single pavement structure, used relatively single pavement structural materials, and mainly used the accelerated pavement test or simulation software to explore the relationship between the long-life pavement structure and performances. Therefore, based on the experimental section and the observation data, this paper will analyze the correlations between pavement performance differences and pavement structures, and study the effects of pavement structures, seasonal factors, and the thickness of the structure layer on road performances. The research results can provide theoretical support for the design and performance prediction of long-life pavement structures.
With the continuously growing traffic volume and vehicle axle load, the structural damage of highway pavements is becoming increasingly prominent. The asphalt pavement with a semi-rigid base is the typical pavement structure in China. The practice has proved that simply increasing the thickness and strength of the semi-rigid base cannot meet the requirements of road performance and service life. To explore the relationship between pavement structures and service performances, this paper selected three pavement structures, including the full-depth asphalt pavement structure, composite base asphalt pavement structure, and the semi-rigid base asphalt pavement structure, as the experimental sections. In the full-depth asphalt pavement, the asphalt mixture was used for all courses above the subgrade or improved subgrade and laid directly on the prepared subgrade. Figure 1 shows the layer thickness and materials of the four pavement structure types. Table 1 shows the abbreviation for the materials in the pavement structure. Under the same conditions, this paper conducted experimental sections and compared the performances of different pavement structure types. Furthermore, the performance grade (PG) represents the performance of asphalt. AC13F with PG76-22 show better high-temperature performance than AC13F with PG64-22. Table 2 shows the thickness of the materials in the pavement structure.

FIGURE 1. Layer thickness and materials of the pavement structure.
TABLE 1. Abbreviations for pavement structural materials.
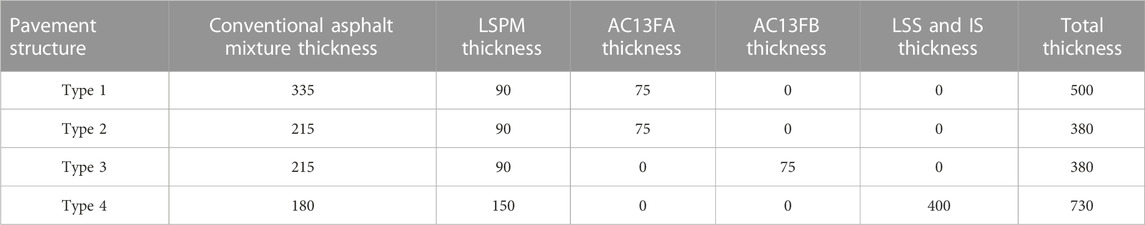
TABLE 2. Thickness of various materials in the pavement structure (mm).
In this study, the performance evaluation indicators of the long-life pavement contain the deflection value, rut depth, roughness, anti-slip ability, and disease area. The first and second performance observations of the experimental section were conducted in spring and summer, respectively. To explore the relationship between the pavement structure types and pavement performances, we collected three research works based on the data from the experimental road sections and some historical detection data, and three research works were conducted.
i. This paper explores the effects of pavement structure types on the deflection value, rut depth, skid resistance, and disease area. Among them, the skid resistance contains the texture depth (TD), British Pendulum Number (BPN), sideway force coefficient (SFC), and international roughness index (IRI).
ii. Then, this paper explores the correlation between the pavement structure and pavement performances from three dimensions: seasonal factors, pavement structure, and lanes. The Shandong province is in the temperate monsoon climate region, and the average temperature in the spring is 12°C–18°C and in the summer is 28°C–32°C. Therefore, this paper explores the influence of seasonal factors on the deflection value and rut depth.
iii. Finally, this paper analyzes the correlations between the pavement structural layer thickness and pavement performances using analysis of variance.
This paper uses the multifunctional pavement testing vehicle, testing vehicle for sideway force coefficient, falling weight deflectometer, sand patch test, and pendulum friction tester to evaluate the performances of the experimental sections. Figure 2 shows the appearance and details of the testing equipment. According to T0974, T0935, and T0975 of the Field Test Methods of Highway Subgrade and Pavement (JTG 3450-2019) (Research institute of highway ministry of transport, 2019), the multifunctional pavement testing vehicle measured the roughness, rut depth, and disease area of the road surface. Based on T0961, T0964, and T0965 of the Field Test Methods of Highway Subgrade and Pavement (TG 3450-2019), the skid resistance performances, including TD, BPN, and SFC, were appraised with the sand patch test, pendulum friction tester, and testing vehicle for determining the sideway force coefficient. Following T0953, this paper utilized the falling weight deflectometer to measure the deflection value of the pavement structure. For the roughness, rut depth, BPN, and disease area of the road surface, five parallel tests were conducted under the same test condition. For others, three parallel tests were conducted.
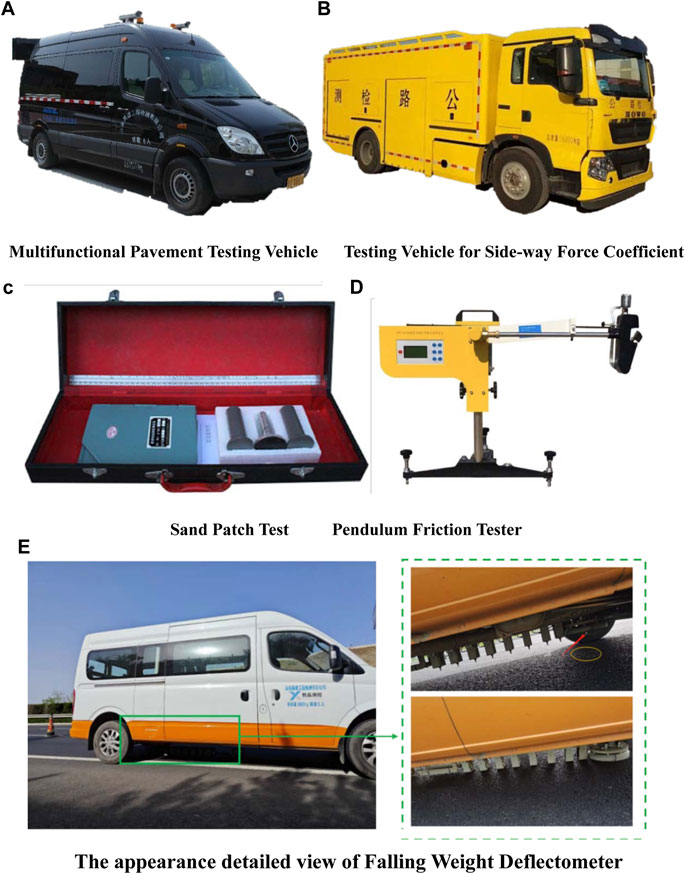
FIGURE 2. Appearance of the testing equipment. (A) Multifunctional pavement testing vehicle. (B) Testing vehicle for determining the sideway force coefficient. (C) Sand patch test. (D) Pendulum friction tester. (E) Detailed view of the falling weight deflectometer.
To quantitatively appraise the grade of pavement surface diseases, this paper calculated the areas of transverse cracks, longitudinal cracks, loosens, and strip repair on the pavement surface. The calculation steps for the disease area were as follows: i. the multifunctional pavement testing vehicle collected the image information on the pavement surface. ii. Using the square grid (0.1 m × 0.1 m), the diseased areas in the image were marked. iii. The software program automatically calculated the number of squares to obtain the disease areas. Figure 3 shows the effect of automatic disease labeling.
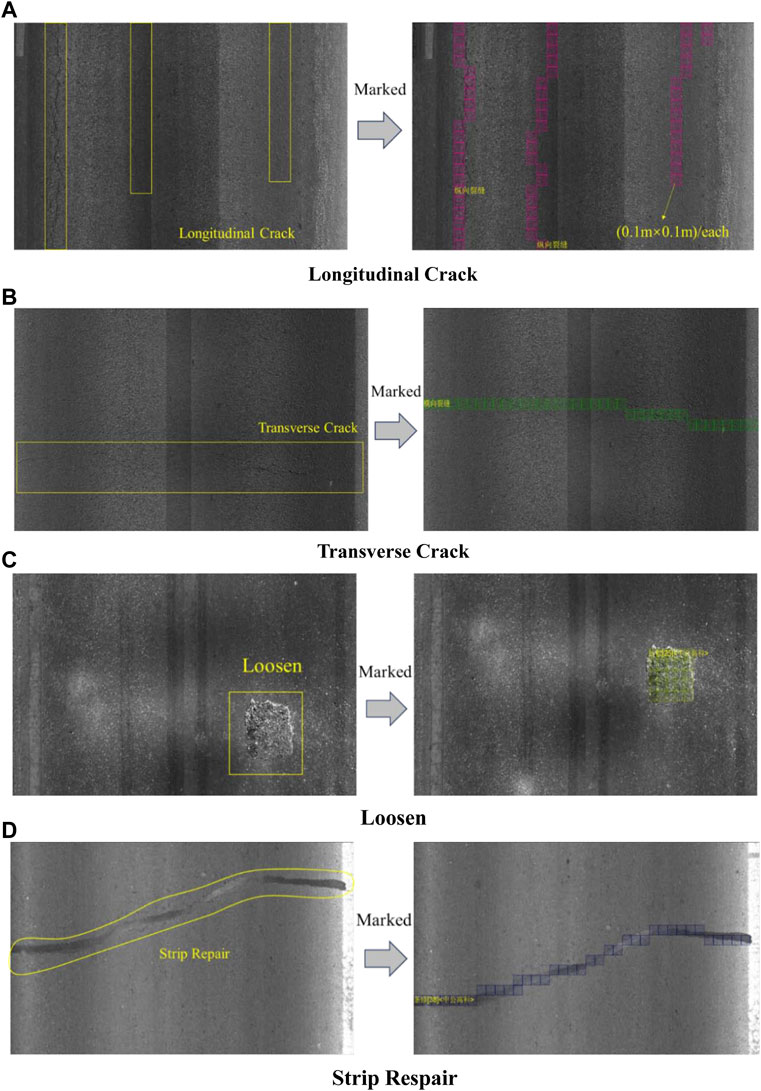
FIGURE 3. Marking process of the disease area. (A) Longitudinal crack. (B) Transverse crack. (C) Loosen. (D) Strip repair.
The interquartile range (IQR) is a method in descriptive statistics to determine the difference between the third quartile (Q3) and the first quartile (Q1). The IQR is usually used to construct a box plot and provide a brief graphical overview of the probability distribution. IQR of the box plot is often used to filter the outliers in the data, providing a standard for identifying the outliers. The outliers are often defined as values less than Q1-1.5IQR or greater than Q3+1.5IQR. The interquartile range (IQR) represents the difference between Q3 and Q1.
Analysis of variance (ANOVA) is used to measure the significance of differences in the mean values of two or more samples. The calculation steps for ANOVA are as follows:
i. Establishing hypothesis testing, H0: multiple sample populations with equal mean values, meaning that the independent variable significantly affects the dependent variable. H1: multiple sample populations with unequal or incomplete mean values, indicating the weak correlation between the independent variable and the dependent variable. The inspection level was 0.05 (α).
ii. Calculating the F-value of the test statistic; Eqs 1–7 show the calculation process of F.
iii. Determining the p-value, providing the significance level, and making the decisions. At the level of significance (α = 0.05) and confidence interval (95%), the probability value (P) was obtained. If p
In this study, the independent variables include the thicknesses of the conventional asphalt mixture (AM), LSPM, AC13FA, AC13FB, LSS, IS, and total thickness. The deflection value, IRI, TD, BPN, SFC, rut depth, and disease area are the dependent variables.
The Pearson correlation coefficient, a commonly used statistical method, can assess the strength and direction of the linear relationship between two variables. Its value range is between −1 and 1, where −1 represents a perfect negative correlation, 1 represents a perfect positive correlation, and 0 represents no correlation. The Pearson correlation coefficient can be calculated based on the covariance and standard deviation of two variables, as shown in Eq. 8. The Pearson correlation coefficient is the product of the covariance of two variables divided by their respective standard deviations, resulting in a low sensitivity of the Pearson correlation coefficient to variable scales. Therefore, it can be used for correlation analysis between variables at different scales.
To investigate the impact of seasonal factors on the bearing capacity of pavement structures, the deflection values for the four pavement structure types were collected in both spring and summer, and data analysis was conducted. To ensure comprehensive analysis, three dimensions were selected: overall analysis, analysis based on both the season and road structure, and analysis based on the season, road structure, and lane. Figure 4A shows the box plot of the deflection values for the four types. Data preprocessing, the removal of missing values and outliers, was performed on the collected deflection values. The outliers were handled using the interquartile range method. Considering the differences in the bearing capacity of different pavement structures, outlier handling was performed based on the seasonal and road structural dimensions. Figure 4B shows the box plot after the outlier handling process.
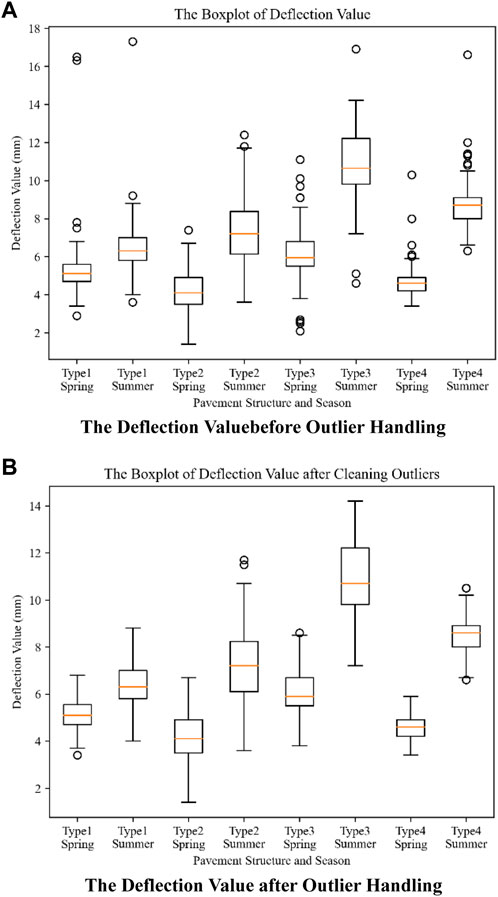
FIGURE 4. Box plots of deflection values before and after outlier handling. (A) Deflection value before outlier handling. (B) Deflection value after outlier handling.
The pavement structure affected the deflection value of the pavement structure. Figure 5 shows the average deflection value of each pavement structure. The type 4 and type 2 pavement structures have lower deflection values, indicating that the semi-rigid base and asphalt mixtures with the lower performance grade (PG) can improve the strength and bearing capacity of pavement structures. In addition, the pavement structure (type 1) has the largest thickness of the asphalt mixture, and the asphalt mixture with viscoelastic properties cannot provide relatively high strength and bearing capacity for pavement structures. The asphalt mixtures with the higher PG cannot provide sufficient bearing capacity for the type 3 pavement structure.
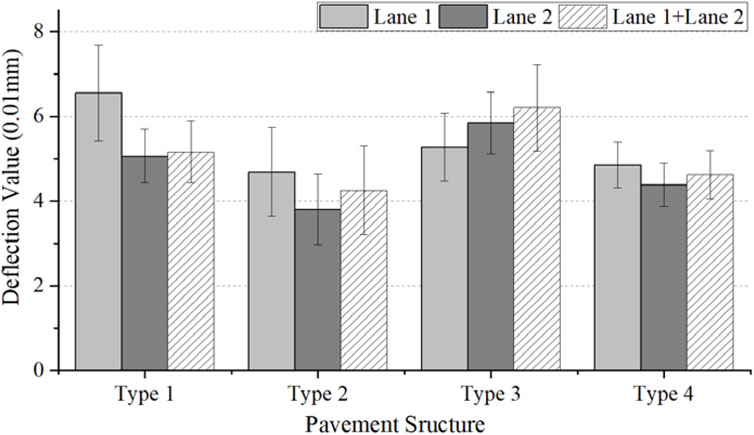
FIGURE 5. Deflection value of the pavement structure.
Frequency histograms of the deflection values were plotted for the three data dimensions, as shown in Figures 6, 7. The deflection values were divided into intervals of 0.5, and the descriptive statistics, such as sample size, mean, standard deviation, minimum value, maximum value, and median, were calculated using statistical methods. The results are shown in Table 3. Based on Figure 6 and Table 3, it can be observed that the deflection values of the four pavement structures varied with the seasons and had higher values in summer than in spring. In terms of the deflection value distribution, the values in summer are more dispersed compared to the values in spring, which is due to the higher temperature in summer. The viscosity of the asphalt concrete surface layer with the viscoelastic properties increases under high temperatures, resulting in an increase in the deflection value. Among them, the seasonal factor has the least impact on the deflection values of the type 1 structure, and the type 1 structure shows smaller distribution dispersion in both spring and summer. The thickness of the asphalt concrete layer in the type 1 structure is the largest. Owing to the same thermal conductivity coefficient (Jiao et al., 2020; Jia et al., 2023; Liu et al., 2023), the heat on the road surface continues to transmit downward, and the overall heat of the road structure is relatively low. Therefore, the effect of high temperature on the deflection value is relatively small. The asphalt concrete layer of other pavement structures is relatively thin, and the thermal conductivity coefficient of the asphalt concrete layer is different from that of other structural layers. The heat on the road surface is maintained at a high level due to the inability to effectively transfer it downward. Therefore, the high temperature significantly affects the deflection values of the type 2, 3, and 4 pavement structures. Furthermore, the type 4 structure shows smaller distribution dispersion in both spring and summer. This may be because the cement-stabilized crushed stone mixture has a larger layer thickness and high stiffness, and is less influenced by the temperature in the type 4 pavement structure. Although the properties of asphalt concrete are greatly influenced by temperature, their thinner thickness cannot change the overall stiffness characteristics of the pavement structure; therefore, the data on the deflection value in the type 4 pavement structure are relatively stable.
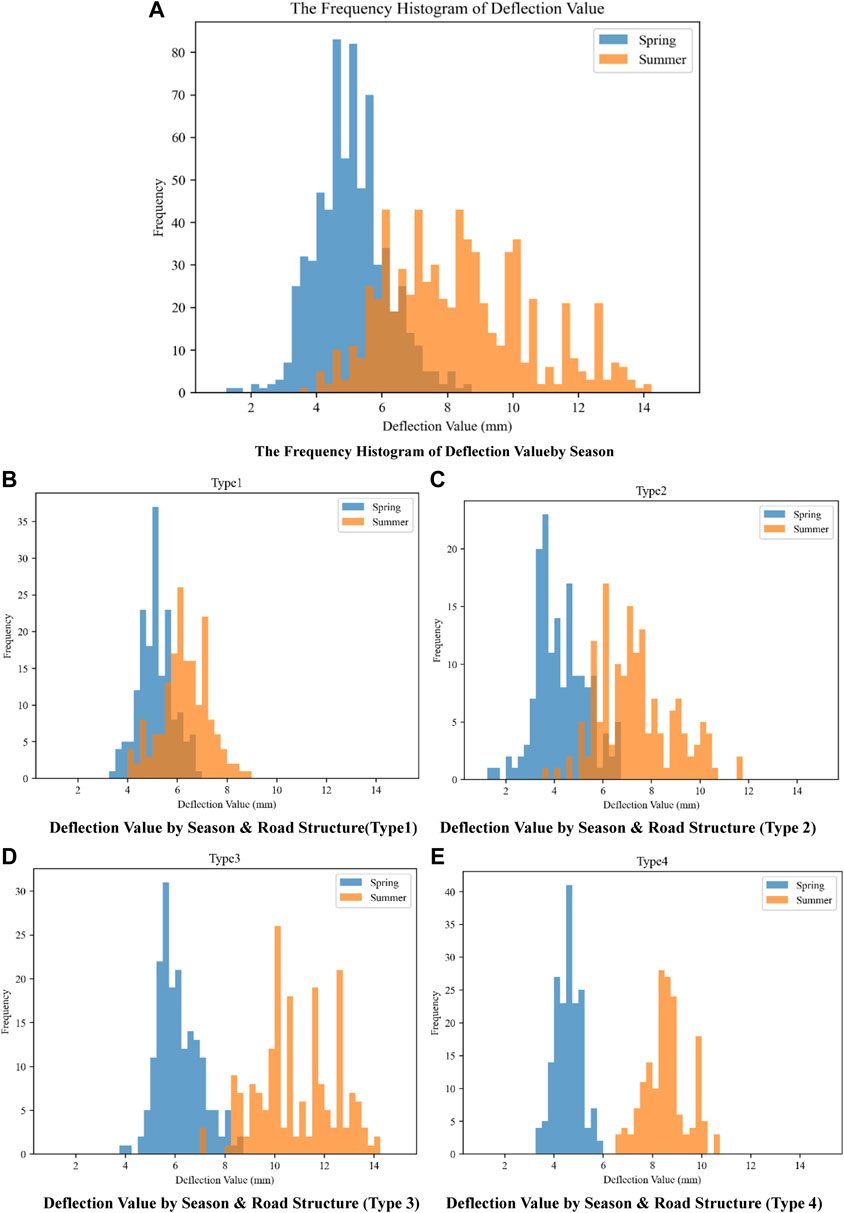
FIGURE 6. Frequency histogram of deflection value by season and road structure. (A) Frequency histogram of deflection value by season. (B) Deflection value by season and road structure (type 1). (C) Deflection value by season and road structure (type 2). (D) Deflection value by season and road structure (type 3). (E) Deflection value by season and road structure (type 4).
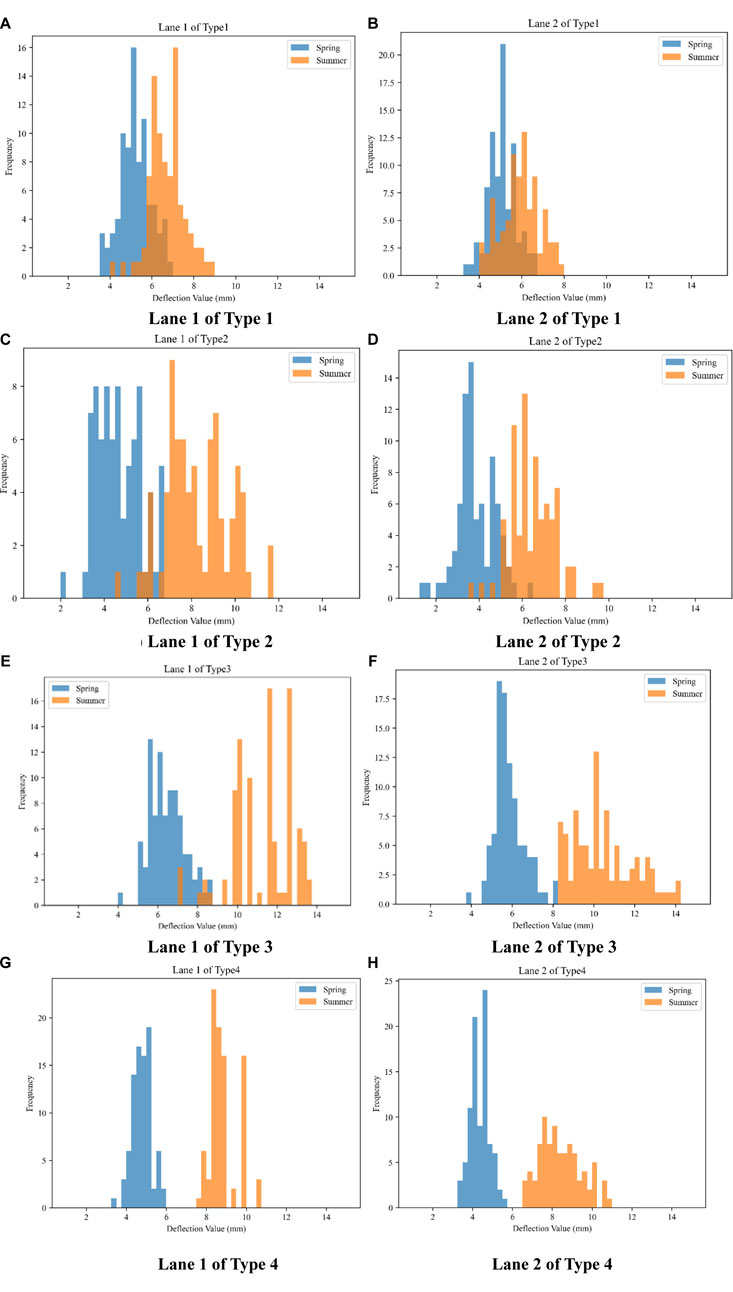
FIGURE 7. Frequency histogram of the deflection value by season, road structure, and lane. (A) Lane 1 of type 1. (B) Lane 2 of type 1. (C) Lane 1 of type 2. (D) Lane 2 of type 2. (E) Lane 1 of type 3. (F) Lane 2 of type 3. (G) Lane 1 of type 4. (H) Lane 2 of type 4.
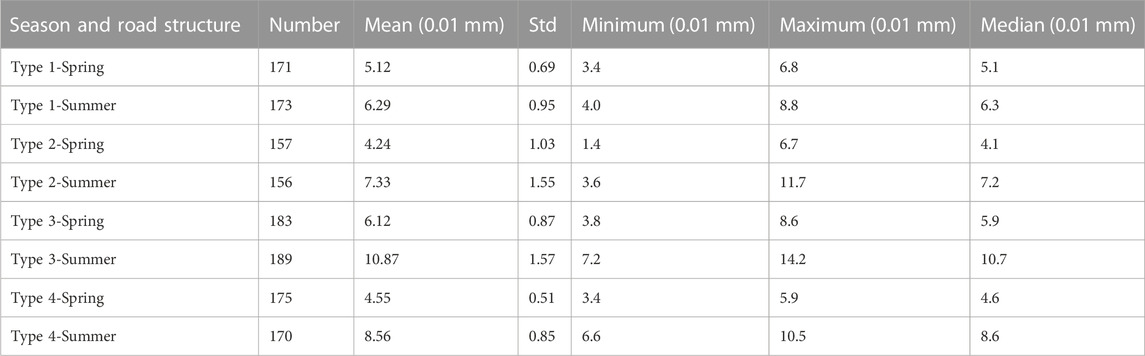
TABLE 3. Descriptive statistics of deflection value by season and road structure.
To further quantify the correlation of deflection values with seasonal changes, a correlation analysis was conducted. Tables 4, 5 show the Pearson correlation coefficients and significance levels (p-values). It indicates that the seasonal factors can affect the deflection value of the pavement structure, ignoring the influence of the different pavement structures. Table 5 shows that the type 2 and type 3 pavement structures have a strong correlation between deflection values in spring and summer, while the correlation between deflection values of the type 1 and type 4 pavement structures in spring and summer is weak. This may be because the type 3 structures contain a thicker asphalt concrete layer, while the type 4 structure contains a semi-rigid base with high stiffness.
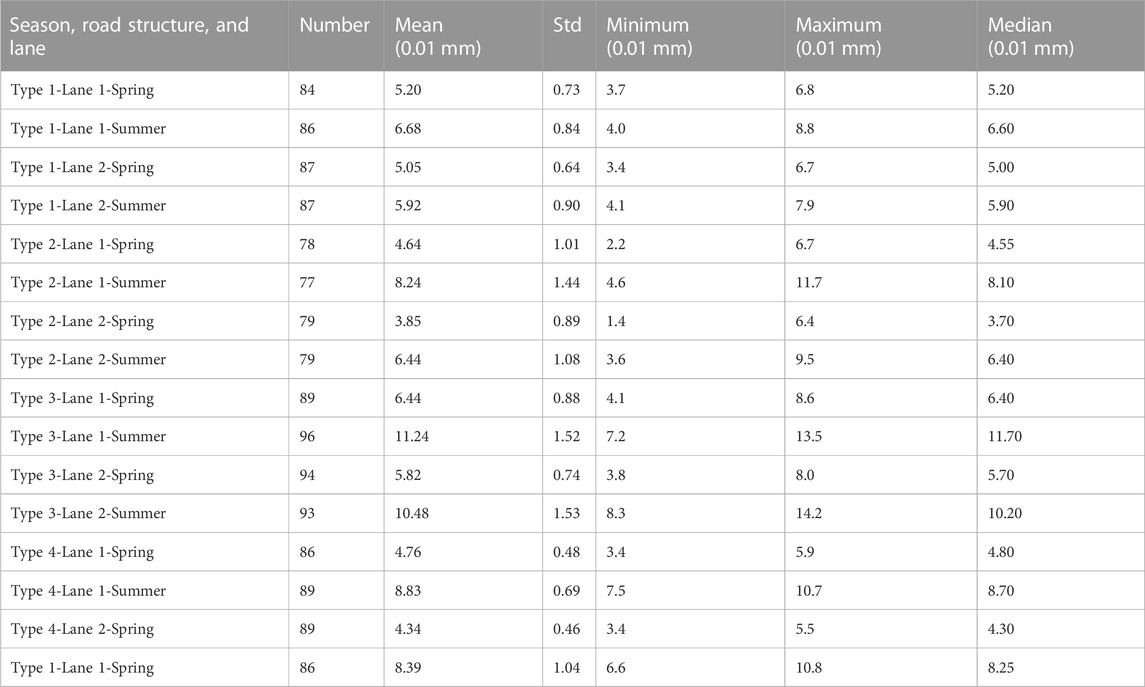
TABLE 4. Descriptive statistics of deflection value by season and road structure.
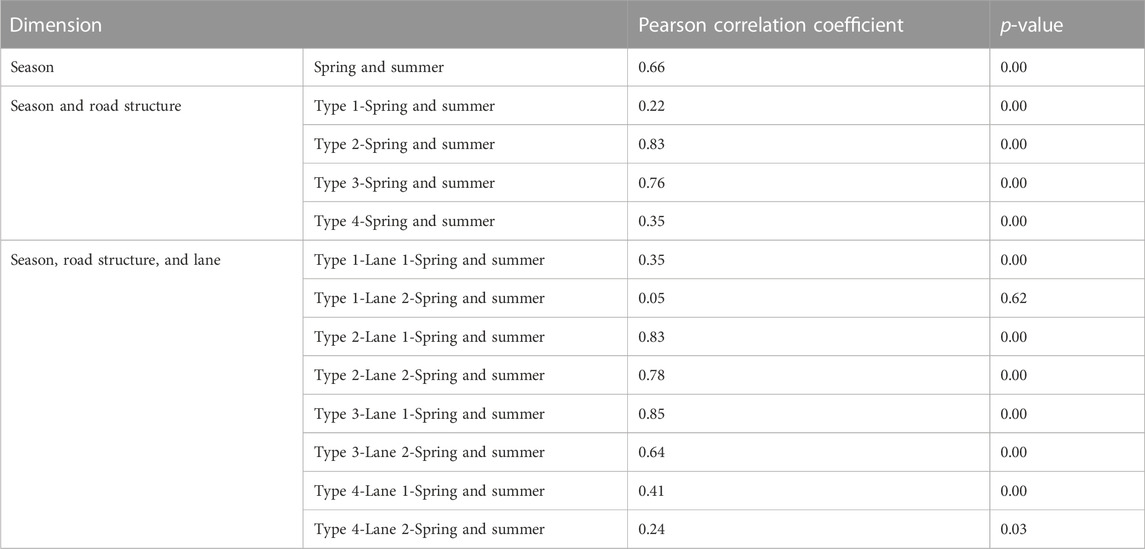
TABLE 5. Correlation of deflection value by different dimensions.
Figure 7 shows the frequency histogram of the deflection value by season, road structure, and lane. Table 5 shows the correlation of deflection values under the conditions of different pavement structures, seasons, and lanes. The type 2 and type 3 pavement structures have a strong correlation between deflection values in spring and summer, and changing lanes will not change this conclusion.
Furthermore, this paper calculated the differences in the average values of the deflection value under different seasons, pavement structures, and lanes to further explore the differences in the bearing capacity of the four pavement structures. Under the influence of high temperatures in summer and traffic loads, the comparison of the average deflection values of different pavement structures is shown in Table 6. It indicated that for the type 3 structure, the difference between the deflection values in summer and spring was the largest, followed by the type 2 structure, and the smallest value was for the type 1 structure. This means that the bearing capacity of pavement structures with a thicker asphalt concrete layer is easily affected by the high temperature in summer.
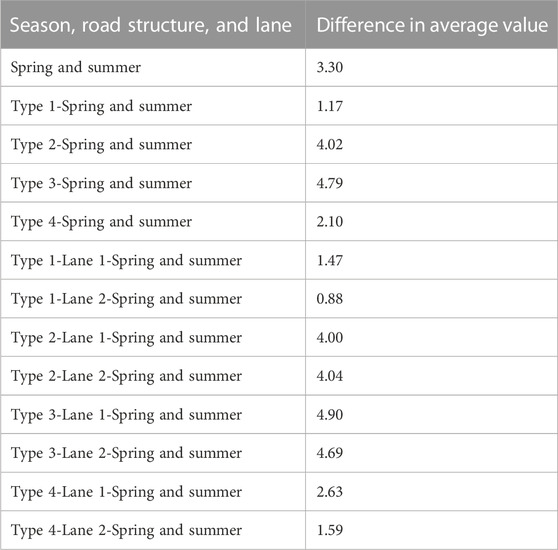
TABLE 6. Difference in average values of the deflection value under different seasons, pavement structures, and lanes.
Figure 8 shows the development trend of the rut depth in the pavement structure. For lane 1, the pavement structure could not affect the rut depth. For lane 2, the pavement structure could affect the rut depth. The main vehicle types for lane 2 and lane 1 are heavy vehicles and light vehicles, respectively. On the whole, the type 4 structure has the smallest rut depth, and the type 2 structure has the largest rut depth.
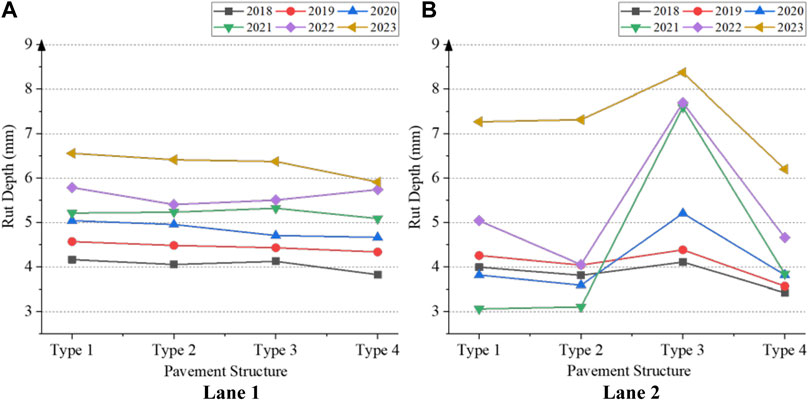
FIGURE 8. Development trend of rutting depth in the pavement structure. (A) Lane 1. (B) Lane 2.
To investigate the seasonal impact on the rut depth, the data on the rut depth for the four pavement structures were collected during the spring and summer seasons. The data analysis was conducted using the same three dimensions as the analysis of the deflection values. In terms of data preprocessing, the same method that was used for preprocessing the deflection values was employed. The box plots before and after preprocessing are shown in Figure 8.
Figure 9 shows the frequency histograms of rut depth for the three data dimensions. The rut depth was divided into intervals of 0.5, and the descriptive statistics, such as the sample size, mean, standard deviation, minimum value, maximum value, and median, were calculated using statistical methods. The results are presented in Table 7.
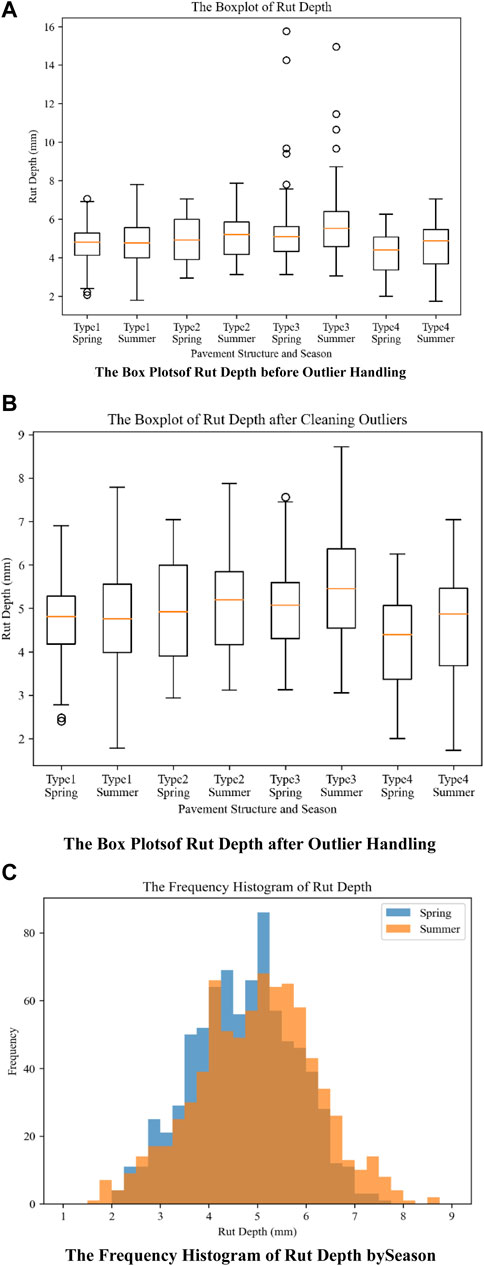
FIGURE 9. Frequency histogram of the rut depth. (A) Box plots of the rut depth before outlier handling. (B) Box plots of the rut depth after outlier handling. (C) Frequency histogram of the rut depth by season.
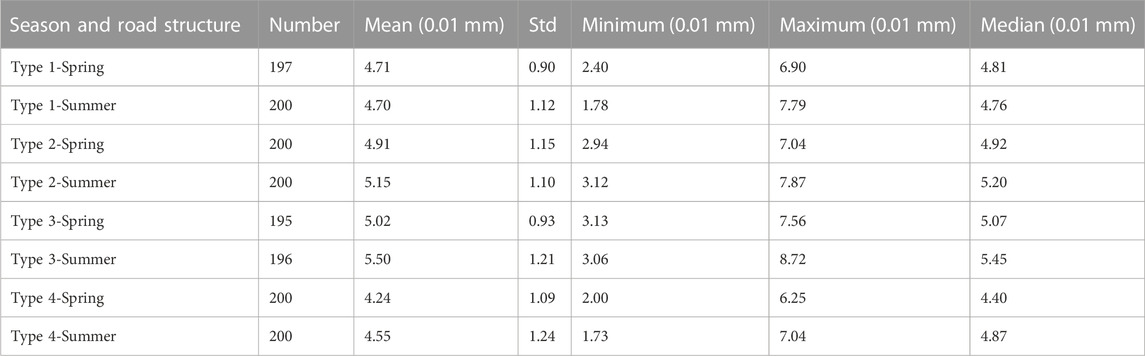
TABLE 7. Descriptive statistics of rut depth by season and road structure.
Figure 10 and Tables 7, 8 show that the rut depth of the pavement structure undergoes slight changes after the effects of high temperatures in summer and traffic loads. The rut depth in summer is slightly higher than that in spring, which can be attributed to the longer cycle of rut formation. To further quantify the correlation between the rut depth and seasonal variations, the correlation analysis was conducted using the same three data dimensions, as mentioned previously. The Pearson correlation coefficients and corresponding significance levels (p-values) were used to characterize the correlation. The results are presented in Table 9.
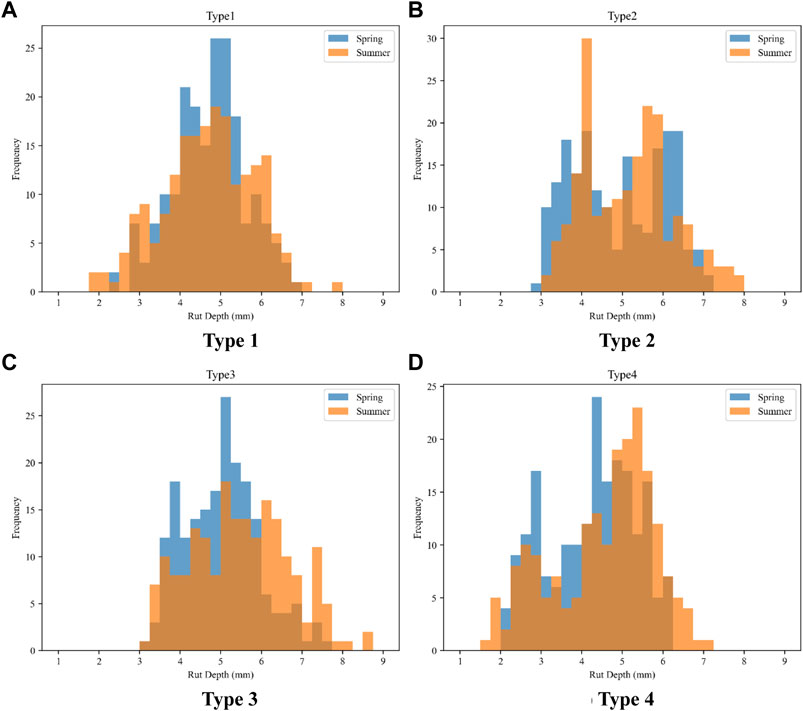
FIGURE 10. Frequency histogram of the rut depth by season and road structure. (A) Type 1. (B) Type 2. (C) Type 3. (D) Type 4.
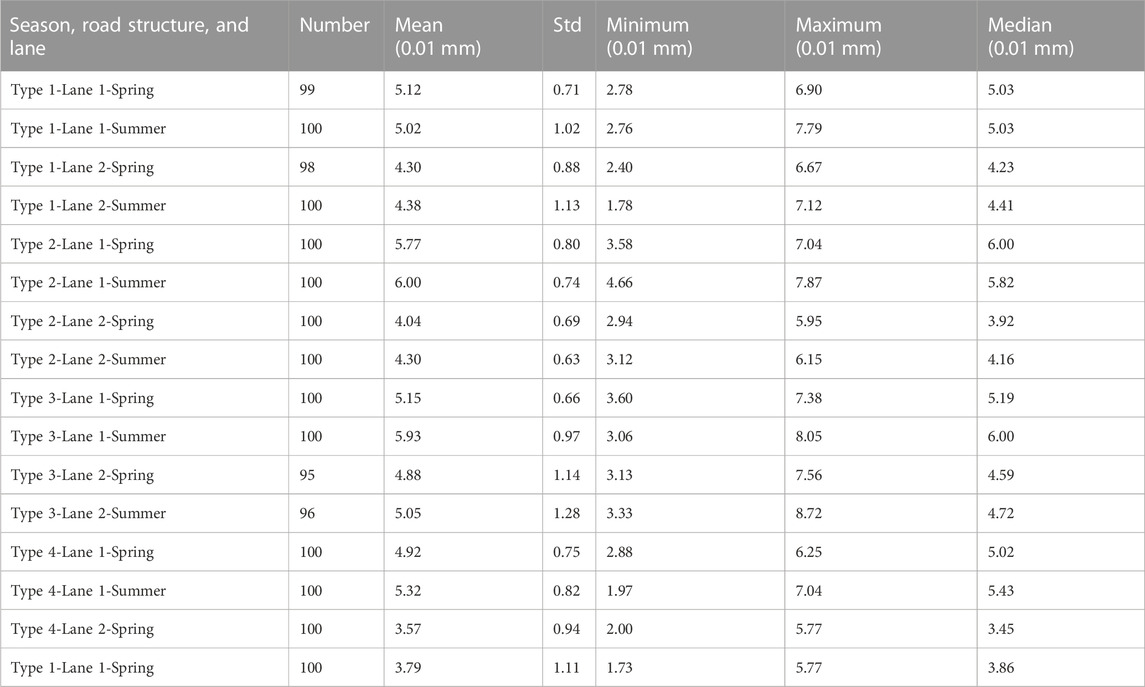
TABLE 8. Descriptive statistics of the rut depth by season and road structure.
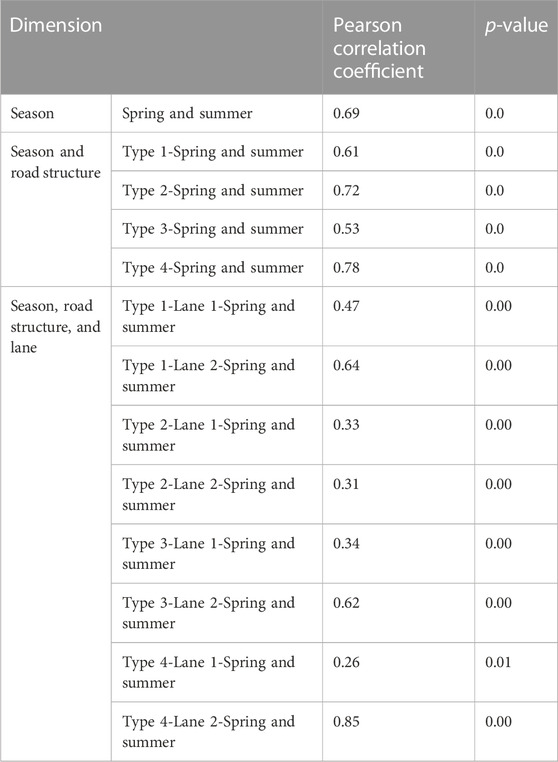
TABLE 9. Correlation of the rut depth by different dimensions.
Table 9 shows that the overall correlation for the type 2 pavement structure is relatively strong. However, for the individual lanes of the type 2 pavement structure, the correlation coefficients are 0.33 and 0.31, respectively, indicating that they have weaker correlations. This may be attributed to the smaller sample size for individual lanes and the smaller variations in rut depth between spring and summer seasons. Therefore, the lane-based correlation analysis has a higher chance of randomness, and the analysis based on the dimensions of season and pavement structure is more reliable. The significant difference in correlation coefficients between the two lanes of the type 4 pavement structure also supports this point.
Considering the correlation analysis based on the dimensions of season and pavement structure, under the influence of high temperatures in summer and traffic loads, the rut depth of the four pavement structures has undergone significant changes, and seasonal factors have an impact on the rut depth. This paper calculates the differences in the average values of rut depth under different seasons, pavement structures, and lanes, as shown in Table 10.
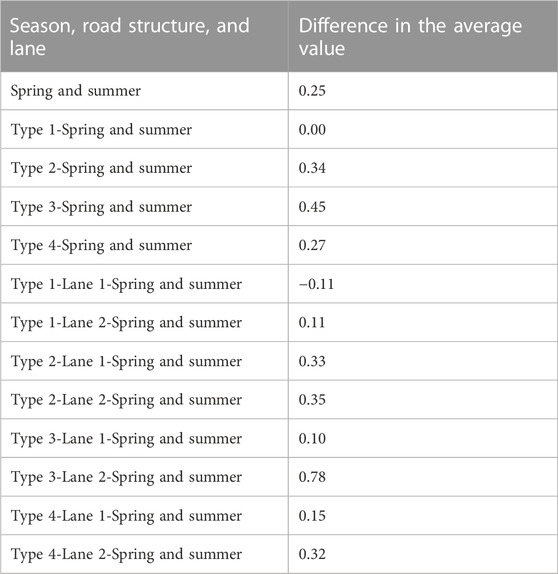
TABLE 10. Difference in average values of the rut depth under different seasons, pavement structures, and lanes.
To further explore the differences in the anti-rut ability of the four pavement structures, this paper calculates the newly added rut depth between spring and summer. Under the influence of high temperatures in summer and traffic loads, the newly added rut depth of the type 3 pavement structure is the largest, followed by that of the type 2 pavement structure, and the smallest one is that of the type 1 pavement structure. This indicates that the type 3 pavement structure has the best anti-rut ability, while the type 1 pavement structure has the worst anti-rut ability.
Figure 11 shows the TD, BPN, and SFC of the different pavement structures. For TD and BPN, there is little difference between lanes 1 and 2. The SFC of lane 1 is larger than that of lane 2. Testing vehicle for determining the sideway force coefficient can help detect the difference in the friction coefficients between lanes 1 and 2, but the sand patch test and pendulum friction test cannot achieve this. There are little differences in TD, BPN, and SFC among the different pavement structures. In terms of TD, the differences between the maximum and minimum values of the four pavement structures are 5.1%, 12.5%, and 6.9% for lane 1, lane 2, and lane 1 + 2, respectively. In terms of BPN, they are 15.5%, 10.9%, and 14.3%. In terms of SFC, they are 0.8%, 7.4%, and 2.4%.
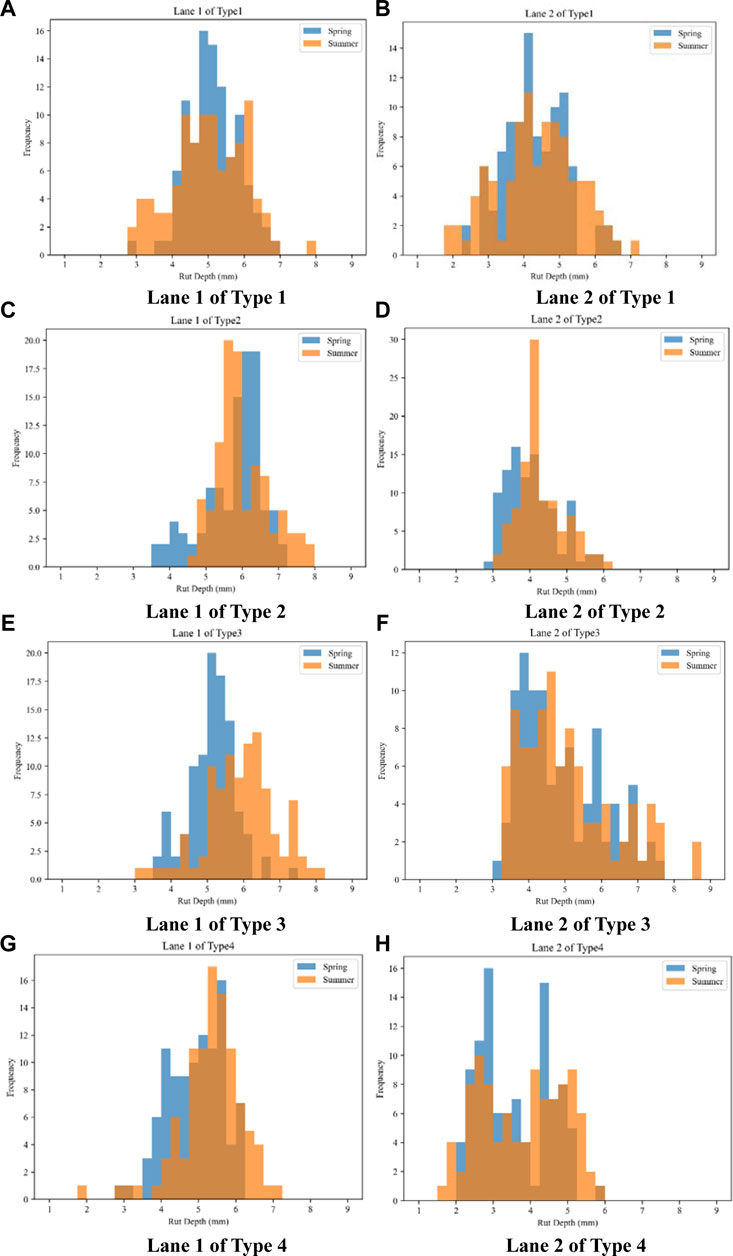
FIGURE 11. SFC, BPN, and TD of different pavement structures. (A) SFC of different pavement structures in spring. (B) BPN of different pavement structures in summer. (C) TD of different pavement structures in summer.
TD and BPN in spring are greater than those in summer, which may be because of the softening of the asphalt of the pavement surface, resulting in a slight decrease, with a decrease of less than 10% in skid resistance ability. This means that the data comparison from the two seasons did not reveal the law of the impact of different pavement structures on the skid resistance performance.
The data from lane 1 are mainly used to evaluate the relationship between the pavement structure and disease area, IRI. Figure 12A shows the disease areas of pavement structures. The asphalt pavement with a semi-rigid base and the asphalt pavement with a flexible base have the largest and the smallest disease areas, respectively. The disease area of type 3 is smaller than that of type 2, indicating that asphalt with a larger PG can help reduce the occurrence of pavement surface disease. In addition, the semi-rigid base can increase the strength of the pavement structure, reduce the deflection value, and increase the disease areas of the pavement surface. Figure 12B shows the disease type and area of the pavement structure, indicating that the main disease of the four pavement structures is transverse cracks. The area of the transverse crack in type 4 is 1.7 times, 3.2 times, and 4.5 times than that of type 1, type 2, and type 3, respectively. This may be because the semi-rigid base is prone to fracture under the action of thermal expansion and reflect to the asphalt mixture layer.
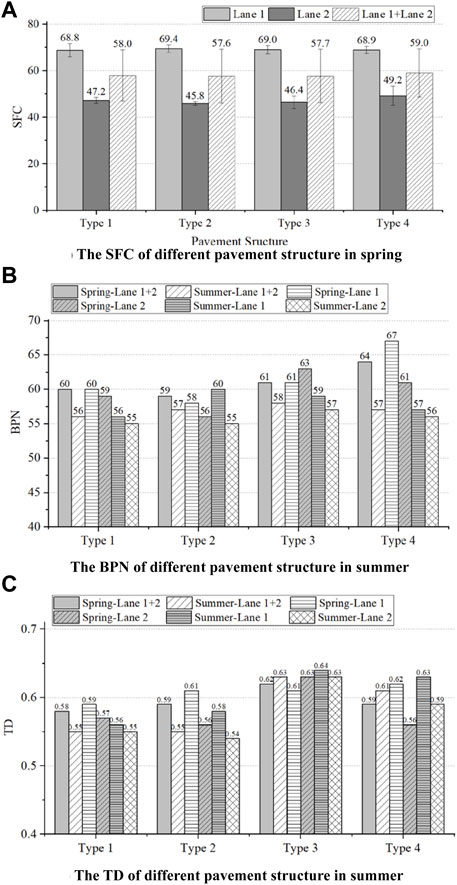
FIGURE 12. Disease type and area of different pavement structures. (A) Disease area of the pavement structure in spring and summer. (B) Disease type and the area of pavement structure in spring.
Figure 12A shows the diseased areas of pavement structures in spring and summer. The diseased areas of the type 2 and 3 pavement structures have increased, while the diseased areas of the type 1 and 4 pavement structures have slightly decreased. With the different heat transfer coefficients of pavement materials, the internal temperature diffusion efficiency of the pavement structure is low, resulting in a higher temperature on the surface of the pavement. Under the action of traffic loads, some crack diseases have self-healed.
Figure 13A shows the development trend of IRI in the pavement structure. As the service life increases, the IRI gradually increases. Overall, type 1 has the highest IRI, while other pavement structures have relatively small differences in IRI. Figure 14 shows that lane 1 in type 1 has the deepest rut depth, and Figure 11 shows that there are significant differences in the disease area between types 1, 2, and 3. It indicates that there is a strong correlation between IRI and rut depth, while a weak correlation with the disease area. In terms of the influence of seasonal factors on IRI, Figure 13B shows IRI of different pavement structures in spring and summer. The degree of influence of seasonal factors on IRI is within 5%, indicating that the seasonal factor has no effect on IRI.
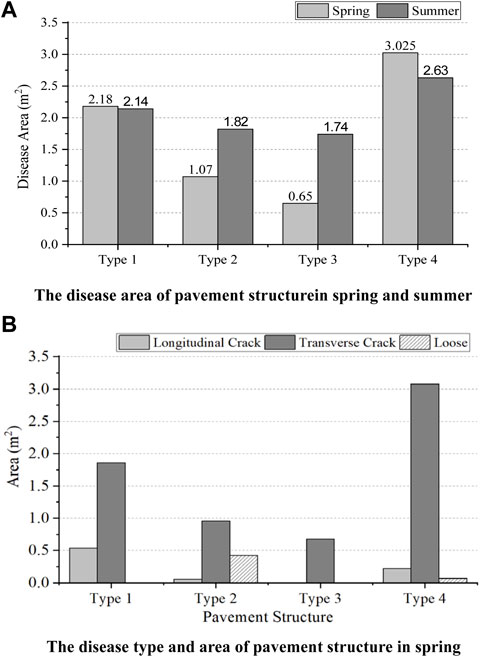
FIGURE 13. IRI in different seasons and its development trend. (A) Development trend of IRI in pavement structures. (B) IRI of pavement structures in spring and summer.
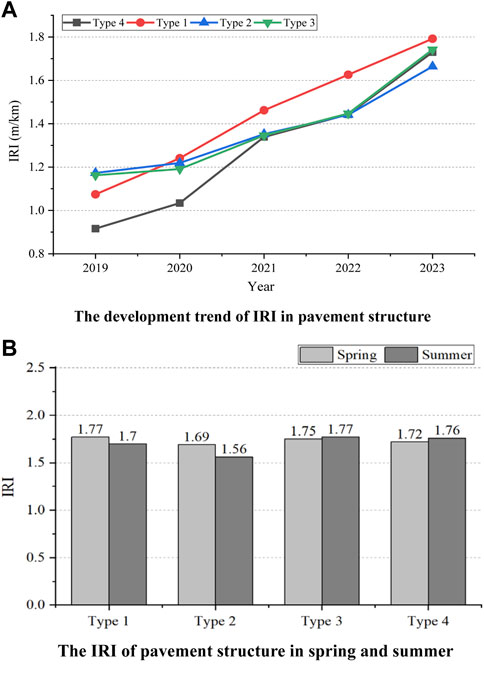
FIGURE 14. Frequency histogram of the rut depth by season, road structure, and lane. (A) Lane 1 of type 1. (B) Lane 2 of type 1. (C) Lane 1 of type 2. (D) Lane 2 of type 2. (E) Lane 1 of type 3. (F) Lane 2 of type 3. (G) Lane 1 of type 4. (H) Lane 2 of type 4.
Based on ANOVA, the effects of the pavement structure type (type), the thicknesses of the conventional asphalt mixture (AM), LSPM, AC13FA, AC13FB, LSS, IS, and pavement structure (total) on the deflection value, IRI, TD, BPN, SFC, rut depth, and disease area were analyzed. Table 11 shows F and p-values of ANOVA. The results show that the pavement structure type and thicknesses of each structure layer significantly affect the deflection value. There is a strong correlation between the type, thickness (AM, LSPM, AC13FA, LSS, and total), BPN, and SFC (lane 2). There are weak relationships between the type and thicknesses of each structure layer and the rut depth, TD, SFC (lane 1), disease area, and IRI.
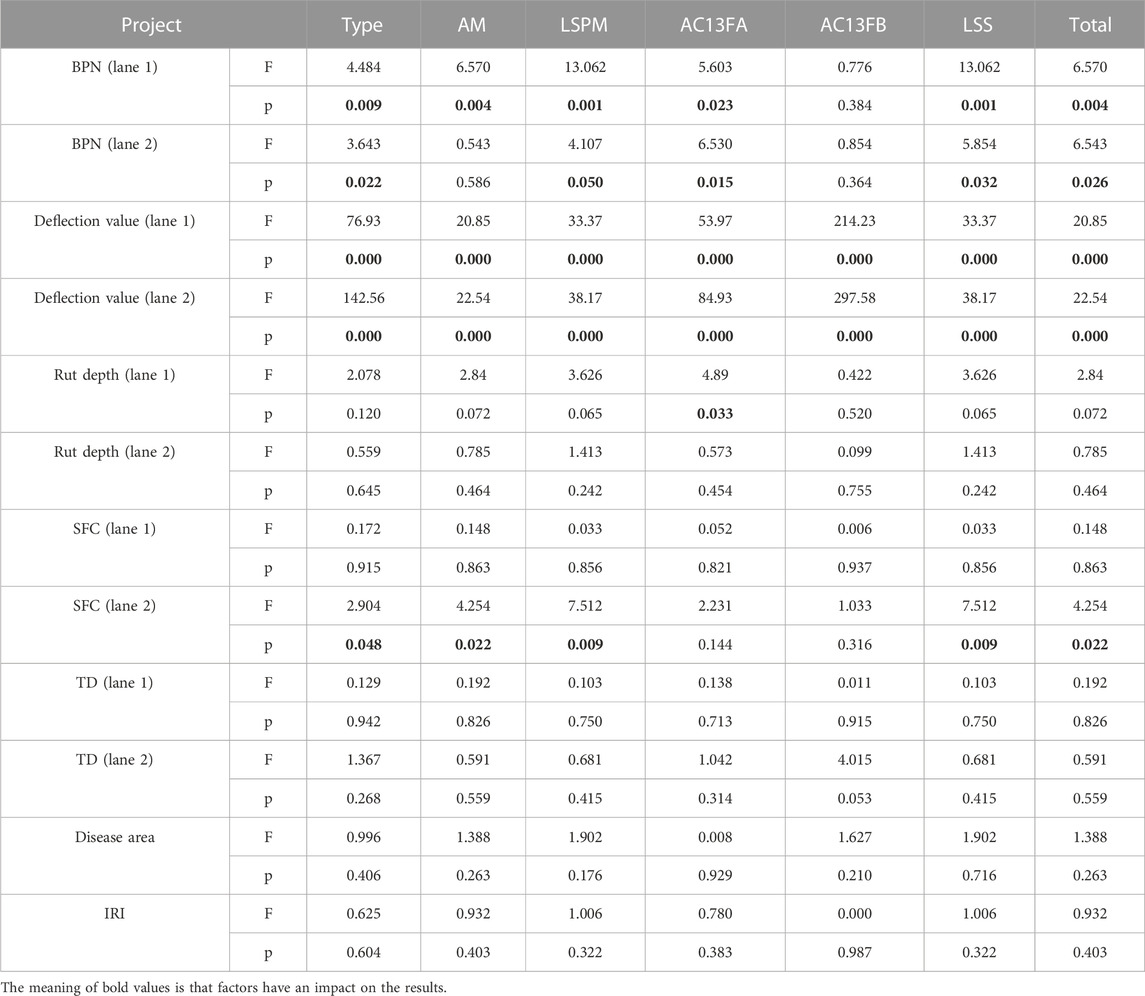
TABLE 11. Results of analysis of variance.
This paper had paved the experimental sections to research the relationships between the pavement structures and pavement performances containing the rut depth, TD, BPN, SFC, IRI, deflection value, and disease area. This paper also intensively studied the effects of seasonal factors, pavement structures, and lanes on the deflection value and rut depth by the Pearson correlation coefficient. Finally, the correlations between the layer thickness of various materials and pavement performance were evaluated by ANOVA. The following are some research conclusions obtained:
i. The pavement structures affected the deflection value, rut depth, and disease area of the road surface but did not relate to BPN, TD, and SFC. The results of ANOVA showed that the pavement structure type and thicknesses of the structural layer affected the deflection value significantly. There was a strong correlation between the structure type, thickness, BPN, and SFC. There were weak relationships between the structure type, thicknesses of each structural layer and rut depth, TD, disease area, and IRI.
ii. The seasonal factors significantly affected the deflection values and rut depth of pavement structures. The high temperatures increased the average deflection values by 22.85%, 72.88%, 77.61%, and 88.13% for the four types, respectively. Under the influence of high temperatures in summer and traffic loads, the increased ranges of the average rut depth were −0.2%, 4.89%, 9.56%, and 7.31%, respectively.
iii. The semi-rigid base layer helped enhance the strength and bearing capacity of the pavement structure. The pavement structure with a semi-rigid base had a smaller deflection value and rut depth, and the largest disease area.
iv. Increasing the thickness of the asphalt mixture was beneficial for reducing the disease area but not for increasing the structural strength of the pavement structure. The pavement structure with the asphalt mixture of low PG at the bottom layer had a smaller deflection value, rut depth, and disease area.
The previous analysis indicated that the pavement structure type and material thickness influenced the pavement performances. In complex service environments, pavement structures underwent performance degradation due to environmental factors and vehicle loads. In future research, with the continuous observation of experimental sections and accumulation of experimental data, the correlation between the environment, traffic load, pavement structure, and pavement performance will be deeply explored, providing a basis for the design of long-life pavement structures.
The raw data supporting the conclusion of this article will be made available by the authors, without undue reservation.
DX: formal analysis, funding acquisition, resources, and writing–review and editing. GG: methodology, project administration, writing–original draft, and writing–review and editing. CB: investigation and writing–original draft. CZ: data curation and writing–review and editing. DL: investigation, supervision, and writing–original draft.
The author(s) declare financial support was received for the research, authorship, and/or publication of this article. This study was sponsored by the Key Science and Technology Projects in the Transportation Industry (No. 2022-MS1-016) and the Transportation Technology Plan in Shandong Province (2022B63). The authors are grateful for the financial supports.
Authors DX was employed by Shandong Hi-Speed Group Co., Ltd. Authors GG and CZ were employed by Shandong Hi-Speed Engineering Test Co., Ltd. CB and DL were employed by Innovation Research Institute, Shandong Hi-speed Group Co., Ltd.
All claims expressed in this article are solely those of the authors and do not necessarily represent those of their affiliated organizations, or those of the publisher, the editors, and the reviewers. Any product that may be evaluated in this article, or claim that may be made by its manufacturer, is not guaranteed or endorsed by the publisher.
Chun, S., Kim, K., Park, B., and Greene, J. (2017). Evaluation of structural benefits of prime coat application for flexible pavements using Accelerated Pavement Testing (APT). Ksce J. Civ. Eng. 21 (1), 141–149. doi:10.1007/s12205-016-0746-4
Cui, P., Shao, M., Hu, X., and Sun, L. (2008). Finite element analysis for perpetual pavements structural combinations. J. Tongji Univ. Nat. Sci. 36 (10), 1388–1394. doi:10.3321/j.issn:0253-374X.2008.10.015
Erlingsson, S. (2010). Impact of water on the response and performance of a pavement structure in an accelerated test. Road Mater. Pavement Des. 11 (4), 863–880. doi:10.1080/14680629.2010.9690310
Ferne, B. (2006). Long-life pavements-a European study by ELLPAG. Int. J. Pavement Eng. 7 (2), 91–100. doi:10.1080/10298430600619059
Jia, M., Sha, A., Jiang, W., Li, X., and Jiao, W. (2023). Developing a solid–solid phase change heat storage asphalt pavement material and its application as functional filler for cooling asphalt pavement. Energy Build. 285 (15), 112935. doi:10.1016/j.enbuild.2023.112935
Jiao, W., Sha, A., Liu, Z., Jiang, W., Hu, L., Li, X., et al. (2020). Utilization of steel slags to produce thermal conductive asphalt concretes for snow melting pavements. J. Clean. Prod. 261 (10), 121197. doi:10.1016/j.jclepro.2020.121197
Lee, H. J., Lee, J. H., and Park, H. M. (2007). Performance evaluation of high modulus asphalt mixtures for long life asphalt pavements. Constr. Build. Mater. 21 (5), 1079–1087. doi:10.1016/j.conbuildmat.2006.01.003
Liu, K., Zhang, X., Wang, F., Da, Y., and Xu, P. (2023). Thermal transfer analysis method for judging the best time of removing the steel bridge deck asphalt pavement by induction heating. Therm. Sci. Eng. Prog. 37 (1), 101611. doi:10.1016/j.tsep.2022.101611
Liu, N. (2012). Field test and analysis on mechanical response of semi-rigid base of long-life asphalt pavement, master dissertation. Harbin Inst. Technol.
Liu, S., Cao, W., Fang, J., and Shang, S. (2009). Variance analysis and performance evaluation of different crumb rubber modified (CRM) asphalt. Constr. Build. Mater. 23 (7), 2701–2708. doi:10.1016/j.conbuildmat.2008.12.009
Liu, W., and Jia, Y. (2023). Comparison of type I error and statistical power between state trace analysis and analysis of variance. J. Math. Psychol. 2023 (114), 102767. doi:10.1016/j.jmp.2023.102767
Martin, J., Harvey, J. T., Long, F., Lee, E., Monismith, C. L., Herritt, K., et al. (2012). Long-life rehabilitation design and construction. Transp. Res. Circular 503, 50–65.
Research institute of highway ministry of transport (2019). Field test methods of highway subgrade and pavement (JTG 3450). Beijing, China: China Communications Press Co., Ltd.
Ritter, J., Rabe, R., and Wolf, A. (2012). Analysis of the long-term structural performance of flexible pavements using full-scale accelerated pavement tests. Procedia - Soc. Behav. Sci. 48 (1), 1244–1253. doi:10.1016/j.sbspro.2012.06.1100
Rosopa, P., and King, B. (2023). Analysis of variance: univariate and multivariate approaches. Fourth Edition. Clemson University, Clemson, SC, United States: International Encyclopedia of Education, 529–535.
Shakhan, M. R., Topal, A., and Sengoz, B. (2023). Investigation of asphalt concrete mixture types in different layers in asphalt pavement: a mechanistic approach. J. Eng. Res. 11 (1), 100027. doi:10.1016/j.jer.2023.100027
Wang, B., Huang, W., Yang, J., and Zhang, L. (2013). Analyses of structural damage and parameter sensitivity for CRCP+AC composite pavement. J. Traffic Transp. Eng. 13 (5), 17–26.
Wang, L., Wei, J., Wu, W., Zhang, X., Xu, X., Yan, X., et al. (2022). Technical development and long-term performance observations of long-life asphalt pavement: a case study of Shandong Province. J. Road Eng. 2 (2), 369–389. doi:10.1016/j.jreng.2022.11.001
Wang, X., and Zhou, X. (2019). Equivalent mechanical method for asphalt pavement structure based on material nonlinearity. China J. Highw. Transp. 32 (8), 25–34. doi:10.19721/j.cnki.1001-7372.2019.08.002
Xu, Z., and Sun, L. (1996). Effects of asphalt pavement structural combinations on pavement conditions. J. Tongji Univ. 24 (5), 515–519.
Yang, H. L., Wang, S. J., Miao, Y. H., and Sun, F. y. (2021). Effects of accelerated loading on the stress response and rutting of pavements. J. Zhejiang Univ. Sci. 22, 514–527. doi:10.1631/jzus.a2000259
Yang, Y., Wang, L., Wei, J., and Ma, J. (2010). Typical pavement structure dynamic response data collection and analysis under heavy vehicle loading. J. Highw. Transp. Res. Dev. Engl. Ed. 27 (5), 11–16. doi:10.3969/j.issn.1002-0268.2010.05.003
Ye, J., Lin, X., Mo, S., Jia, L., Chen, Y., Cheng, Z., et al. (2021). Orthogonal study and analysis of variance on a thermal management system for high-power LED package. Microelectron. J. 108, 104969. doi:10.1016/j.mejo.2020.104969
Zheng, J. (2014). New structure design of durable asphalt pavement based on life increment. China J. Highw. Transp. 27 (1), 1–7. doi:10.3969/j.issn.1001-7372.2014.01.001
Zhou, X., and Wang, X. (2018). A large-scale test method for mechanical response of pavement structure. Adv. Mater. Sci. Eng. 2018 (12), 1–12. doi:10.1155/2018/2642409
Zhou, X., Wang, X., Yuan, Y., and Li, C. (2018). Using large-scale test to investigate the surface strain of cement/asphalt concrete. Constr. Build. Mater. 170 (MAY10), 603–612. doi:10.1016/j.conbuildmat.2018.02.217
Zhu, S., Ji, X., Yuan, H., Li, H., and Xu, X. (2023b). Long-term skid resistance and prediction model of asphalt pavement by accelerated pavement testing. Constr. Build. Mater. 375, 131004. doi:10.1016/j.conbuildmat.2023.131004
Keywords: asphalt pavement, long-life, pavement structure, experimental section, performance, analysis of variance
Citation: Xiaoyan D, Guihong G, Bori C, Zheng C and Longting D (2023) Analysis of the correlation between the pavement structure combinations and pavement performance using experimental sections. Front. Energy Res. 11:1295404. doi: 10.3389/fenrg.2023.1295404
Received: 16 September 2023; Accepted: 24 October 2023;
Published: 29 November 2023.
Edited by:
Meng Jia, Shandong University of Science and Technology, ChinaReviewed by:
Minda Ren, Inner Mongolia University of Technology, ChinaCopyright © 2023 Xiaoyan, Guihong, Bori, Zheng and Longting. This is an open-access article distributed under the terms of the Creative Commons Attribution License (CC BY). The use, distribution or reproduction in other forums is permitted, provided the original author(s) and the copyright owner(s) are credited and that the original publication in this journal is cited, in accordance with accepted academic practice. No use, distribution or reproduction is permitted which does not comply with these terms.
*Correspondence: Guo Guihong, ODU4NTM1MTkzQHFxLmNvbQ==; Ding Longting, ZGx0cGhkMjAxOEAxNjMuY29t
Disclaimer: All claims expressed in this article are solely those of the authors and do not necessarily represent those of their affiliated organizations, or those of the publisher, the editors and the reviewers. Any product that may be evaluated in this article or claim that may be made by its manufacturer is not guaranteed or endorsed by the publisher.
Research integrity at Frontiers
Learn more about the work of our research integrity team to safeguard the quality of each article we publish.